- Analytics
- News and Tools
- Market News
CFD Markets News and Forecasts — 12-03-2025
- EUR/USD eased slightly on Wednesday, slipping back below 1.0900.
- EU data remains functionally non-impactful as US data weighs.
- US CPI inflation eased more than expected in February, building hopes for PPI figures.
EUR/USD bidders eased off the gas pedal on Wednesday, allowing Fiber to retreat around one-third of one percent and pushed bids back below the 1.0900 major price handle. Despite a significant recovery in EUR/USD over the last couple of weeks, buyers are settling back down after readjusting Fiber by over 5% in less than two weeks.
European economic data is barely registering on the needle this week as trade war concerns and US inflation data rule the roost. On Wednesday, the US implemented a worldwide 25% tariff on all steel and aluminum imports, marking a significant escalation in President Donald Trump’s aim to simultaneously initiate a trade war with all of the nation's allies.
In February, US Consumer Price Index (CPI) inflation fell more sharply than expected, with headline CPI at 0.2% month-over-month and 2.8% year-over-year, slightly quicker than predictions. While this remains above the Federal Reserve’s (Fed) 2% target, it has raised hopes for rate adjustments. The CME’s FedWatch Tool now indicates better than even odds for a Fed rate cut in June, up from July.
Nearly four years have passed since US headline inflation hit “transitory” levels. Aside from a brief slowdown in Q3 2024, key inflation metrics have remained steady since June 2023, when the post-Covid inflation rate eased to 3% annually.
Despite cooler CPI readings in February, there are signs of potential challenges for policymakers: gasoline and fuel oil prices fell by 3.1% and 5.1%, but natural gas prices surged by 6%. Additionally, shelter price inflation rose by 4.2% year-over-year, while a small 0.3% decrease in vehicle prices masked a 2.6% rise in food price inflation compared to last year.
EUR/USD price forecast
EUR/USD looks set to end its recent bull run, closing lower and slipping back below 1.0900 just as quickly as it jumped the major handle in the first place. However, Fiber has climbed nearly 7.6% bottom-to-top from the last major swing low near 1.0175, with bulls easily snapping the 200-day Exponential Moving Average (EMA) in the process.
EUR/USD is now running aground of technical resistance from the 1.0900 handle, a technical region that flummoxed Euro bulls the last time around back in October and November of last year.
EUR/USD daily chart
Euro FAQs
The Euro is the currency for the 19 European Union countries that belong to the Eurozone. It is the second most heavily traded currency in the world behind the US Dollar. In 2022, it accounted for 31% of all foreign exchange transactions, with an average daily turnover of over $2.2 trillion a day. EUR/USD is the most heavily traded currency pair in the world, accounting for an estimated 30% off all transactions, followed by EUR/JPY (4%), EUR/GBP (3%) and EUR/AUD (2%).
The European Central Bank (ECB) in Frankfurt, Germany, is the reserve bank for the Eurozone. The ECB sets interest rates and manages monetary policy. The ECB’s primary mandate is to maintain price stability, which means either controlling inflation or stimulating growth. Its primary tool is the raising or lowering of interest rates. Relatively high interest rates – or the expectation of higher rates – will usually benefit the Euro and vice versa. The ECB Governing Council makes monetary policy decisions at meetings held eight times a year. Decisions are made by heads of the Eurozone national banks and six permanent members, including the President of the ECB, Christine Lagarde.
Eurozone inflation data, measured by the Harmonized Index of Consumer Prices (HICP), is an important econometric for the Euro. If inflation rises more than expected, especially if above the ECB’s 2% target, it obliges the ECB to raise interest rates to bring it back under control. Relatively high interest rates compared to its counterparts will usually benefit the Euro, as it makes the region more attractive as a place for global investors to park their money.
Data releases gauge the health of the economy and can impact on the Euro. Indicators such as GDP, Manufacturing and Services PMIs, employment, and consumer sentiment surveys can all influence the direction of the single currency. A strong economy is good for the Euro. Not only does it attract more foreign investment but it may encourage the ECB to put up interest rates, which will directly strengthen the Euro. Otherwise, if economic data is weak, the Euro is likely to fall. Economic data for the four largest economies in the euro area (Germany, France, Italy and Spain) are especially significant, as they account for 75% of the Eurozone’s economy.
Another significant data release for the Euro is the Trade Balance. This indicator measures the difference between what a country earns from its exports and what it spends on imports over a given period. If a country produces highly sought after exports then its currency will gain in value purely from the extra demand created from foreign buyers seeking to purchase these goods. Therefore, a positive net Trade Balance strengthens a currency and vice versa for a negative balance.
- GBP/USD middled on Wednesday, stuck just south of 1.3000.
- UK data remains underwhelming this week as US data takes center stage.
- US CPI inflation eased in February, helping to cool inflation fears.
GBP/USD cycled near recent highs on Wednesday, building a base near the key 1.3000 handle as markets take a moment after US Consumer Price Index (CPI) inflation chilled even more than expected in February. Markets now await Thursday’s US Producer Price Index (PPI), with key consumer sentiment and consumer inflation expectations due on Friday.
The US imposed a global 25% tariff on all steel and aluminum imported into the US on Wednesday, kicking off the next critical stage of US President Donald Trump’s desire to get into a trade war with all of the US’s allies at once. A recent spat between the US and Canada came to a fizzling close this week after Donald Trump threatened to double metals tariffs on Canada just days before the US’s steel tariffs were slated to come online. After some back-and-forth posturing, both countries settled with the US imposing its “normal” 25% across-the-board tariffs on steel and aluminum, and Canada set to impose its own tariffs on a targeted amount of goods later this week.
In February, US Consumer Price Index (CPI) inflation decreased more sharply than expected, with headline CPI falling to 0.2% month-over-month and 2.8% year-over-year, dipping slightly quicker than market predictions. Although this reading is still above the Federal Reserve’s (Fed) 2% target, it has instilled some optimism that the Fed can adjust policy rates moving forward. Based on the CME’s FedWatch Tool, rate markets now suggest more than even chances of a Fed rate cut occurring in June, up from the previous expectation of July.
Nearly four years have passed since US headline inflation reached “transitory” levels, and aside from a brief slowdown in Q3 2024, key inflation metrics have largely remained consistent since June 2023, when the post-Covid inflation rate first eased to 3% on an annual basis.
Observers of commodities will note that despite the cooler CPI readings in February, there are underlying indicators that may pose challenges for policymakers soon: while gasoline and fuel oil prices generally dropped during this period—falling 3.1% and 5.1% respectively—natural gas prices surged by 6% overall. Additionally, inflation estimates for shelter prices rose by another 4.2% year-over-year, while a small decrease of 0.3% in new vehicle prices masked a rise in food price inflation, which increased by 2.6% compared to the same time last year.
GBP/USD price forecast
The GBP/USD pair is experiencing its second consecutive week of gains, approaching new 18-week highs close to 1.2950. The significant 1.3000 resistance level may limit any additional upward movement, as this key level was previously a notable consolidation point in October and November of 2024.
Currently, demand is strong among buyers, but technical indicators have remained in overbought territory since January, suggesting a potential reversal could happen soon.
GBP/USD daily chart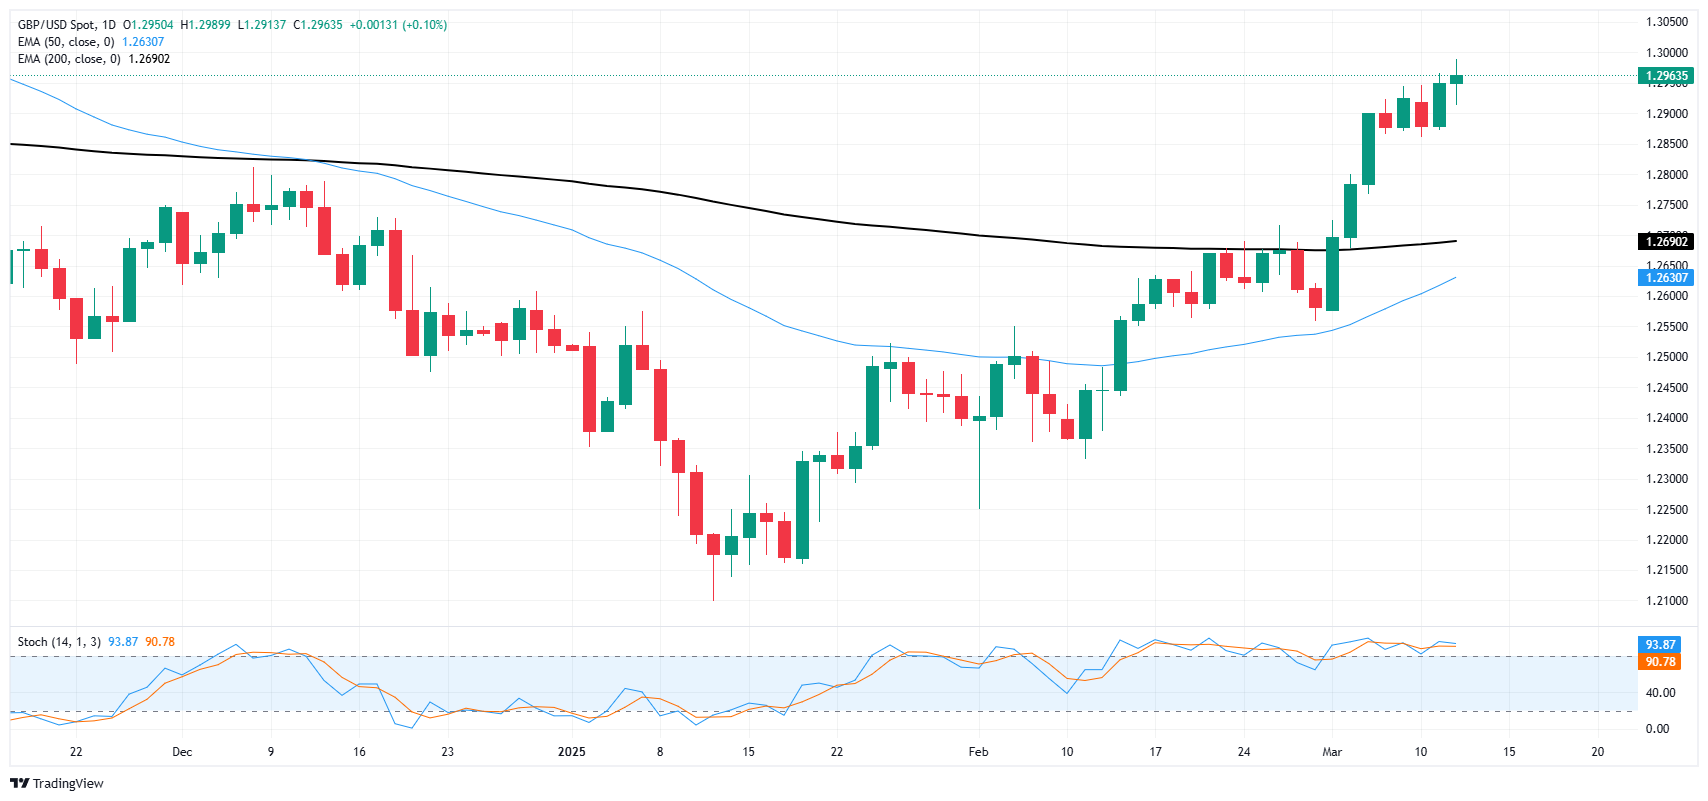
Pound Sterling FAQs
The Pound Sterling (GBP) is the oldest currency in the world (886 AD) and the official currency of the United Kingdom. It is the fourth most traded unit for foreign exchange (FX) in the world, accounting for 12% of all transactions, averaging $630 billion a day, according to 2022 data. Its key trading pairs are GBP/USD, also known as ‘Cable’, which accounts for 11% of FX, GBP/JPY, or the ‘Dragon’ as it is known by traders (3%), and EUR/GBP (2%). The Pound Sterling is issued by the Bank of England (BoE).
The single most important factor influencing the value of the Pound Sterling is monetary policy decided by the Bank of England. The BoE bases its decisions on whether it has achieved its primary goal of “price stability” – a steady inflation rate of around 2%. Its primary tool for achieving this is the adjustment of interest rates. When inflation is too high, the BoE will try to rein it in by raising interest rates, making it more expensive for people and businesses to access credit. This is generally positive for GBP, as higher interest rates make the UK a more attractive place for global investors to park their money. When inflation falls too low it is a sign economic growth is slowing. In this scenario, the BoE will consider lowering interest rates to cheapen credit so businesses will borrow more to invest in growth-generating projects.
Data releases gauge the health of the economy and can impact the value of the Pound Sterling. Indicators such as GDP, Manufacturing and Services PMIs, and employment can all influence the direction of the GBP. A strong economy is good for Sterling. Not only does it attract more foreign investment but it may encourage the BoE to put up interest rates, which will directly strengthen GBP. Otherwise, if economic data is weak, the Pound Sterling is likely to fall.
Another significant data release for the Pound Sterling is the Trade Balance. This indicator measures the difference between what a country earns from its exports and what it spends on imports over a given period. If a country produces highly sought-after exports, its currency will benefit purely from the extra demand created from foreign buyers seeking to purchase these goods. Therefore, a positive net Trade Balance strengthens a currency and vice versa for a negative balance.
Bank of Japan officials see several reasons against intervening in the bond market even after benchmark yields hit the highest level since 2008, Bloomberg reported, citing people familiar with the matter.
Officials are determined not to step into the market unless extreme moves take place, for fear of introducing trading thresholds that might damage market functioning.
Investors need to get used to a world without the BoJ’s yield curve control after the program ended last year.
Market reaction
At the press time, the USD/JPY pair is down 0.06% on the day to trade at 148.15.
Japanese Yen FAQs
The Japanese Yen (JPY) is one of the world’s most traded currencies. Its value is broadly determined by the performance of the Japanese economy, but more specifically by the Bank of Japan’s policy, the differential between Japanese and US bond yields, or risk sentiment among traders, among other factors.
One of the Bank of Japan’s mandates is currency control, so its moves are key for the Yen. The BoJ has directly intervened in currency markets sometimes, generally to lower the value of the Yen, although it refrains from doing it often due to political concerns of its main trading partners. The BoJ ultra-loose monetary policy between 2013 and 2024 caused the Yen to depreciate against its main currency peers due to an increasing policy divergence between the Bank of Japan and other main central banks. More recently, the gradually unwinding of this ultra-loose policy has given some support to the Yen.
Over the last decade, the BoJ’s stance of sticking to ultra-loose monetary policy has led to a widening policy divergence with other central banks, particularly with the US Federal Reserve. This supported a widening of the differential between the 10-year US and Japanese bonds, which favored the US Dollar against the Japanese Yen. The BoJ decision in 2024 to gradually abandon the ultra-loose policy, coupled with interest-rate cuts in other major central banks, is narrowing this differential.
The Japanese Yen is often seen as a safe-haven investment. This means that in times of market stress, investors are more likely to put their money in the Japanese currency due to its supposed reliability and stability. Turbulent times are likely to strengthen the Yen’s value against other currencies seen as more risky to invest in.
- USD/CHF stabilizes at 0.8810 for second straight day, hugs critical 200-day SMA after rebound from yearly lows.
- Technical downtrend persists; recent lower highs and lower lows suggest bears maintain control but momentum slows.
- Break below 0.8800 could trigger deeper declines toward cycle lows; upside break opens door to 0.8850, then potentially 0.9000.
The USD/CJF holds firm around the 0.8810 mark for the second consecutive day and clings to the 200-day Simple Moving Average (SMA) at 0.8813 after bouncing off yearly lows of 0.8757. At the time of writing, the pair trades at 0.8814, virtually unchanged, as Thursday’s Asian session begins.
USD/CHF Price Forecast: Technical outlook
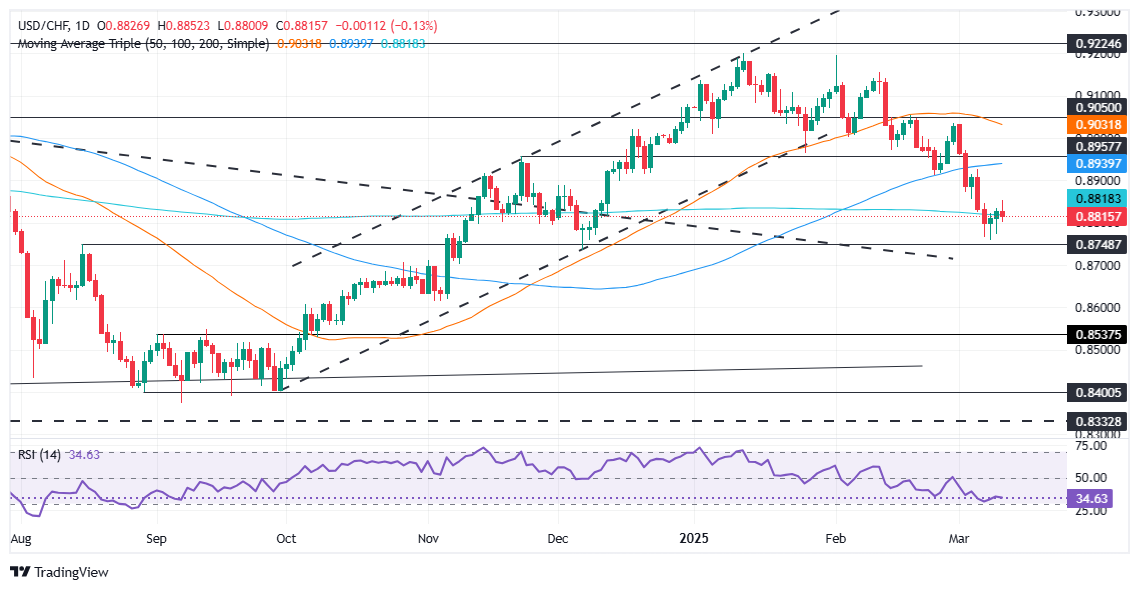
USD/CHF is in an ongoing downtrend after dropping below key dynamic support levels like the 100 and 200-day SMAs. In addition, the pair carved successive series of lower highs and lower lows, indicating that sellers might be in charge. Nevertheless, the fall halted shy of clearing the latest cycle low of 0.8726, the December 6 low.
The Relative Strength Index (RSI) began to rise on Monday but shifted flat during the session. Therefore, USD/CHF might remain sideways, awaiting a fresh catalyst.
If USD/CHF clears the 200-day SMA, this paves the way to challenge 0.8800, ahead of the latest cycle low. Otherwise, if buyers reclaim the 200-day SMA, look for a test of the 0.8850 area before rallying to the 0.9000 mark.
USD/CHF Price Chart – Daily
Swiss Franc FAQs
The Swiss Franc (CHF) is Switzerland’s official currency. It is among the top ten most traded currencies globally, reaching volumes that well exceed the size of the Swiss economy. Its value is determined by the broad market sentiment, the country’s economic health or action taken by the Swiss National Bank (SNB), among other factors. Between 2011 and 2015, the Swiss Franc was pegged to the Euro (EUR). The peg was abruptly removed, resulting in a more than 20% increase in the Franc’s value, causing a turmoil in markets. Even though the peg isn’t in force anymore, CHF fortunes tend to be highly correlated with the Euro ones due to the high dependency of the Swiss economy on the neighboring Eurozone.
The Swiss Franc (CHF) is considered a safe-haven asset, or a currency that investors tend to buy in times of market stress. This is due to the perceived status of Switzerland in the world: a stable economy, a strong export sector, big central bank reserves or a longstanding political stance towards neutrality in global conflicts make the country’s currency a good choice for investors fleeing from risks. Turbulent times are likely to strengthen CHF value against other currencies that are seen as more risky to invest in.
The Swiss National Bank (SNB) meets four times a year – once every quarter, less than other major central banks – to decide on monetary policy. The bank aims for an annual inflation rate of less than 2%. When inflation is above target or forecasted to be above target in the foreseeable future, the bank will attempt to tame price growth by raising its policy rate. Higher interest rates are generally positive for the Swiss Franc (CHF) as they lead to higher yields, making the country a more attractive place for investors. On the contrary, lower interest rates tend to weaken CHF.
Macroeconomic data releases in Switzerland are key to assessing the state of the economy and can impact the Swiss Franc’s (CHF) valuation. The Swiss economy is broadly stable, but any sudden change in economic growth, inflation, current account or the central bank’s currency reserves have the potential to trigger moves in CHF. Generally, high economic growth, low unemployment and high confidence are good for CHF. Conversely, if economic data points to weakening momentum, CHF is likely to depreciate.
As a small and open economy, Switzerland is heavily dependent on the health of the neighboring Eurozone economies. The broader European Union is Switzerland’s main economic partner and a key political ally, so macroeconomic and monetary policy stability in the Eurozone is essential for Switzerland and, thus, for the Swiss Franc (CHF). With such dependency, some models suggest that the correlation between the fortunes of the Euro (EUR) and the CHF is more than 90%, or close to perfect.
- USD/CAD edges lower to 1.4365 in Wednesday’s late American session.
- US CPI rose at the slowest pace in four months in February.
- BoC cut its key interest rate by 25 bps on Wednesday, citing trade uncerainty with the US for the decision.
The USD/CAD pair weakens to near 1.4365 during the late American session on Wednesday. The upside for the Greenback might be limited amid intense tariff uncertainty from US President Donald Trump and fears of a US recession.
US inflation rose at the slowest pace in four months in February. Data released by Labor Statistics on Wednesday showed that the US Consumer Price Index (CPI) increased 0.2% MoM in February after a sharp 0.5% advance in January. This figure came in softer than the expectation of 0.3%. The core CPI, excluding volatile food and energy categories, rose 0.2% MoM during the same period.
This inflation report fueled speculation that the US Federal Reserve (Fe) may cut rates sooner than previously thought. This, in turn, might drag the US Dollar (USD) lower against the Canadian Dollar (CAD) in the near term.
As widely expected, the Bank of Canada (BoC) on Wednesday decided to cut its key interest rate by 25 basis points (bps), bringing it down to 2.75%. This was the BoC’s seventh consecutive interest rate cut. A move that comes just hours after US President Donald Trump issued new steel and aluminum tariffs against Canada.
BoC governor Tiff Macklem said during the press conference, “In recent months, the pervasive uncertainty created by continuously changing U.S. tariff threats has shaken business and consumer confidence.” Tu Nguyen, economist at RSM Canada, said the uncertainty was hurting Canadian growth and another round of tariffs in April could limit the BoC’s options even more. This might exert some selling pressure on the Loonie and help limit the pair’s losses.
Canadian Dollar FAQs
The key factors driving the Canadian Dollar (CAD) are the level of interest rates set by the Bank of Canada (BoC), the price of Oil, Canada’s largest export, the health of its economy, inflation and the Trade Balance, which is the difference between the value of Canada’s exports versus its imports. Other factors include market sentiment – whether investors are taking on more risky assets (risk-on) or seeking safe-havens (risk-off) – with risk-on being CAD-positive. As its largest trading partner, the health of the US economy is also a key factor influencing the Canadian Dollar.
The Bank of Canada (BoC) has a significant influence on the Canadian Dollar by setting the level of interest rates that banks can lend to one another. This influences the level of interest rates for everyone. The main goal of the BoC is to maintain inflation at 1-3% by adjusting interest rates up or down. Relatively higher interest rates tend to be positive for the CAD. The Bank of Canada can also use quantitative easing and tightening to influence credit conditions, with the former CAD-negative and the latter CAD-positive.
The price of Oil is a key factor impacting the value of the Canadian Dollar. Petroleum is Canada’s biggest export, so Oil price tends to have an immediate impact on the CAD value. Generally, if Oil price rises CAD also goes up, as aggregate demand for the currency increases. The opposite is the case if the price of Oil falls. Higher Oil prices also tend to result in a greater likelihood of a positive Trade Balance, which is also supportive of the CAD.
While inflation had always traditionally been thought of as a negative factor for a currency since it lowers the value of money, the opposite has actually been the case in modern times with the relaxation of cross-border capital controls. Higher inflation tends to lead central banks to put up interest rates which attracts more capital inflows from global investors seeking a lucrative place to keep their money. This increases demand for the local currency, which in Canada’s case is the Canadian Dollar.
Macroeconomic data releases gauge the health of the economy and can have an impact on the Canadian Dollar. Indicators such as GDP, Manufacturing and Services PMIs, employment, and consumer sentiment surveys can all influence the direction of the CAD. A strong economy is good for the Canadian Dollar. Not only does it attract more foreign investment but it may encourage the Bank of Canada to put up interest rates, leading to a stronger currency. If economic data is weak, however, the CAD is likely to fall.
- AUD/JPY was seen trading around the 93.75 area ahead of the Asian session, posting a second consecutive day of gains.
- Indicators show signs of recovery, but the overall outlook remains uncertain as momentum is still in negative territory.
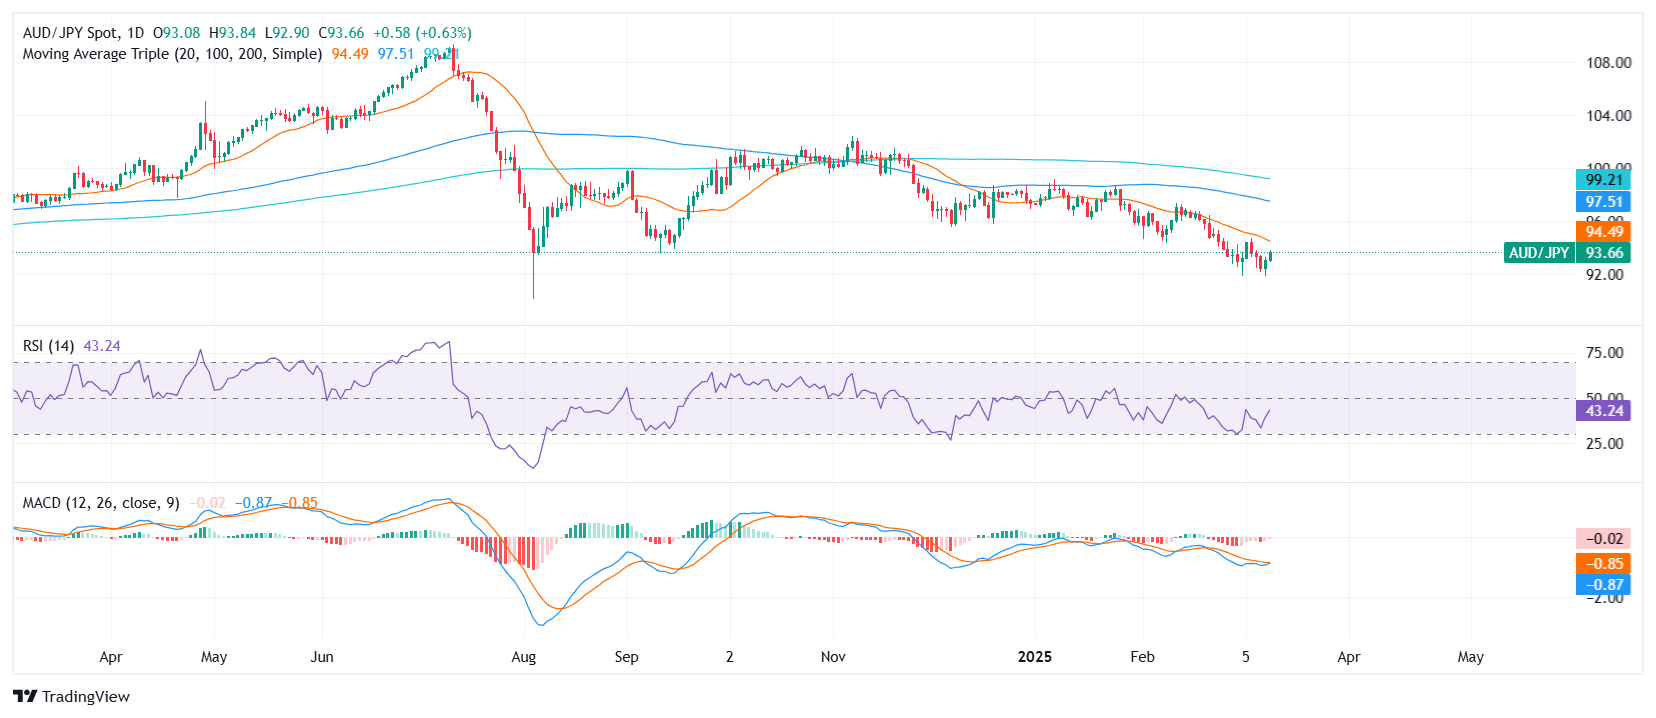
The AUD/JPY pair extended its recovery on Wednesday ahead of the Asian session, rising for the second straight day and trading near the 93.75 zone. Buyers are showing renewed interest after the recent downside, but the overall bias remains uncertain as indicators, while improving, continue to signal weakness.
Technically, the Relative Strength Index (RSI) is climbing sharply but remains in negative territory, indicating that bullish momentum is yet to fully establish. Similarly, the Moving Average Convergence Divergence (MACD) histogram is printing decreasing red bars, which suggests that selling pressure is fading, but further confirmation is needed for a sustained rebound.
Looking ahead, immediate resistance is seen near the 94.00 level, where a breakout could reinforce the short-term bullish outlook. On the downside, key support is found around 93.20, with a break below potentially triggering renewed selling pressure. If the pair manages to hold above this area, consolidation around current levels might be expected.
AUD/JPY daily chart
- XAG/USD surges to two-week highs amid softer inflation data and persistent tariff worries
- US CPI misses forecasts, fueling speculation of Fed easing and boosting Silver’s allure despite rising yields.
- Technical indicators remain bullish; RSI signals further upside as Silver buyers aim at February’s peak of $33.39.
Silver price rallied to three-week highs as it cleared the $33.00 handle on Wednesday, posting gains of over 0.90%, unfazed by a jump in US Treasury bond yields and a strong US Dollar. At the time of writing, XAG/USD trades at $33.21 after bouncing off daily lows of $32.70.
A softer-than-expected US inflation report revealed that the Consumer Price Index (CPI) dipped in headline and core measures. Although this spurred speculation that the Federal Reserve (Fed) might lower borrowing costs, it's just one month of good data, which, according to Fed Chair Jerome Powell, is not enough to stir the boat.
Meanwhile, traders continue to digest US President Donald Trump's tariff rhetoric. Trump threatens further tariffs as the EU and Canada retaliate.
XAG/USD Price Forecast: Technical outlook
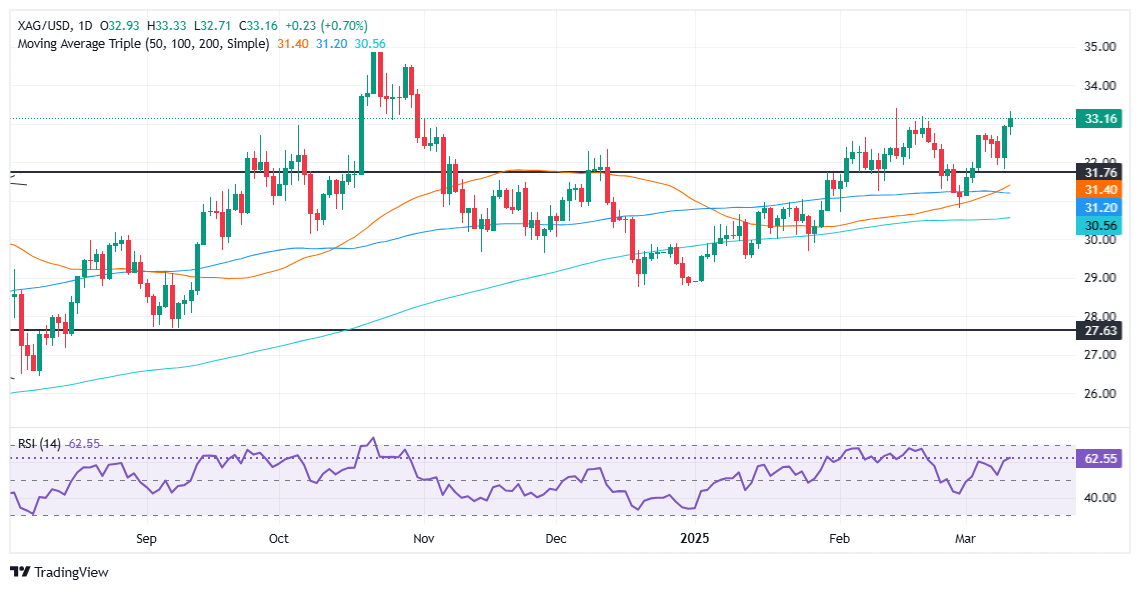
Silver's price remains upward-biased after bottoming near $32.00 for the last four trading days. Since then, XAG/USD has been up more than 2% in the week, and with momentum being a tailwind for the grey metal, further gains are seen.
The Relative Strength Index (RSI) is bullish, signaling buyers are in charge.
The first resistance would be the February 14 daily high at $33.39. A breach of that level will expose the $34.00 figure. Should sellers step in, they must clear $33.00. Once surpassed, prices could fall to March 11 swing low of $31.81.
XAG/USD Price Chart – Daily
Silver FAQs
Silver is a precious metal highly traded among investors. It has been historically used as a store of value and a medium of exchange. Although less popular than Gold, traders may turn to Silver to diversify their investment portfolio, for its intrinsic value or as a potential hedge during high-inflation periods. Investors can buy physical Silver, in coins or in bars, or trade it through vehicles such as Exchange Traded Funds, which track its price on international markets.
Silver prices can move due to a wide range of factors. Geopolitical instability or fears of a deep recession can make Silver price escalate due to its safe-haven status, although to a lesser extent than Gold's. As a yieldless asset, Silver tends to rise with lower interest rates. Its moves also depend on how the US Dollar (USD) behaves as the asset is priced in dollars (XAG/USD). A strong Dollar tends to keep the price of Silver at bay, whereas a weaker Dollar is likely to propel prices up. Other factors such as investment demand, mining supply – Silver is much more abundant than Gold – and recycling rates can also affect prices.
Silver is widely used in industry, particularly in sectors such as electronics or solar energy, as it has one of the highest electric conductivity of all metals – more than Copper and Gold. A surge in demand can increase prices, while a decline tends to lower them. Dynamics in the US, Chinese and Indian economies can also contribute to price swings: for the US and particularly China, their big industrial sectors use Silver in various processes; in India, consumers’ demand for the precious metal for jewellery also plays a key role in setting prices.
Silver prices tend to follow Gold's moves. When Gold prices rise, Silver typically follows suit, as their status as safe-haven assets is similar. The Gold/Silver ratio, which shows the number of ounces of Silver needed to equal the value of one ounce of Gold, may help to determine the relative valuation between both metals. Some investors may consider a high ratio as an indicator that Silver is undervalued, or Gold is overvalued. On the contrary, a low ratio might suggest that Gold is undervalued relative to Silver.
- Gold climbs above $2,930 as safe-haven demand overcomes rising US yields
- Softer US CPI supports bets on Fed rate cuts, fueling Gold’s rally despite USD rebound.
- Trade war fears persist; US Treasury yields rise on concerns of renewed inflation pressure from tariffs.
- Central banks continue aggressive Gold purchases, underpinning bullish sentiment.
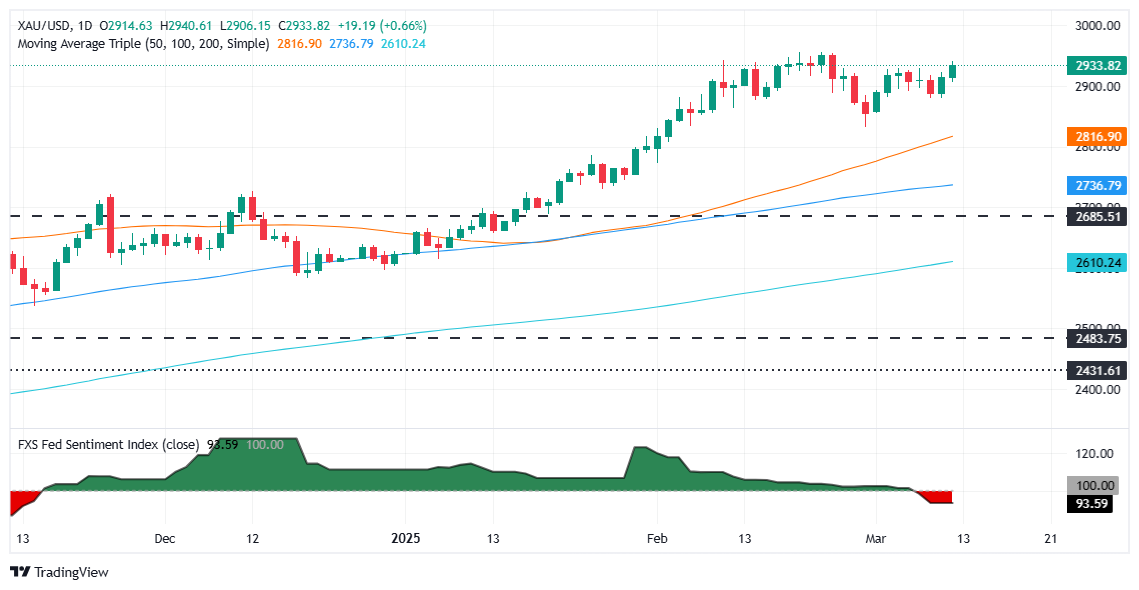
Gold price rises late in the North American session, unfazed by high US Treasury bond yields and a stronger US Dollar on Wednesday. At the time of writing, XAU/USD trades with gains of 0.63% and changes hands at $2,933 after a US inflation report that was softer than projected.
The US Bureau of Labor Statistics (BLS) revealed that consumer inflation in the United States (US) edged lower in February. Nevertheless, investors remain skeptical of the improvement as aggressive tariffs on US imports could trigger a second round of inflation.
February’s data increased the odds that the Federal Reserve (Fed) might cut interest rates thrice in 2025. Nevertheless, Fed officials, led by Chair Jerome Powell, had expressed that they do not look at just one month of data.
In the meantime, US Treasury yields climbed amid fears that the global trade war could push prices higher. Consequently, the US Dollar Index (DXY), which tracks the Greenback’s value against six currencies, gains 0.14% to 103.55.
On Wednesday, 25% US tariffs on steel and aluminum took effect at midnight as US President Donald Trump is battling to reduce the trade deficit by applying duties on imports.
The non-yielding metal is poised to extend its rally, even though there is progress on a truce between Ukraine and Russia.
The World Gold Council (WGC) revealed that central banks continued to purchase Gold. The People’s Bank of China (PBoC) and the National Bank of Poland (NBP) added 10 and 29 tonnes in the first two months of 2025, respectively.
Given the backdrop, Gold is set to test the $2,950 mark. Traders will eye the release of the US Producer Price Index (PPI) for February, Initial Jobless Claims and the University of Michigan (UoM) Consumer Sentiment.
Daily digest market movers: Gold price shrugs of high US yields
- The US 10-year Treasury bond yield recovers and rises three basis points to 4.314%.
- US real yields, as measured by the US 10-year Treasury Inflation-Protected Securities (TIPS) yield that correlates inversely to Gold prices, climb one basis points to 1.981%, capping non-yielding metal gains.
- The US Consumer Price Index (CPI) for February increased 2.8% YoY, slightly below the expected 2.9% and down from 3.0% in January, indicating continued moderation in inflation.
- Core CPI, which strips out volatile food and energy prices, dipped from 3.3% in January to 3.1% YoY, reinforcing signs of continued disinflation in the U.S. economy.
- The Atlanta Fed GDPNow model predicts the first quarter of 2025 at -2.4%, which would be the first negative print since the COVID-19 pandemic.
- Money market traders had priced in 71 basis points of easing in 2025, down from 77 bps a day ago, via data from Prime Market Terminal.
XAU/USD technical outlook: Gold prolongs its rally past $2,930
Gold price has cleared the top of the $2,880 - $2,930 trading range and hit a two-week peak of $2,940 with buyers eyeing $2,950 as the next key resistance level before clearing the record high at $2,954. Once surpassed, Gold would be poised to challenge $3,000.
Conversely, if XAU/USD drops below $2,900, the next support would be $2,850, ahead of the February 28 low of $2,832. Up next would be $2,800.
Gold FAQs
Gold has played a key role in human’s history as it has been widely used as a store of value and medium of exchange. Currently, apart from its shine and usage for jewelry, the precious metal is widely seen as a safe-haven asset, meaning that it is considered a good investment during turbulent times. Gold is also widely seen as a hedge against inflation and against depreciating currencies as it doesn’t rely on any specific issuer or government.
Central banks are the biggest Gold holders. In their aim to support their currencies in turbulent times, central banks tend to diversify their reserves and buy Gold to improve the perceived strength of the economy and the currency. High Gold reserves can be a source of trust for a country’s solvency. Central banks added 1,136 tonnes of Gold worth around $70 billion to their reserves in 2022, according to data from the World Gold Council. This is the highest yearly purchase since records began. Central banks from emerging economies such as China, India and Turkey are quickly increasing their Gold reserves.
Gold has an inverse correlation with the US Dollar and US Treasuries, which are both major reserve and safe-haven assets. When the Dollar depreciates, Gold tends to rise, enabling investors and central banks to diversify their assets in turbulent times. Gold is also inversely correlated with risk assets. A rally in the stock market tends to weaken Gold price, while sell-offs in riskier markets tend to favor the precious metal.
The price can move due to a wide range of factors. Geopolitical instability or fears of a deep recession can quickly make Gold price escalate due to its safe-haven status. As a yield-less asset, Gold tends to rise with lower interest rates, while higher cost of money usually weighs down on the yellow metal. Still, most moves depend on how the US Dollar (USD) behaves as the asset is priced in dollars (XAU/USD). A strong Dollar tends to keep the price of Gold controlled, whereas a weaker Dollar is likely to push Gold prices up.
- AUD/USD continues its upward trajectory, surpassing the 0.6300 hurdle as bullish momentum builds.
- US inflation data came in lower than expected, increasing speculation about an earlier-than-anticipated Fed rate cut.
- Trade tensions persist as the US moves forward with fresh tariffs, raising concerns about global economic growth.
- Technical indicators show improving bullish momentum, with AUD/USD eyeing the 0.6360 resistance zone.
The AUD/USD pair added to Tuesday’s uptick and trespassed the 0.6300 hurdle despite a decent rebound in the Greenback. The pair extended gains on Wednesday, supported by softening United States (US) inflation data, which bolstered expectations that the Federal Reserve (Fed) may adjust interest rates sooner than previously anticipated. While the US Dollar (USD) attempted a recovery, risk sentiment remained favorable for the Australian Dollar (AUD), opening the door for a potential test of the monthly highs near 0.6360.
Daily digest market movers: Australian Dollar extends gains as US CPI weakens
- The US Consumer Price Index (CPI) inflation slowed faster than anticipated in February, with headline CPI inflation declining to 0.2% month-over-month and 2.8% year-over-year.
- The cooling inflation data, while still above the Federal Reserve’s 2% target, reinforced expectations of potential policy adjustments. Fed rate markets now price in better-than-even odds of a rate cut by June, shifting from the previous consensus of July.
- US trade policy remains in focus as President Donald Trump reiterated his intent to impose tariffs on imported cars. During a meeting with Irish Prime Minister Micheál Martin, Trump emphasized that the European Union has been “tough” on US trade, suggesting potential further protectionist measures. The comments fueled market uncertainty regarding upcoming trade negotiations.
- The Australian Dollar remained resilient despite ongoing US-China trade tensions. Concerns persist that escalating tariffs could significantly impact Australian business activity, given Australia’s heavy reliance on exports to China. So far, the US has imposed 20% tariffs on Chinese imports, and the risk of additional measures remains.
AUD/USD Technical Analysis: Upside momentum strengthens toward 0.6360
AUD/USD rose on Wednesday, moving toward the 0.6315 region during the American session, extending its rebound from earlier in the week. Despite an attempted recovery in the US Dollar, the pair maintained bullish traction, with technical indicators showing improving conditions.
The Moving Average Convergence Divergence (MACD) indicator continues to print decreasing red histogram bars, indicating fading bearish pressure. Meanwhile, the Relative Strength Index (RSI) has risen to 54, entering positive territory and suggesting increasing buying momentum.
The pair has regained its footing and is approaching key resistance levels. The next upside target stands near 0.6360, where a break could accelerate bullish momentum. On the downside, initial support is seen around 0.6280, with stronger demand expected near 0.6250 if selling pressure re-emerges.
Australian Dollar FAQs
One of the most significant factors for the Australian Dollar (AUD) is the level of interest rates set by the Reserve Bank of Australia (RBA). Because Australia is a resource-rich country another key driver is the price of its biggest export, Iron Ore. The health of the Chinese economy, its largest trading partner, is a factor, as well as inflation in Australia, its growth rate and Trade Balance. Market sentiment – whether investors are taking on more risky assets (risk-on) or seeking safe-havens (risk-off) – is also a factor, with risk-on positive for AUD.
The Reserve Bank of Australia (RBA) influences the Australian Dollar (AUD) by setting the level of interest rates that Australian banks can lend to each other. This influences the level of interest rates in the economy as a whole. The main goal of the RBA is to maintain a stable inflation rate of 2-3% by adjusting interest rates up or down. Relatively high interest rates compared to other major central banks support the AUD, and the opposite for relatively low. The RBA can also use quantitative easing and tightening to influence credit conditions, with the former AUD-negative and the latter AUD-positive.
China is Australia’s largest trading partner so the health of the Chinese economy is a major influence on the value of the Australian Dollar (AUD). When the Chinese economy is doing well it purchases more raw materials, goods and services from Australia, lifting demand for the AUD, and pushing up its value. The opposite is the case when the Chinese economy is not growing as fast as expected. Positive or negative surprises in Chinese growth data, therefore, often have a direct impact on the Australian Dollar and its pairs.
Iron Ore is Australia’s largest export, accounting for $118 billion a year according to data from 2021, with China as its primary destination. The price of Iron Ore, therefore, can be a driver of the Australian Dollar. Generally, if the price of Iron Ore rises, AUD also goes up, as aggregate demand for the currency increases. The opposite is the case if the price of Iron Ore falls. Higher Iron Ore prices also tend to result in a greater likelihood of a positive Trade Balance for Australia, which is also positive of the AUD.
The Trade Balance, which is the difference between what a country earns from its exports versus what it pays for its imports, is another factor that can influence the value of the Australian Dollar. If Australia produces highly sought after exports, then its currency will gain in value purely from the surplus demand created from foreign buyers seeking to purchase its exports versus what it spends to purchase imports. Therefore, a positive net Trade Balance strengthens the AUD, with the opposite effect if the Trade Balance is negative.
Finally, the Greenback managed to regain some composure and clocked acceptable gains following multi-month lows. The broader scenario, however, remained clouded by intense tariff uncertainty as well as fears of a US recession.
Here is what you need to know on Thursday, March 13:
The US Dollar Index (DXY) set aside part of the multi-day deep sell-off, retesting the 103.80 zone amid rising yields. Producer Prices will be in the spotlight seconded by the usual Initial Jobless Claims.
EUR/USD met some resistance and receded to the sub-1.0900 region in response to the mild bounce in the US Dollar. Industrial Production in the euro area will be published along with speeches by the ECB’s De Guindos, Nagel and Villeroy.
GBP/USD pushed harder and came just pips away from the key 1.3000 threshold, just to give away some impulse afterwards. The RICS House Price Balance will be the sole release across the Channel.
USD/JPY added to Tuesday’s uptick, climbing to multi-day highs and briefly surpassing the 149.00 barrier. The weekly Foreign Bond Investment figures are due.
Despite tariff concerns and the uptick in the US Dollar, AUD/USD rose further north of the 0.6300 hurdle, hitting two-day peaks at the same time. The final Building Permits and Private House Approvals are expected, followed by the speech by the RBA’s Jones.
Prices of WTI rose to three-day highs near the $68.00 mark per barrel despite the ounce in the US Dollar and persistent trade war concerns.
Gold prices advanced to two-week tops around $2,940 per troy ounce following tariff jitters and the lower-than-expected US CPI print. Silver prices rose past the $33.00 mark per ounce, coming just short of the yearly peak.