- Analytics
- News and Tools
- Market News
CFD Markets News and Forecasts — 24-06-2024
- NZD/USD weakens around 0.6120 on Tuesday amid the USD softness, down 0.11% on the day.
- Fed’s Daly said the Fed should cut rates before policymakers are confident that inflation is headed towards 2%.
- The expectation the RBNZ will cut rates earlier than projected exerts some selling pressure on the Kiwi.
The NZD/USD pair trades on a softer note near 0.6120 despite the weaker US Dollar (USD) during the early Asian trading hours on Tuesday. In the absence of top-tier economic data released from New Zealand on Tuesday, speeches by FOMC members could influence USD demand ahead of the key US economic data, which are due later this week. The revision of US Gross Domestic Product (GDP) for the first quarter (Q1) is due on Thursday, and the Personal Consumption Expenditure (PCE) Price Index will be published on Friday.
The US Federal Reserve (Fed) officials emphasized that they need to see more progress on inflation before considering a rate cut. Financial markets are now pricing in a 65% odds of a Fed rate cut in September, up from 59.5% at the end of last week, according to the CME FedWatch Tool. The cautious stance from the US central bank continues to support the Greenback in the near term against the Kiwi.
San Francisco Federal Reserve Bank President Mary Daly said on Monday that she does not believe the Fed should cut rates before policymakers are confident that inflation is headed towards 2%. Daly further stated that the labour market, albeit strong, might face rising unemployment if inflation remains persistent.
On the Kiwi front, the Reserve Bank of New Zealand (RBNZ) forecast during its last policy meeting in May that the central bank wouldn’t start cutting its Official Cash Rate from 5.5% until the third quarter of next year as inflation remains elevated. Nonetheless, many analysts expect the beginning of the rate cut in early 2025. The speculation that the RBNZ will cut rates earlier than projected weighs on the New Zealand Dollar (NZD) and creates a headwind for the NZD/USD pair.
Data released on Monday showed that New Zealand’s Trade Balance arrived at NZD $-10.05B YoY in May from the previous reading of $-10.22B, according to Statistics New Zealand. Meanwhile, Exports rose to $7.16B in the same month versus $6.31B prior. Imports increased to $6.95B in May compared to $6.32B in April.
- USD/CAD posts modest gains near 1.3655 in Tuesday’s early Asian session.
- BoC Governor Tiff Macklem said the Canadian economy is on track for a soft landing.
- Investors await the release of the US GDP growth number on Thursday and the PCE Price Index on Friday.
The USD/CAD pair remains on the defensive around 1.3655 during the early Asian session on Tuesday. The USD Index (DXY) retreats from nearly two-month tops to 105.50, exerting some selling pressure on the pair. Investors will focus on the Canadian Consumer Price Index (CPI) inflation report, which is forecast to cool slightly for the year through May.
Late Monday, the Bank of Canada (BoC) Governor Tiff Macklem said that the Canadian economy is on track for a soft landing where the central bank doesn’t need a large rise in the unemployment rate to achieve the inflation target. Macklem further stated that it's reasonable to expect additional rate cuts. This speech came two weeks after the Canadian central bank lowered its policy interest rate to 4.75% from 5%, the first rate cut in four years. The Canadian Dollar (CAD) strengthens, even though investors expect that the BoC will deliver more rate cuts this year.
Meanwhile, the rise in crude oil prices amid renewed hopes of a summertime upswing in fuel demand continues to underpin the commodity-linked Loonie. It's worth noting that higher oil prices could support the CAD as Canada is the major crude oil exporter to the United States.
On the USD’s front, the US Federal Reserve (Fed) officials maintain a cautious stance on rate cuts, highlighting that their decisions would remain data-dependent. On Monday, San Francisco Fed President Mary Daly said that the Fed must continue the work of fully restoring price stability without a painful disruption to the economy. Daly added that while the central bank still has "more work to do" on bringing inflation down, inflation is not the only risk they face.
Traders will take more cues from the crucial US economic data this week. The revision of US Gross Domestic Product (GDP) for the first quarter will be released on Thursday. On Friday, the Personal Consumption Expenditure (PCE) Price Index will be published. Traders are now pricing in a 66% odds of Fed rate cut in September, up from 59.5% at the end of last week, according to the CME FedWatch Tool.
- EUR/USD recovered from last week’s downside but remains hung up on 1.0730.
- As USD flows turned lower, Euro traders shrugged off a miss in German data.
- Tuesday restricted to mid-tier releases, and a fistful of central planner speeches.
EUR/USD drifted up in a mild recovery from last Friday’s dip into 1.0670. The new trading week is kicking things off with risk appetite firmly pinned higher, sending the US Dollar lower and bolstering the Euro as investors head into a relatively quiet Tuesday.
Fed's Daly: Inflation is not the only risk, but recent inflation readings are more encouraging
Key economic data releases are relegated to later in the week, leaving traders to focus on statements from policymakers that dot the landscape until meaningful data releases kick off in the back half of the trading week. An update to US Gross Domestic Product (GDP) figures is slated for Thursday, with Friday rounding out the trading week with German Retail Sales and the latest update for US Personal Consumption Expenditure (PCE) Price Index inflation.
Fed's Goolsbee: Slowing inflation data would open door to easier policy
Tuesday’s economic calendar is notably restrained, with an appearance expected from German central bank President Joachim Nagel. During Tuesday's US market session, Federal Reserve (Fed) officials are expected to give several speeches, and central planners will likely lean into middling Fedspeak in echoes of Monday’s performances.
German sentiment surveys broadly missed expectations early Monday, but Euro markets are flaunting downside EU figures to follow the broader market higher as risk appetite continues to pin to hopes of at least a quarter-point cut from the Federal Open Market Committee’s (FOMC) September 18 rate call. According to the CME’s FedWatch Tool, rate traders are pricing in around 70% odds of a 25 basis point rate trim from the Fed in September.
EUR/USD technical outlook
EUR/USD pulled higher after walking back last Friday’s dip into 1.0670, but bullish momentum hit a snag after intraday bids got hung up on the 200-hour Exponential Moving Average (EMA) at 1.0737. EUR/USD still remains on the low side on daily candles, with price action trading on the bearish side of the 200-day EMA at 1.0815.
EUR/USD hourly chart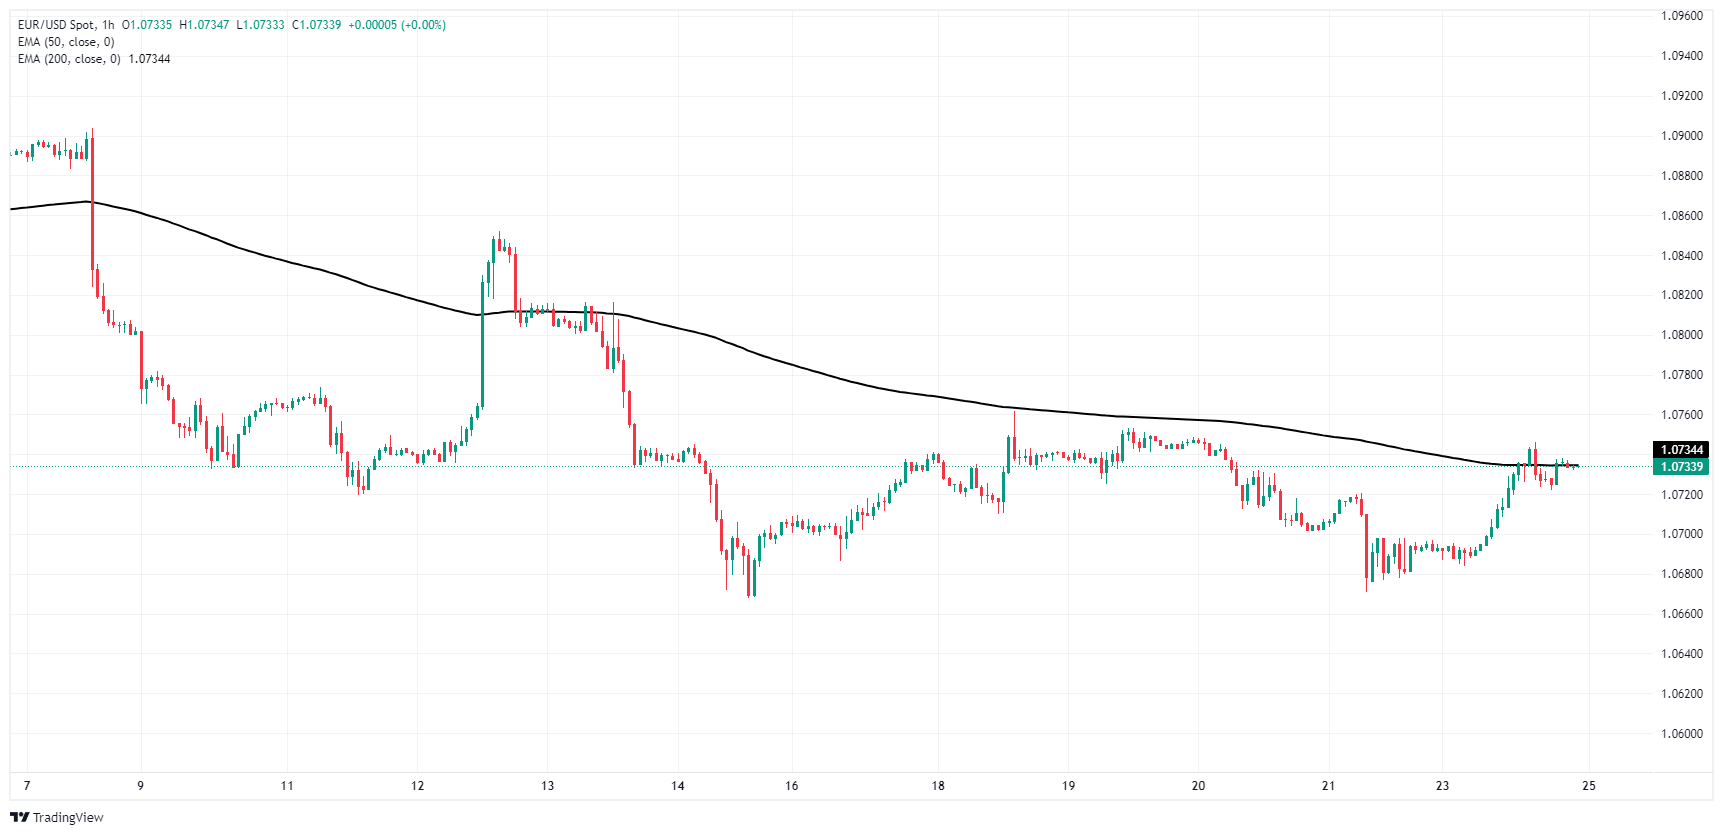
EUR/USD daily chart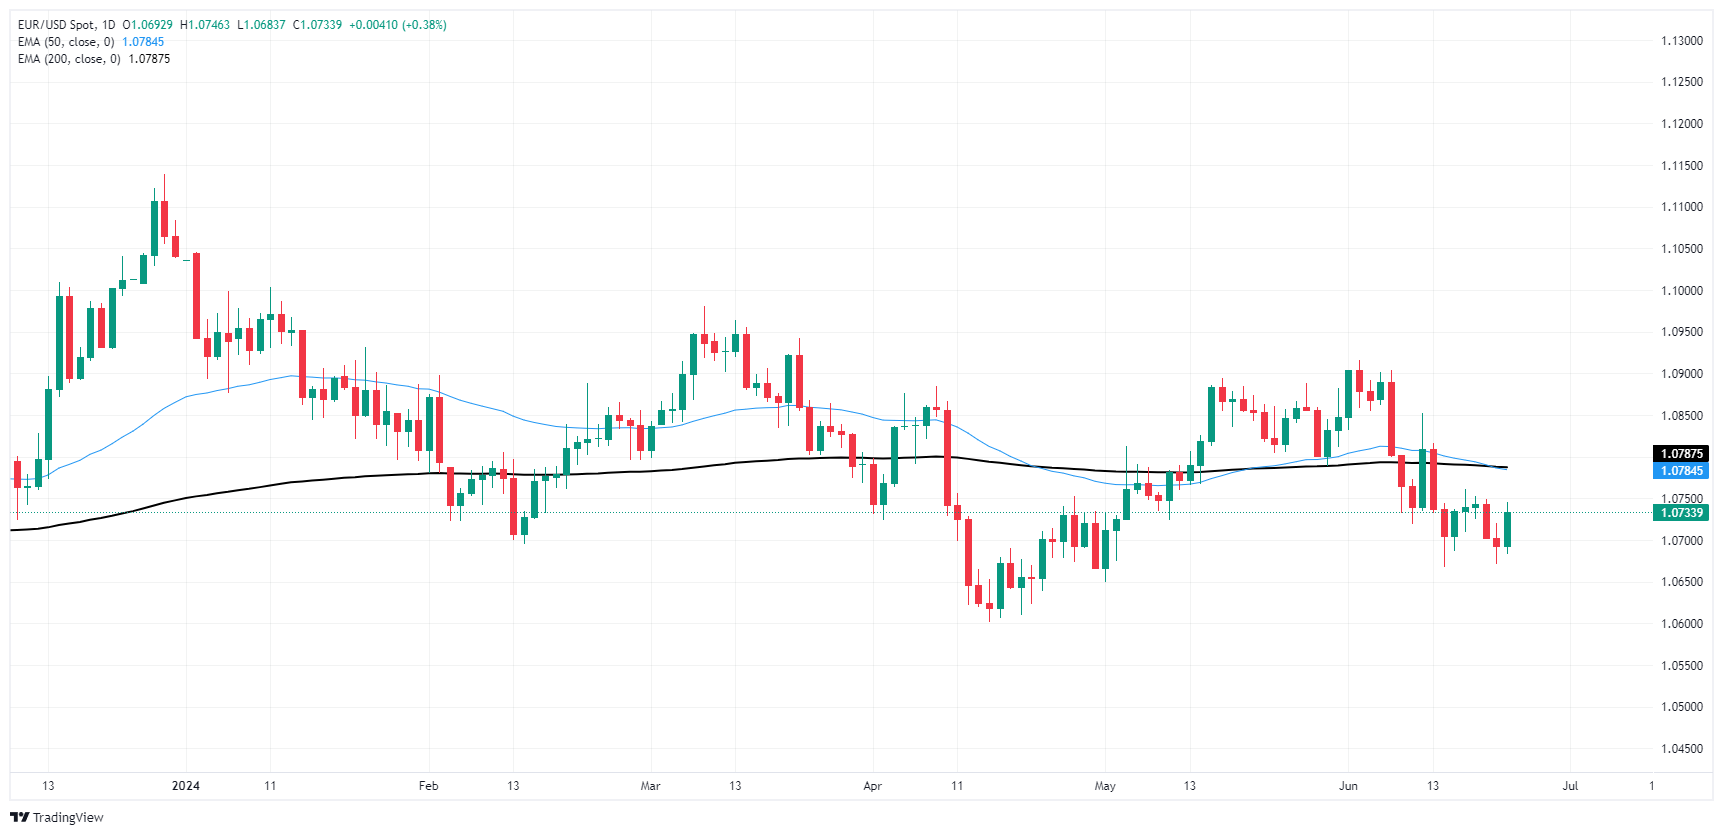
Euro FAQs
The Euro is the currency for the 20 European Union countries that belong to the Eurozone. It is the second most heavily traded currency in the world behind the US Dollar. In 2022, it accounted for 31% of all foreign exchange transactions, with an average daily turnover of over $2.2 trillion a day. EUR/USD is the most heavily traded currency pair in the world, accounting for an estimated 30% off all transactions, followed by EUR/JPY (4%), EUR/GBP (3%) and EUR/AUD (2%).
The European Central Bank (ECB) in Frankfurt, Germany, is the reserve bank for the Eurozone. The ECB sets interest rates and manages monetary policy. The ECB’s primary mandate is to maintain price stability, which means either controlling inflation or stimulating growth. Its primary tool is the raising or lowering of interest rates. Relatively high interest rates – or the expectation of higher rates – will usually benefit the Euro and vice versa. The ECB Governing Council makes monetary policy decisions at meetings held eight times a year. Decisions are made by heads of the Eurozone national banks and six permanent members, including the President of the ECB, Christine Lagarde.
Eurozone inflation data, measured by the Harmonized Index of Consumer Prices (HICP), is an important econometric for the Euro. If inflation rises more than expected, especially if above the ECB’s 2% target, it obliges the ECB to raise interest rates to bring it back under control. Relatively high interest rates compared to its counterparts will usually benefit the Euro, as it makes the region more attractive as a place for global investors to park their money.
Data releases gauge the health of the economy and can impact on the Euro. Indicators such as GDP, Manufacturing and Services PMIs, employment, and consumer sentiment surveys can all influence the direction of the single currency. A strong economy is good for the Euro. Not only does it attract more foreign investment but it may encourage the ECB to put up interest rates, which will directly strengthen the Euro. Otherwise, if economic data is weak, the Euro is likely to fall. Economic data for the four largest economies in the euro area (Germany, France, Italy and Spain) are especially significant, as they account for 75% of the Eurozone’s economy.
Another significant data release for the Euro is the Trade Balance. This indicator measures the difference between what a country earns from its exports and what it spends on imports over a given period. If a country produces highly sought after exports then its currency will gain in value purely from the extra demand created from foreign buyers seeking to purchase these goods. Therefore, a positive net Trade Balance strengthens a currency and vice versa for a negative balance.
- GBP/USD drifts higher on Monday amidst a thin early-week economic calendar.
- UK GDP data due at the end of the week, strictly mid-tier releases on offer until then.
- Fed news cycle to dominate market attention as policymakers caution restraint.
GBP/USD ground out some bullish chart paper on Monday, climbing from a recent swing low into 1.2650 as markets kicked off the new trading week with risk appetite firmly on the front foot. Key economic data remains limited through most of the week, with Cable traders set to look ahead to high-impact calendar releases that won’t land until later. Gross Domestic Product (GDP) updates for the US and the UK are due in the back half of the trading week, with US Personal Consumption Expenditure (PCE) Price Index inflation numbers slated for Friday.
Fed's Daly: Inflation is not the only risk, but recent inflation readings are more encouraging
Fed's Goolsbee: Slowing inflation data would open door to easier policy
Tuesday's release schedule is strictly mid-tier, leaving markets to churn on statements from central bank policymakers. A smattering of Fedspeak comments sent minor jitters through Monday's markets, with more of the same expected on Tuesday.
Federal Reserve Bank of San Francisco President Mary Daly noted on Monday that 2024’s inflation prints have not inspired much confidence when viewed in the aggregate, though recent prints have shown promise. Fed policymaker Daly’s comments followed on the heels of earlier comments from Federal Reserve Bank of Chicago President Austan Goolsbee, who remains optimistic that further progress on inflation will be forthcoming, noting that the Fed’s policy stance remains appropriately restrictive.
GBP/USD technical outlook
The Cable’s Monday bull run drove the pair up six-tenths of one percent bottom-to-top from last Friday’s bottom bids at 1.2622. Hourly candles have tipped into technical resistance at the 200-hour Exponential Moving Average (EMA) at 1.2695, which could be a bump in the road for bullish momentum.
Daily candlesticks are churning in neutral territory just north of the 200-day EMA at 1.2603, and further downside could be on the cards as intraday bids get hung up on the 50-day EMA at 1.2673.
GBP/USD hourly chart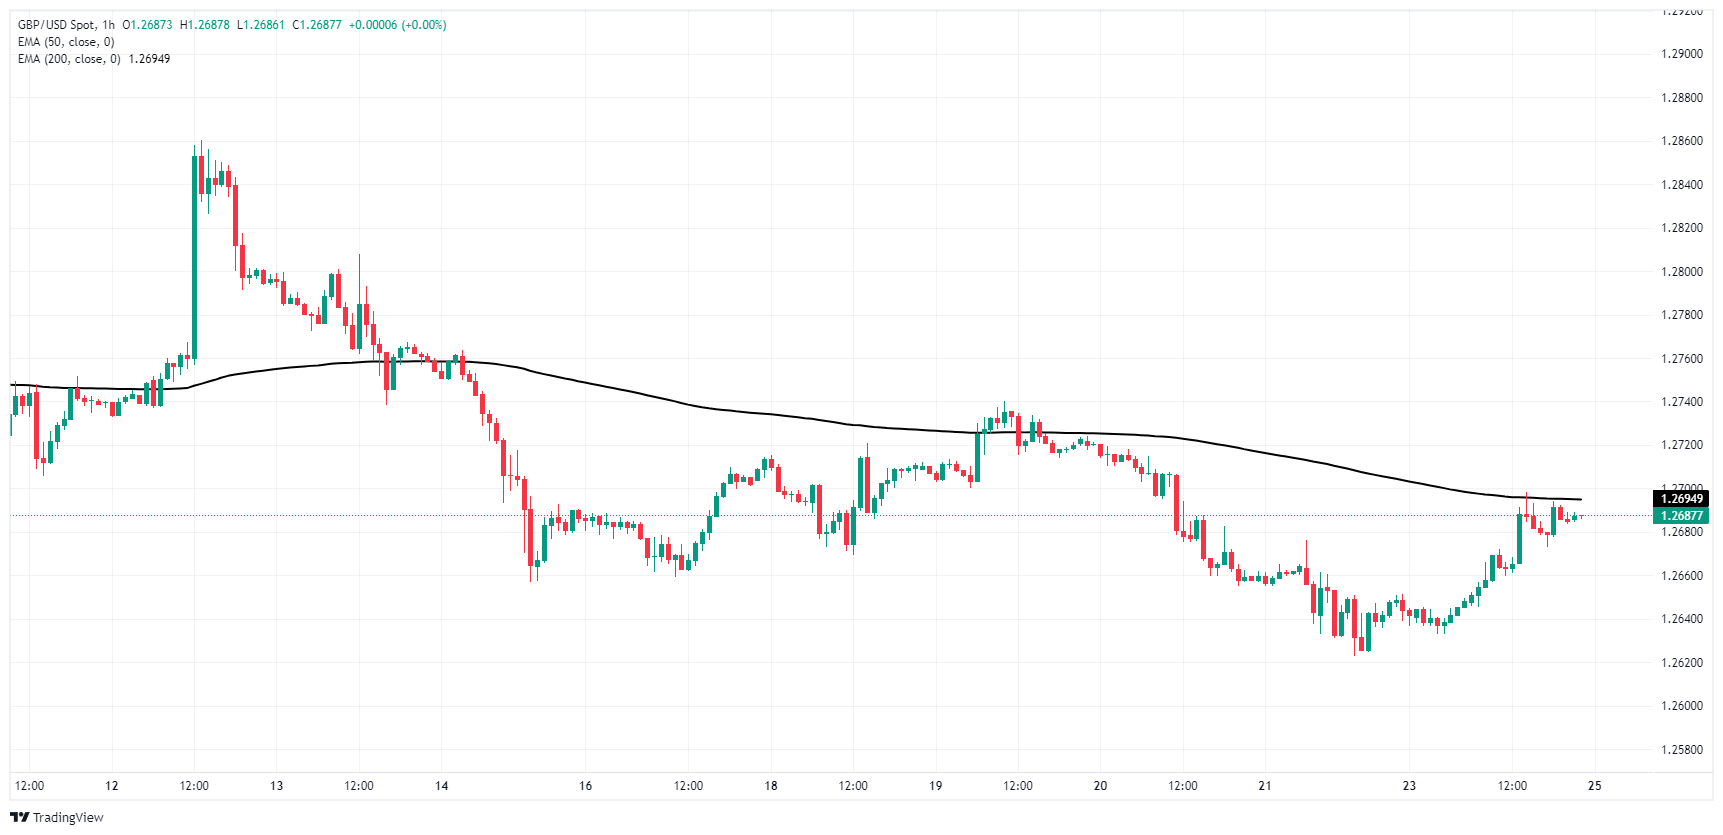
GBP/USD daily chart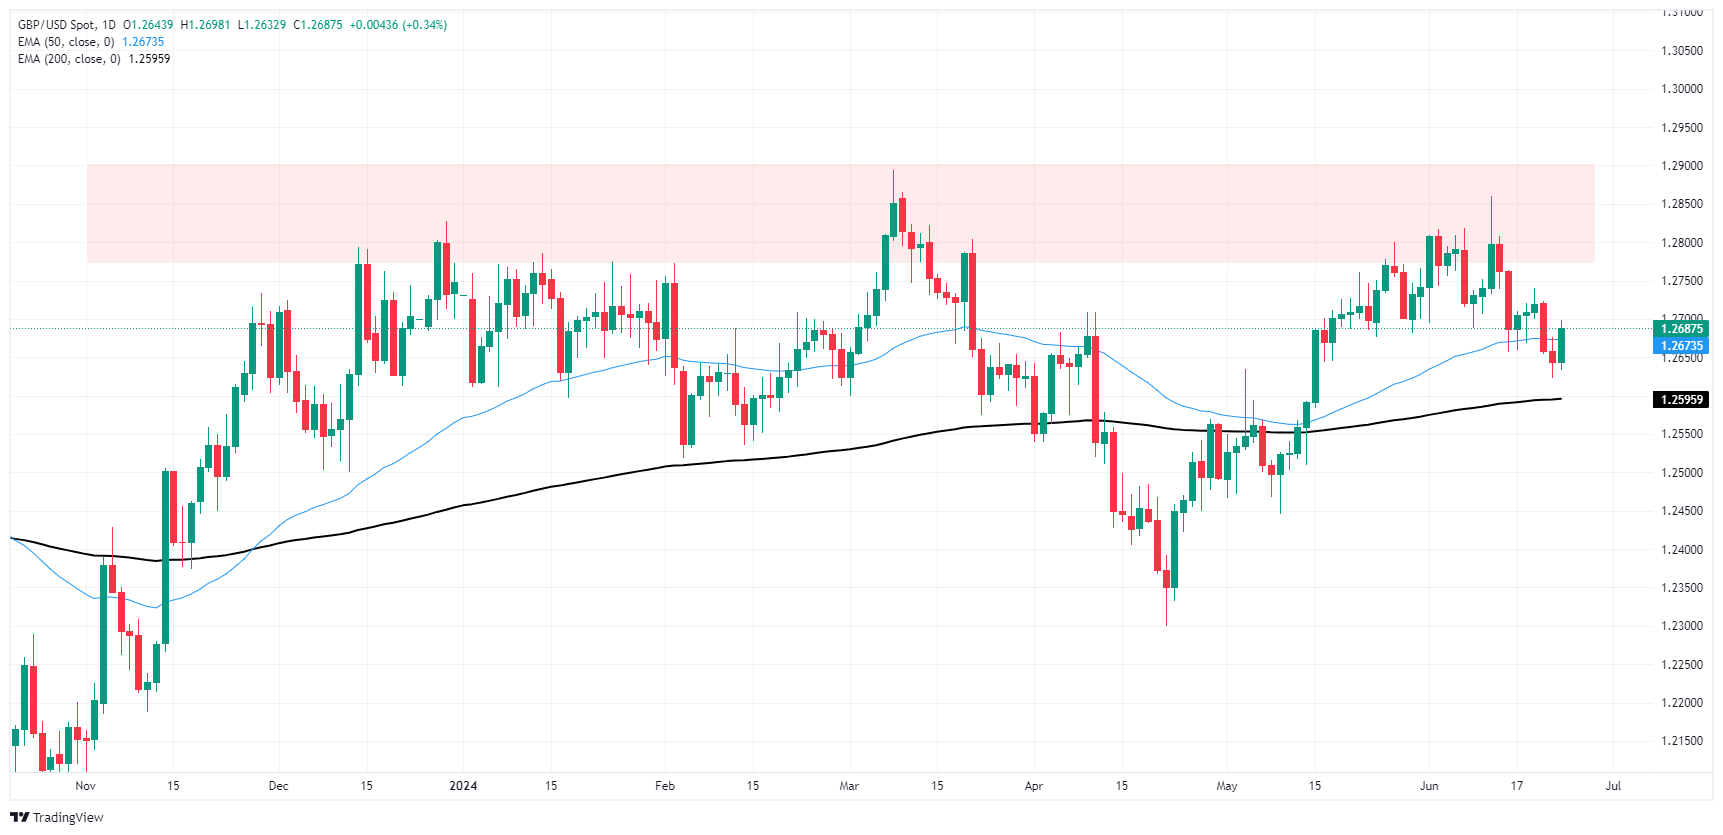
Pound Sterling FAQs
The Pound Sterling (GBP) is the oldest currency in the world (886 AD) and the official currency of the United Kingdom. It is the fourth most traded unit for foreign exchange (FX) in the world, accounting for 12% of all transactions, averaging $630 billion a day, according to 2022 data. Its key trading pairs are GBP/USD, aka ‘Cable’, which accounts for 11% of FX, GBP/JPY, or the ‘Dragon’ as it is known by traders (3%), and EUR/GBP (2%). The Pound Sterling is issued by the Bank of England (BoE).
The single most important factor influencing the value of the Pound Sterling is monetary policy decided by the Bank of England. The BoE bases its decisions on whether it has achieved its primary goal of “price stability” – a steady inflation rate of around 2%. Its primary tool for achieving this is the adjustment of interest rates. When inflation is too high, the BoE will try to rein it in by raising interest rates, making it more expensive for people and businesses to access credit. This is generally positive for GBP, as higher interest rates make the UK a more attractive place for global investors to park their money. When inflation falls too low it is a sign economic growth is slowing. In this scenario, the BoE will consider lowering interest rates to cheapen credit so businesses will borrow more to invest in growth-generating projects.
Data releases gauge the health of the economy and can impact the value of the Pound Sterling. Indicators such as GDP, Manufacturing and Services PMIs, and employment can all influence the direction of the GBP. A strong economy is good for Sterling. Not only does it attract more foreign investment but it may encourage the BoE to put up interest rates, which will directly strengthen GBP. Otherwise, if economic data is weak, the Pound Sterling is likely to fall.
Another significant data release for the Pound Sterling is the Trade Balance. This indicator measures the difference between what a country earns from its exports and what it spends on imports over a given period. If a country produces highly sought-after exports, its currency will benefit purely from the extra demand created from foreign buyers seeking to purchase these goods. Therefore, a positive net Trade Balance strengthens a currency and vice versa for a negative balance.
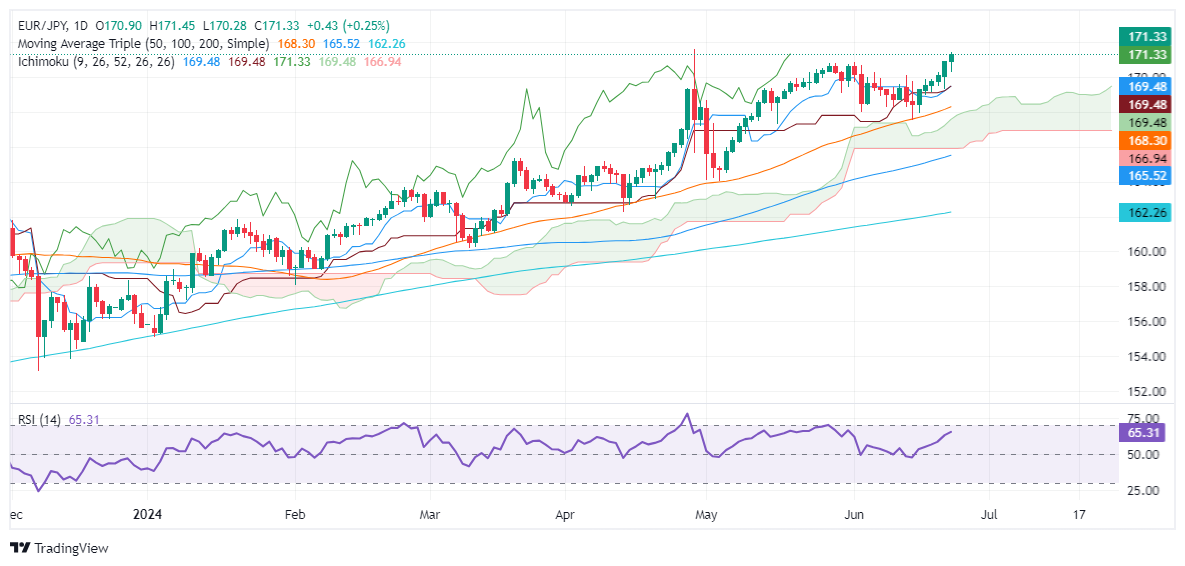
- EUR/JPY extends its gains for the sixth consecutive day and nearing the YTD high of 171.58.
- Technical outlook shows bullish momentum, with RSI indicating potential for further gains.
- Key resistance levels are YTD high at 171.58, 172.00, 172.50, and 173.00.
- Key support levels would be 171.00, the confluence of Tenkan, Kijun-Sen, and Senkou Span A at 169.48, and 50-DMA.
The EUR/JPY extended its gains for the sixth straight day on Monday and is up 0.24%. Yet it remains shy of testing the year-to-date (YTD) high reached on April 29 at 171.58. At the time of writing, the cross is trading at 171.29, above the 171.00 key technical level.
EUR/JPY Price Analysis: Technical outlook
The pair is set to extend its gains. Still, intervention fears that the Bank of Japan or the Minister of Finance might step into the FX markets loom, keeping investors on their toes.
Momentum suggests that the cross could extend its gains, as the Relative Strength Index (RSI) is bullish.
Therefore, the EUR/JPY first resistance would be the YTD high at 171.58. A breach of the latter will expose the 172.00 figure, followed by the 172.50 mark. Once those two levels are cleated, up next will be the 173.00 psychological level.
On further weakness, the EUR/JPY might be headed for a pullback, and test 171.00. Once cleared, the next support would be the confluence of the Tenkan, Kijun-Sen and Senkou Span A at 169.48. Once surpassed, the next stop would be the 50-day moving average (DMA) at 168.40.
EUR/JPY Price Action – Daily Chart
- Buyers successfully clear previous losses, stabilizing the cross at 97.80
- The 20-day SMA at 96.60 remains an important support, defending against sellers' attempts.
- Approaching overbought conditions suggests a potential correction, although the overall outlook remains positive.
On Monday, the NZD/JPY pair recorded a low of 97.28 before buyers stepped in and cleared all losses, stabilizing the cross at around 97.80. The potent performance fortified the bullish sentiment, with the pair glowing at highs not seen since July 2007, but in entered the Asian session on a neutral note. In the last sessions, the 20-day Simple Moving Average (SMA) at 96.60 has emerged as strong support, with sellers yet unable to breach this level, serving to further solidify the positive outlook.
The daily Relative Strength Index (RSI) currently reads 67, indicating higher momentum than Friday's reading and continues to suggest an upward trend. Meanwhile, the Moving Average Convergence Divergence (MACD) for Monday presents a fresh green bar, indicating increased buying pressure. However, investors are advised caution as the RSI nears the overbought threshold, hinting at the possibility of a near-term correction.
NZD/JPY daily chart
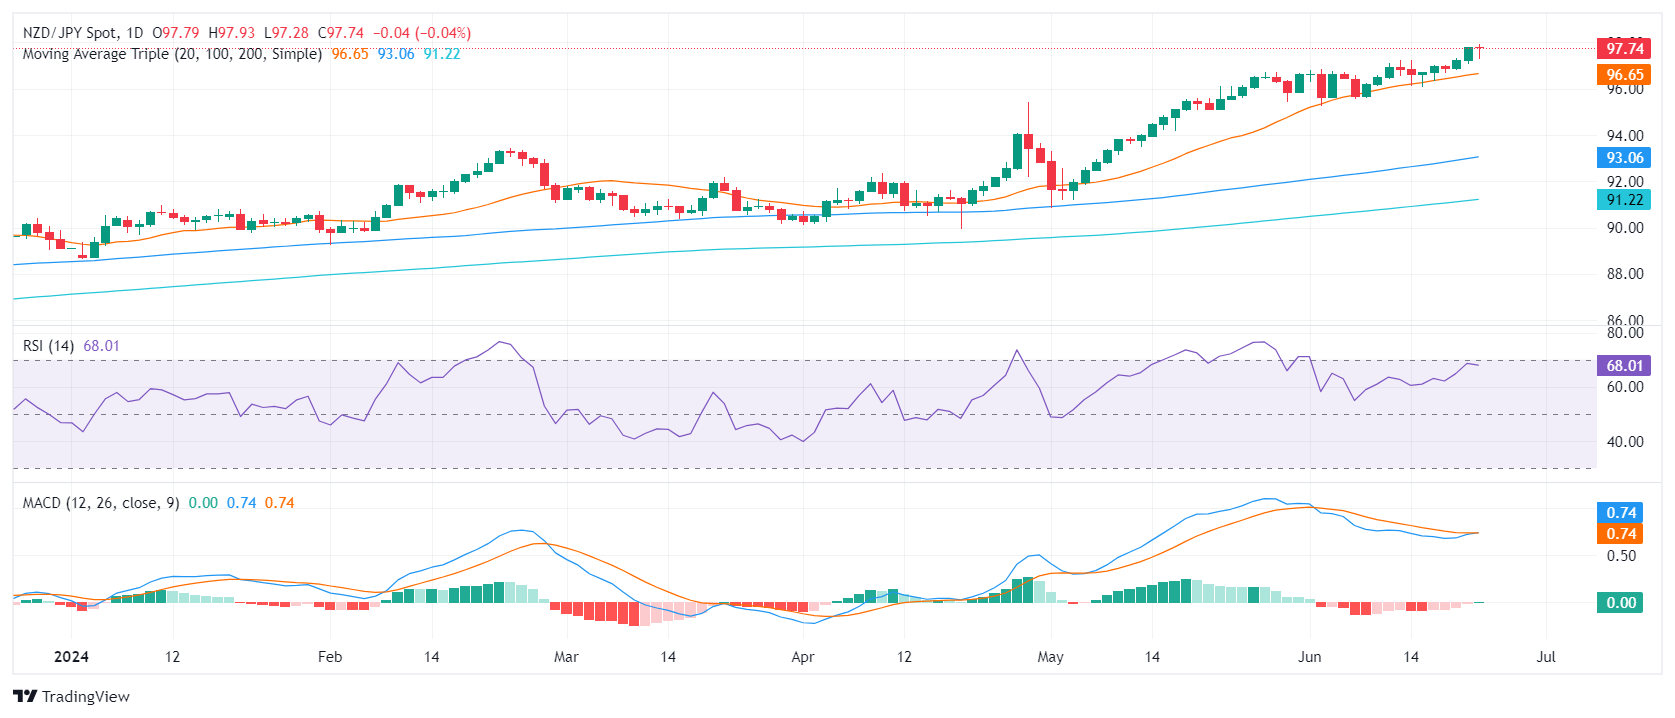
The bulls' resilience in maintaining positions above the 20-day SMA remains steadfast. This, combined with the approaching overbought daily technical indicators, further reinforces the positive technical outlook of the Kiwi against the Yen.
In subsequent trading sessions, the cross may fluctuate between the immediate support at 97.00 and the resistance target at 98.00. Investors should monitor these levels for a break above the consolidation range, indicating continued upward movement, or a breach below the 20-day SMA, which could signal a deeper correction. The 97.30 area also showed itself as a strong support.
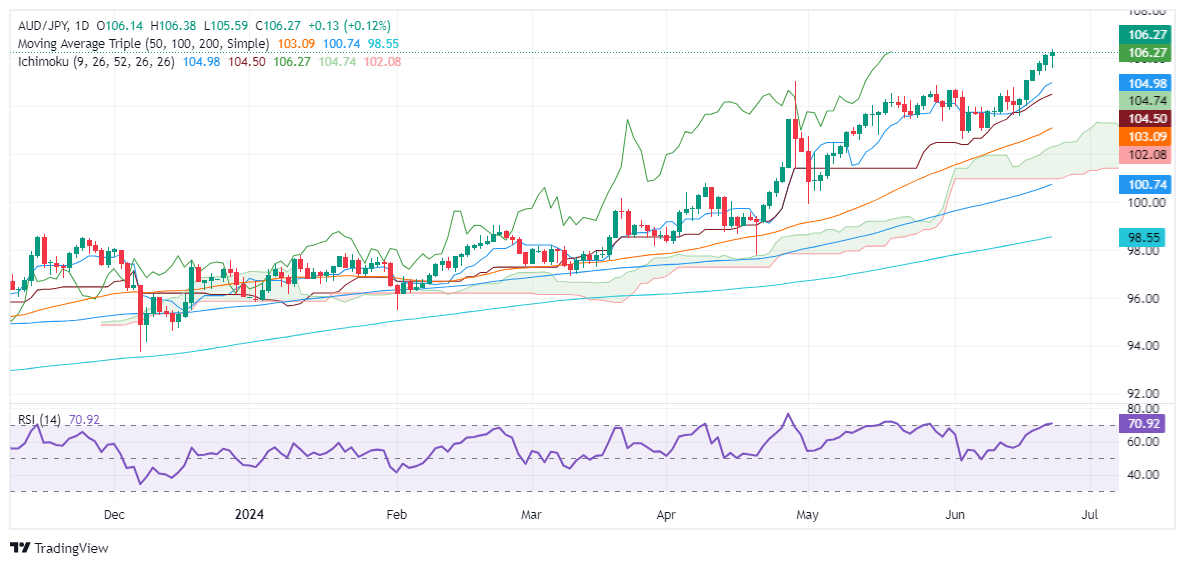
- AUD/JPY hits a 17-year peak at 106.37, following the BoJ's decision to maintain interest rates.
- Technicals indicate a strong uptrend with RSI in bullish territory; upcoming resistance at 106.50 and 107.00.
- Support levels include Tenkan-Sen at 104.98, Senkou Span A at 104.73, and Kijun-Sen at 104.49.
The Australian Dollar surged to a new 17-year high of 106.37 against the Japanese Yen as the Bank of Japan failed to increase interest rates on its latest monetary policy decision, which weighed on the Japanese currency. Therefore, the AUD/JPY rallied higher and traded at 106.22, up 0.16%.
AUD/JPY Price Analysis: Technical outlook
The AUD/JPY cross-pair uptrend remains intact, with the pair breaching the previous year-to-date (YTD) high of 104.94, which opened the door to test 105.00 and beyond. Even though momentum favors buyers with the Relative Strength Index (RSI) in bullish territory, downside risks remain due to verbal intervention by Japanese authorities.
If the JPY continued to depreciate steadily, that could pave the way for further gains. The next resistance would be the 106.50, ahead of 107.00. UP next would be the October 2007 peak at 107.86.
Conversely, if the cross-pair extends its losses past 106.00, the first support would be the Tenkan-Sen at 104.98, followed by the Senkou Span A at 104.73. Once cleared, the bull’s last line of defense would be the Kijun-Sen at 104.49.
AUD/JPY Price Action – Daily Chart
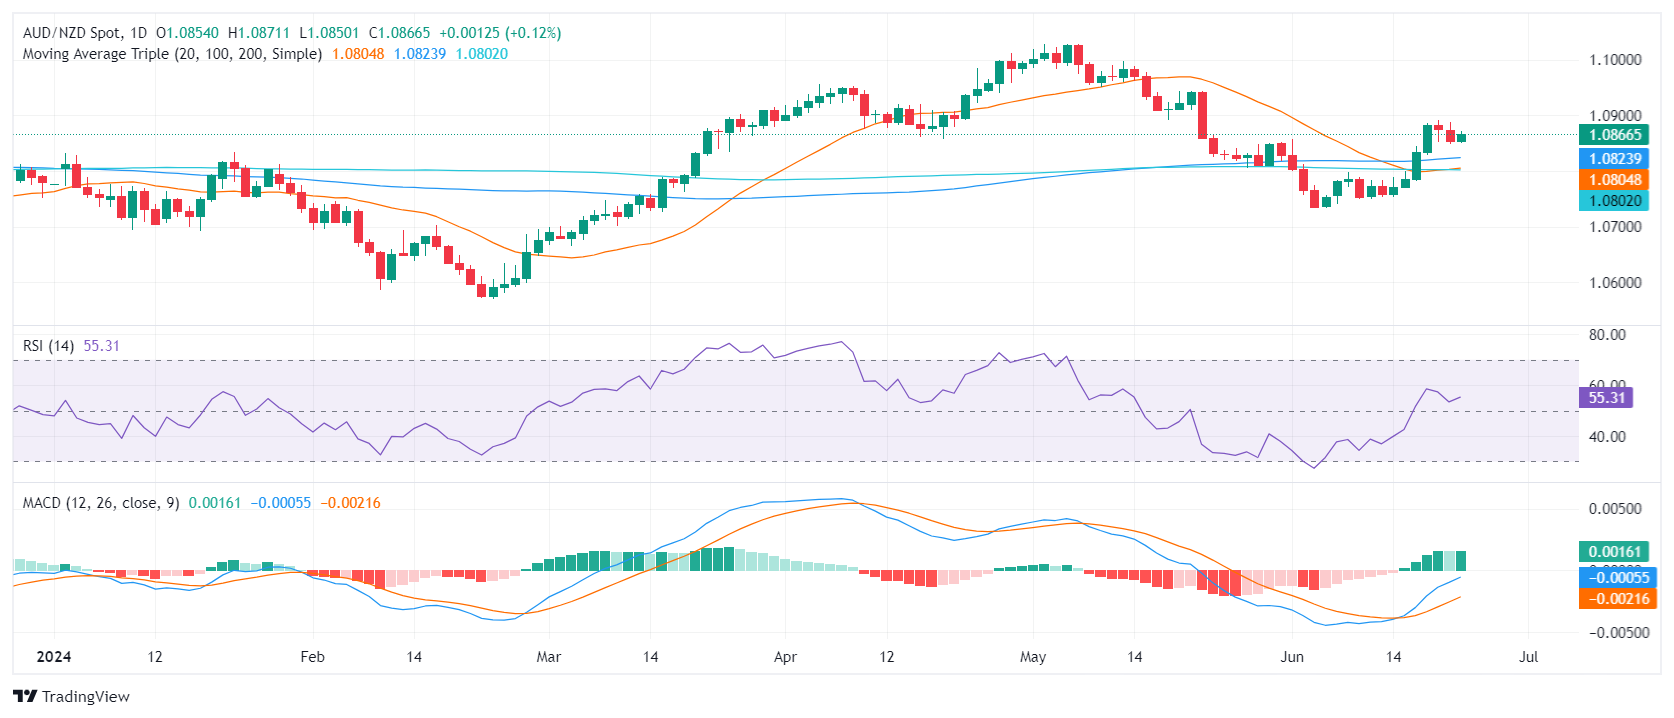
- On Monday, the AUD/NZD paused its selling trend, marking a two-day losing streak at the end of last week.
- New Zealand's June ANZ consumer and business surveys are eyed in this Wednesday's Asian session.
- Australia's AUD continues to be driven by anticipations of the upcoming CPI data, also due this Wednesday.
The AUD/NZD sellers took a Monday pause after the tally of a two-day losing streak at the end of last week. The Reserve Bank of Australia (RBA) and the Reserve Bank of New Zealand (RBNZ) moves are awaited by investors, who continue to place their bets.
In New Zealand, the June ANZ consumer and business surveys are in focus this Wednesday. The data for May showed a clear weakening in activity and easing inflation pressure, with the business confidence dropping to 11.20. Moreover, the consumer confidence index advanced to 84.90 in May but stayed at historically weak levels. Despite inflation receding slowly in the New Zealand services sector and some signs of fragility in the overall economy, the RBNZ is delaying its first rate cut for Q3 2025, contradicting the market which fully expects a cut this November.
For Australia, the spotlight turns to the May Consumer Price Index (CPI) data released this Wednesday. Headline inflation is expected to leap by two ticks to a five-month peak of 3.8% year on year. As for now, the swaps market gave up nearly all rate cut hopes in 2024 and approximates a 70% likelihood of the initial cut in February 2025. In the meantime, the RBA remains patient, maintaining that a considerable period will elapse before inflation sustainably sits within the 2-3% target range. It's worth noticing that Governor Bullock noted last week that the bank will do whatever is necessary to tackle inflation and this hawkish stance might cushion the Aussie.
AUD/NZD technical analysis
In the near term, the technical outlook for the AUD/NZD cross remains positive, recording a gain of nearly 0.80% in the previous fortnight. While the indicators may have flattened, the overall scenario suggests that the bearish spell might be taking a break.
However, the Simple Moving Averages (SMA) position remains like previously mentioned, capping the upward potential.
AUD/NZD daily chart
Here is what you need to know on Monday, June 24:
The US Dollar (USD) extended Monday declines through the US market session, easing back as investor confidence continues to pin higher at the outset of a fresh trading week. Key US data looms ahead later in the week with a revision to first-quarter US Gross Domestic Product (GDP) growth on Thursday, with updated Personal Consumption Expenditure (PCE) Price Index inflation slated for Friday.
Tuesday will drop the latest Canadian Consumer Price Index (CPI) inflation figures on CAD traders, forecast to cool slightly for the year through May, while Australia’s CPI for the year ended in May is expected to tick upwards slightly. Australia’s Monthly CPI inflation is slated to print early Wednesday.
This week, an otherwise moderate release schedule leaves investors to drift as key data loads into the barrel for Friday. Japan’s Tokyo CPI inflation preview will kick off Friday’s upcoming data splurge, followed by German Retail Sales, UK GDP, and US PCE inflation, rounding out the capstone on the week’s economic calendar.
US Dollar PRICE Today
The table below shows the percentage change of US Dollar (USD) against listed major currencies today. US Dollar was the strongest against the Japanese Yen.
| USD | EUR | GBP | JPY | CAD | AUD | NZD | CHF | |
|---|---|---|---|---|---|---|---|---|
| USD | -0.41% | -0.35% | -0.10% | -0.27% | -0.26% | -0.15% | -0.10% | |
| EUR | 0.41% | 0.08% | 0.38% | 0.19% | 0.16% | 0.31% | 0.38% | |
| GBP | 0.35% | -0.08% | 0.24% | 0.11% | 0.08% | 0.23% | 0.30% | |
| JPY | 0.10% | -0.38% | -0.24% | -0.17% | -0.13% | 0.00% | -0.01% | |
| CAD | 0.27% | -0.19% | -0.11% | 0.17% | 0.01% | 0.12% | 0.19% | |
| AUD | 0.26% | -0.16% | -0.08% | 0.13% | -0.01% | 0.14% | 0.21% | |
| NZD | 0.15% | -0.31% | -0.23% | -0.00% | -0.12% | -0.14% | 0.07% | |
| CHF | 0.10% | -0.38% | -0.30% | 0.00% | -0.19% | -0.21% | -0.07% |
The heat map shows percentage changes of major currencies against each other. The base currency is picked from the left column, while the quote currency is picked from the top row. For example, if you pick the US Dollar from the left column and move along the horizontal line to the Japanese Yen, the percentage change displayed in the box will represent USD (base)/JPY (quote).
EUR/USD held steady in the US market session on Monday, drifting around technical levels near 1.0740 as a broad-market Greenback selloff helped Euro traders to fend off a broad miss in German sentiment surveys that dropped earlier in the day.
GBP/USD likewise stuck to its guns near 1.2690 as bullish Cable bets remained pinned on the high side, but couldn’t stretch to make a break above the 1.2700 handle. The UK is broadly absent from the economic calendar this week, with mostly mid- to low-tier data on the offering as GBP traders wait for Friday’s UK GDP print for the first quarter.
Fed FAQs
Monetary policy in the US is shaped by the Federal Reserve (Fed). The Fed has two mandates: to achieve price stability and foster full employment. Its primary tool to achieve these goals is by adjusting interest rates. When prices are rising too quickly and inflation is above the Fed’s 2% target, it raises interest rates, increasing borrowing costs throughout the economy. This results in a stronger US Dollar (USD) as it makes the US a more attractive place for international investors to park their money. When inflation falls below 2% or the Unemployment Rate is too high, the Fed may lower interest rates to encourage borrowing, which weighs on the Greenback.
The Federal Reserve (Fed) holds eight policy meetings a year, where the Federal Open Market Committee (FOMC) assesses economic conditions and makes monetary policy decisions. The FOMC is attended by twelve Fed officials – the seven members of the Board of Governors, the president of the Federal Reserve Bank of New York, and four of the remaining eleven regional Reserve Bank presidents, who serve one-year terms on a rotating basis.
In extreme situations, the Federal Reserve may resort to a policy named Quantitative Easing (QE). QE is the process by which the Fed substantially increases the flow of credit in a stuck financial system. It is a non-standard policy measure used during crises or when inflation is extremely low. It was the Fed’s weapon of choice during the Great Financial Crisis in 2008. It involves the Fed printing more Dollars and using them to buy high grade bonds from financial institutions. QE usually weakens the US Dollar.
Quantitative tightening (QT) is the reverse process of QE, whereby the Federal Reserve stops buying bonds from financial institutions and does not reinvest the principal from the bonds it holds maturing, to purchase new bonds. It is usually positive for the value of the US Dollar.
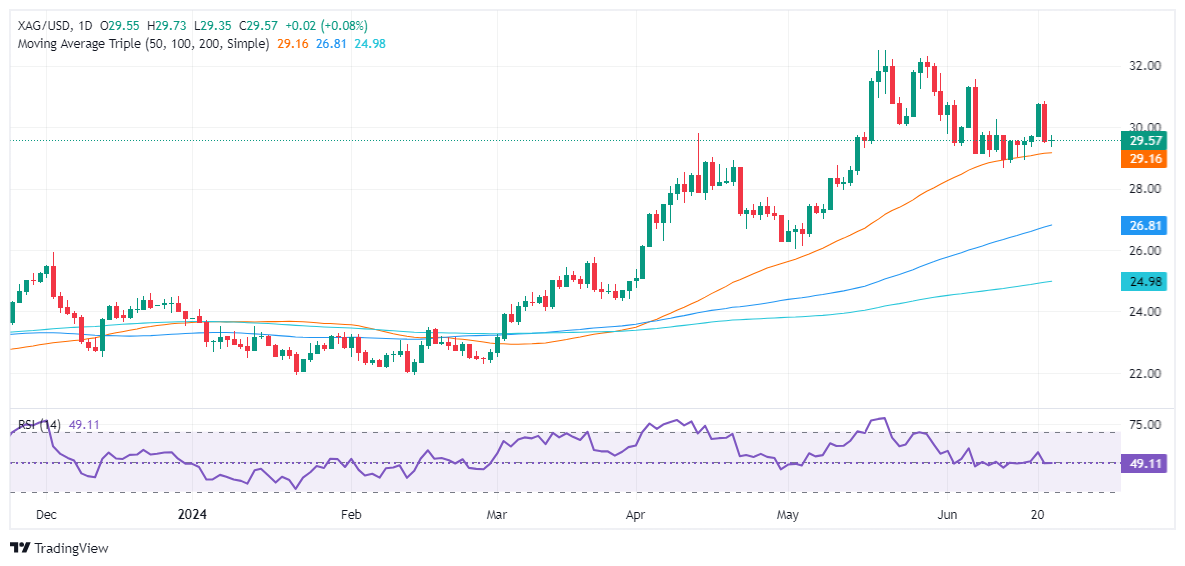
- Silver trades slightly up by 0.16% due to the soft US Dollar.
- Technical outlook shows a bearish engulfing pattern from last week, with RSI indicating bearish momentum.
- Key support levels: 50-DMA at $29.14, $29.00, MTD low at $28.66, and 100-DMA at $26.82.
- Key resistance levels: June 7 high at $31.54, $32.00, and YTD high at $32.51.
Silver prices remain flat on Monday amid firm US Treasury yields and a weaker US Dollar. The XAG/USD trades at $29.58, up a minimal 0.16%.
XAG/USD Price Analysis: Technical outlook
Last week, the grey metal formed a ‘bearish engulfing’ chart pattern, which opened the door for further downside. Momentum shifted in the seller's favor as the Relative Strength Index (RSI) turned bearish, opening the door for further losses.
Given the backdrop, the XAG/USD's first support would be the 50-day moving average (DMA) at $29.14; it will expose $29.00. Breaching this level could lead to the MTD low of $28.66, ahead of a potential drop towards the 100-DMA at $26.82.
On the flip side, if XAG/USD resumes its uptrend, the next resistance level is the June 7 high of $31.54. Clearing this level would target $32.00 before challenging the year-to-date (YTD) high of $32.51.
XAG/USD Price Action – Daily Chart
- WTI rebounded after a near-term dip towards $80.00.
- Energy markets are churning as investors look for firmer signs of supply drawdown.
- Ongoing geopolitical turmoil keeps supply concerns front and center, bolstering prices.
West Texas Intermediate (WTI) US Crude Oil found a firm bid on Monday, rebounding to the $81.50 region after easing within reach of the $80.00 handle. Energy markets remain choppy as investors hope for a broad-market push higher on the possibility of rising demand in the future while trying to shrug off current supplies, which see an increasing overhang on current demand.
Leadership in Israel shrugged off the latest version of a proposed ceasefire between Israeli forces and Palestinian Hamas, keeping Crude Oil markets underpinned as investors continue to bake in the possibility of the ongoing Gaza conflict spilling over into neighboring countries.
Energy investors will be looking ahead to this week’s US Crude Oil stocks updates from the American Petroleum Institute (API) and the Energy Information Administration. Week-on-week counts went in different directions last week, with the API noting a drawdown while the EIA found a slight uptick in supply counts. Crude Oil speculators will be looking for a steeper draw on US Crude Oil supplies as economies head into the summer months, with barrel traders specifically looking for increased fuel demand for cooling and summer travel.
Economic Indicator
API Weekly Crude Oil Stock
API’s Weekly Statistical Bulletin (WSB) has reported total U.S. and regional data relating to refinery operations and the production of the four major petroleum products: motor gasoline, kerosene jet fuel, distillate (by sulfur content), and residual fuel oil. These products represent more than 85% of total petroleum industry.
Read more.Next release: Tue Jun 25, 2024 20:30
Frequency: Weekly
Consensus: -
Previous: 2.264M
Source: American Petroleum Institute
Economic Indicator
EIA Crude Oil Stocks Change
The EIA Crude Oil stockpiles report is a weekly measure of the change in the number of barrels in stock of crude oil and its derivates, and it's released by the Energy Information Administration. This report tends to generate large price volatility, as oil prices impact on worldwide economies, affecting the most, commodity related currencies such as the Canadian dollar. Despite it has a limited impact among currencies, this report tends to affect the price of oil itself, and, therefore, had a more notorious impact on WTI crude futures.
Read more.Next release: Wed Jun 26, 2024 14:30
Frequency: Weekly
Consensus: -
Previous: -2.547M
WTI technical outlook
Bullish intraday momentum has left US Crude Oil stranded in a growing supply zone above the $81.00 handle, with prices growing sluggish at $81.50 and could be poised for an exhaustion pullback to familiar levels. Daily candles are pinned into near-term bull country above the 200-day Exponential Moving Average (EMA) at $78.38, but a rapid rise from the last swing low into $72.45 could leave bullish momentum without a firm technical leg to stand on, and odds are leaning into a return to long-term median prices.
WTI hourly chart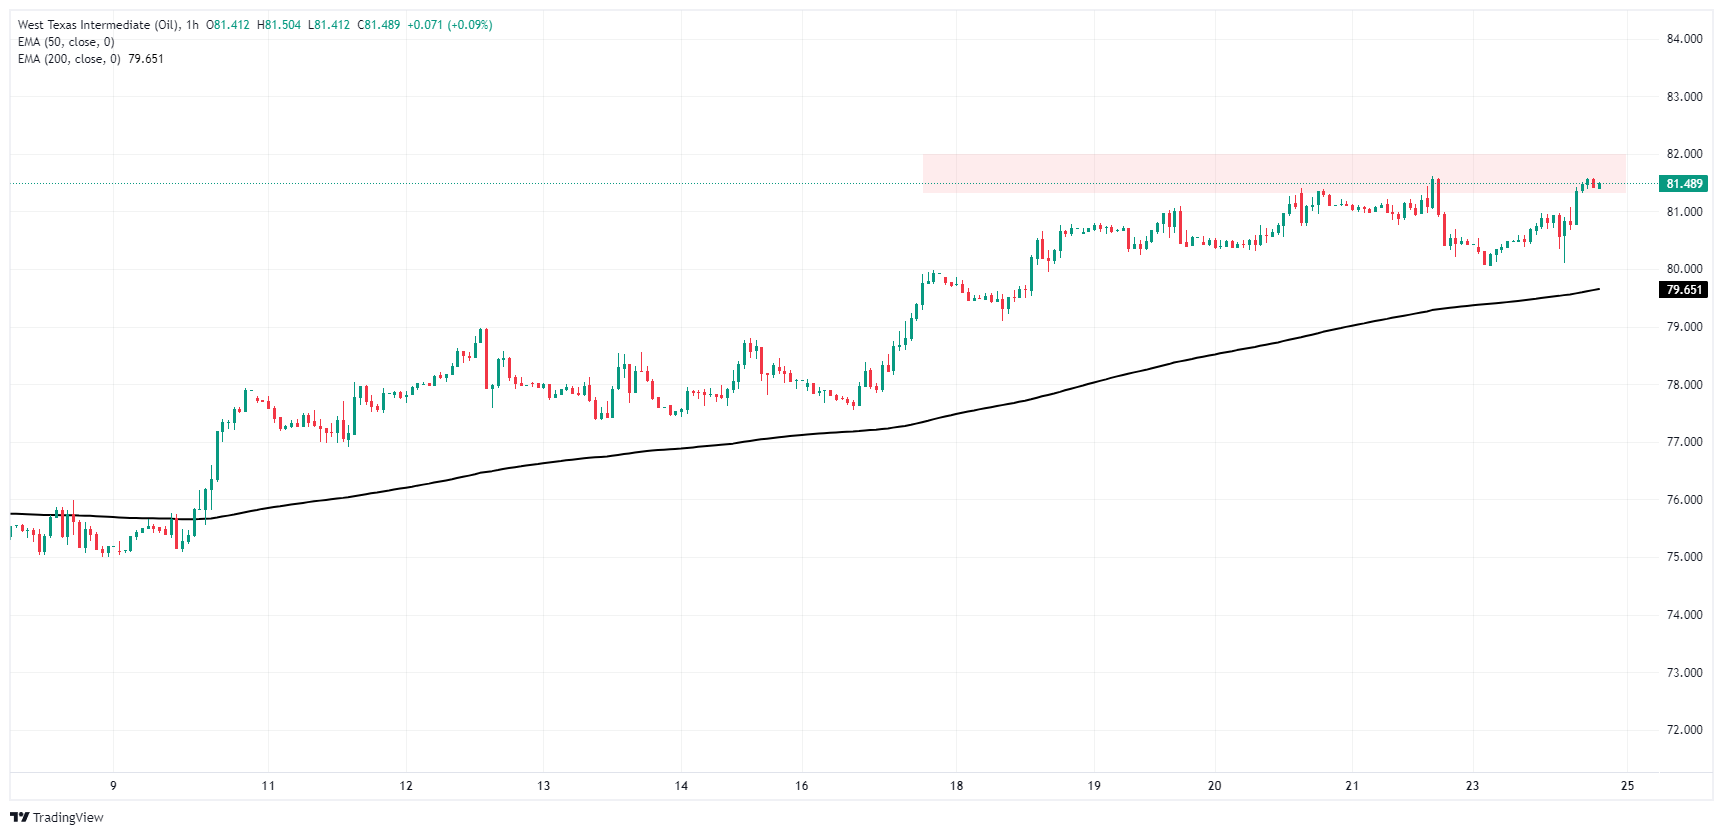
WTI daily chart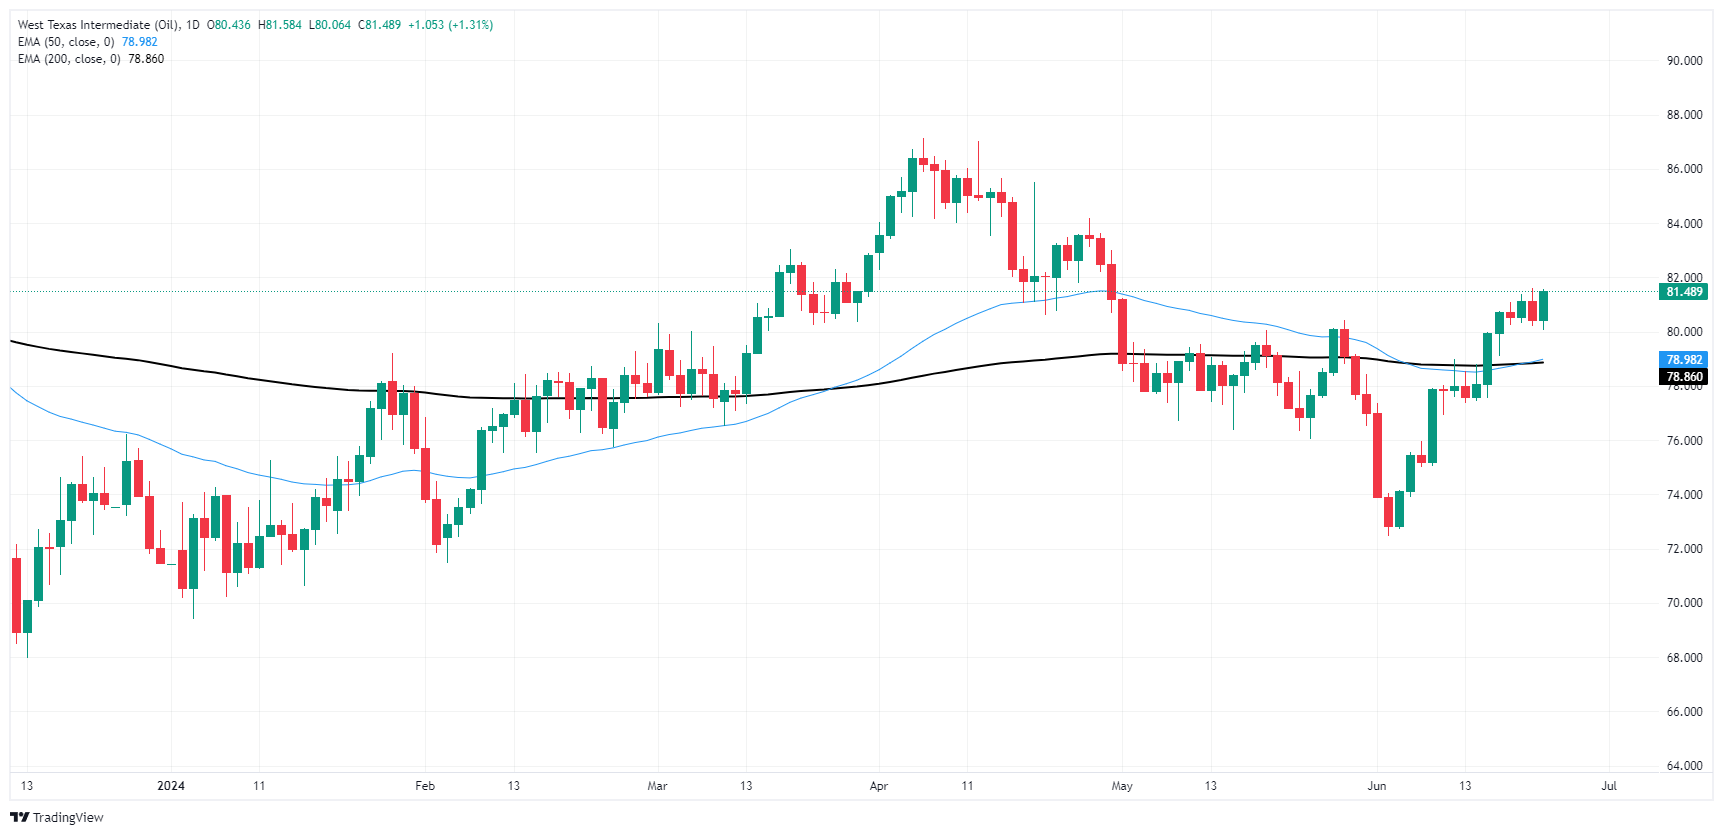
WTI Oil FAQs
WTI Oil is a type of Crude Oil sold on international markets. The WTI stands for West Texas Intermediate, one of three major types including Brent and Dubai Crude. WTI is also referred to as “light” and “sweet” because of its relatively low gravity and sulfur content respectively. It is considered a high quality Oil that is easily refined. It is sourced in the United States and distributed via the Cushing hub, which is considered “The Pipeline Crossroads of the World”. It is a benchmark for the Oil market and WTI price is frequently quoted in the media.
Like all assets, supply and demand are the key drivers of WTI Oil price. As such, global growth can be a driver of increased demand and vice versa for weak global growth. Political instability, wars, and sanctions can disrupt supply and impact prices. The decisions of OPEC, a group of major Oil-producing countries, is another key driver of price. The value of the US Dollar influences the price of WTI Crude Oil, since Oil is predominantly traded in US Dollars, thus a weaker US Dollar can make Oil more affordable and vice versa.
The weekly Oil inventory reports published by the American Petroleum Institute (API) and the Energy Information Agency (EIA) impact the price of WTI Oil. Changes in inventories reflect fluctuating supply and demand. If the data shows a drop in inventories it can indicate increased demand, pushing up Oil price. Higher inventories can reflect increased supply, pushing down prices. API’s report is published every Tuesday and EIA’s the day after. Their results are usually similar, falling within 1% of each other 75% of the time. The EIA data is considered more reliable, since it is a government agency.
OPEC (Organization of the Petroleum Exporting Countries) is a group of 13 Oil-producing nations who collectively decide production quotas for member countries at twice-yearly meetings. Their decisions often impact WTI Oil prices. When OPEC decides to lower quotas, it can tighten supply, pushing up Oil prices. When OPEC increases production, it has the opposite effect. OPEC+ refers to an expanded group that includes ten extra non-OPEC members, the most notable of which is Russia.