- Analiza
- Novosti i instrumenti
- Vesti sa tržišta
Forex-novosti i prognoze od 23-02-2024
- EUR/JPY finishes week with a 0.66% gain, reflecting persistent JPY softness against a backdrop of economic data.
- Technical analysis shows YTD high at 163.21, with support and resistance levels indicating potential upward momentum.
- Key technical levels outlined for potential reversals or further advances in the EUR/JPY pair's trajectory.
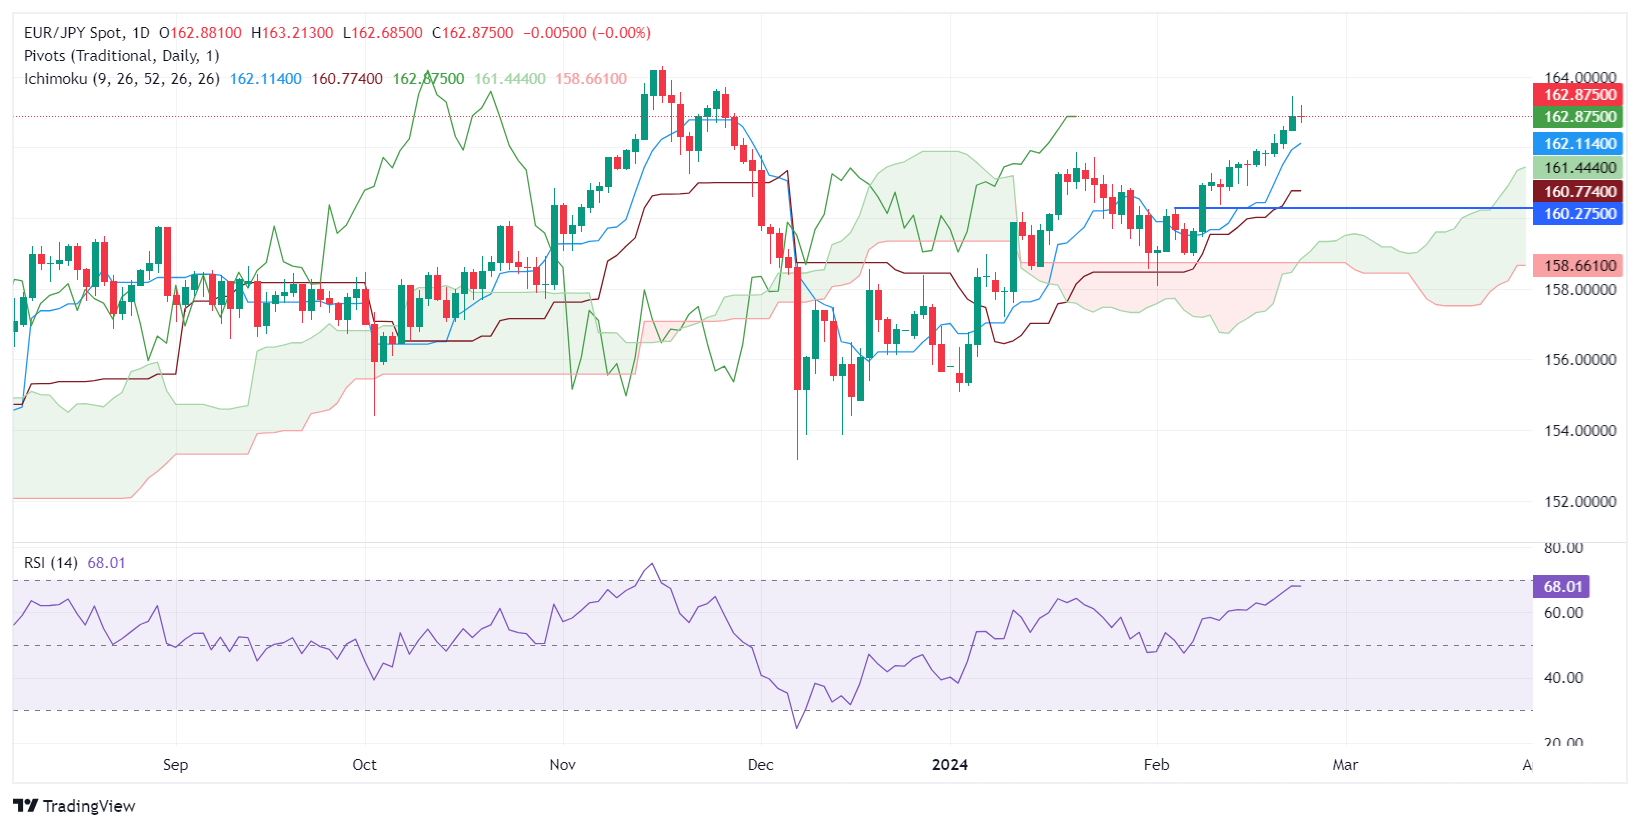
The EUR/JPY wraps up Friday session with losses of 0.02% but is set to finish the week with 0.66% gains, courtesy of overall Japanese Yen (JPY) weakness, as economic data doesn’t justify the Bank of Japan (BoJ) finishing negative interest rates. At the time of writing, the cross exchanges hands at 162.86, virtually unchanged.
From a technical standpoint, the pair printed a new year-to-date (YTD) high at 163.21 but failed to cling to gains above the 163.00 figure. That opened the door for a pullback, capped at around the day’s low of 162.64, which keeps buyers hopeful of higher prices. Achieving a daily close above 163.00 would open the door to testing the November 27 high at 163.72, ahead of the 164.00 mark.
Conversely, if sellers step in, they would clash with the Tenkan-Sen, first support at 162.11. the next support will emerge at January’s 19 high turned support at 161.87, followed by the Senkou Span A at 161.44.
EUR/JPY Price Action – Daily Chart
- USD/JPY dips but retains gains for the week with a slight 0.17% increase, hinting at a bullish undertone.
- Technical outlook suggests neutrality with an upward bias, positioned above the Ichimoku Cloud.
- Resistance and support levels outlined for potential bullish continuation or pullback scenarios.
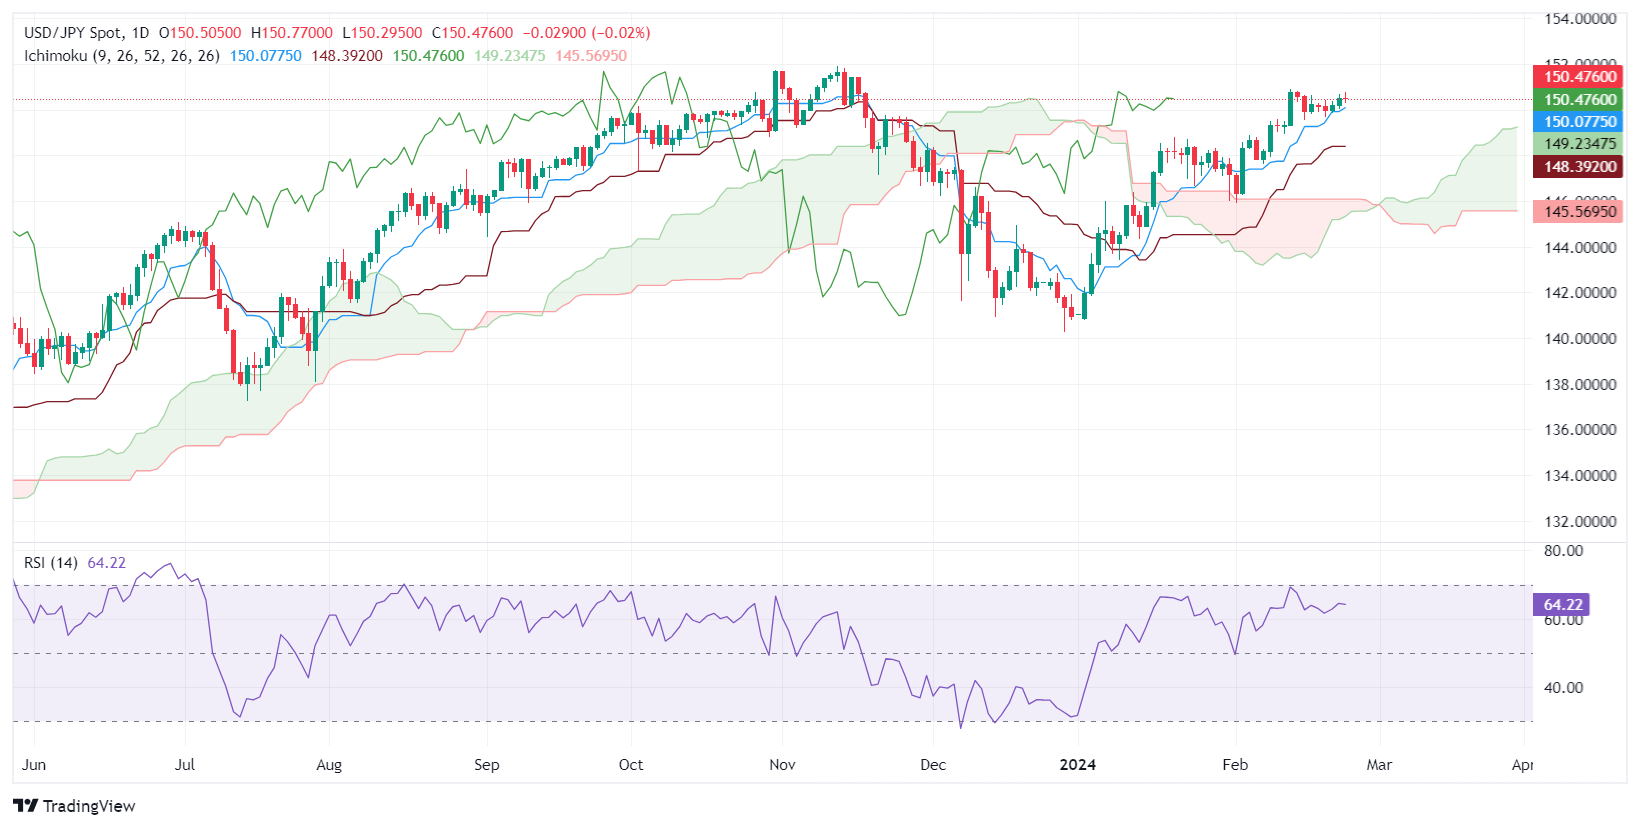
The USD/JPY retreats, after hitting weekly highs of 150.77, aim back below the 150.50 figure late in the North American session. The major exchanges hands at 150.44, down 0.05%, but set to finish the week with gains of 0.17%.
From a technical perspective, the pair is neutral to upward biased, remaining well positioned above the Ichimoku Cloud (Kumo). Price action suggests that buyers need to push the USD/JPY above the February 13 high at 150.88 to remain hopeful for a bullish continuation. The next resistance would be 151.00, followed by last year’s high at 151.91. Relative Strength Index (RSI) studies remain bullish, indicating that buyers might have the upper hand.
Conversely, if sellers drag the USD/JPY below 150.00, that will pave the way for a pullback. The next demand area will be the Tenkan-Sen at 150.05, followed by the Senkou Span A at 149.22. A further downside is seen at the Kijun Sen at 148.39.
USD/JPY Price Action – Daily Chart
- WTI has returned to territory below $77.00 five times in eight days.
- Crude Oil markets are getting pushed back into the low side of rough congestion.
- Analysts expect OPEC to extend Q1 cuts through Q2.
West Texas Intermediate (WTI) dipped back below $77.00 on Friday as energies pull back from recent bullish momentum which failed to crack into meaning high territory. WTI is set to wrap up the trading week near $76.50, a region that US Crude Oil has been struggling to break from since rising into the zone on February 9.
According to a survey by Bloomberg, analysts that watch the Organization of the Petroleum Exporting Countries (OPEC) expect the Crude Oil cartel to extend steep production cuts from the first quarter through Q2 2024. OPEC introduced drastic Crude Oil production caps across its member states late 2023, but attempts to constrain global Crude Oil supply in order to support barrel prices continues to run into significant headwinds as energy markets have their hands full watching global non-OPEC production and keeping an eye out for ongoing geopolitical headlines.
Crude Oil markets remain concerned about possible supply shocks as the Israel-Palestinian Hamas conflict in Gaza rolls on, and Yemini Houthis backed by Iran continue to target civilian cargo ships in the Red Sea despite the presence of a coalition naval fleet between the US and the UK.
As it currently stands, OPEC has not announced their Q2 plans, nor have they set a date to begin discussing the group’s production levels heading into the tail end of the first quarter.
WTI technical outlook
WTI fell back below the 200-hour Simple Moving Average (SMA) at $77.47 for the third time in a week as bullish momentum continues to evaporate. US Crude Oil is building out a rough consolidation pattern in the near-term, with a technical resistance zone marked in just below $79.00.
Daily candlesticks are seeing stiff technical resistance from the 200-day SMA at $77.60, and a bullish recovery from the last major swing low into $67.97 in December has struggled to gain meaningful chart territory.
WTI hourly chart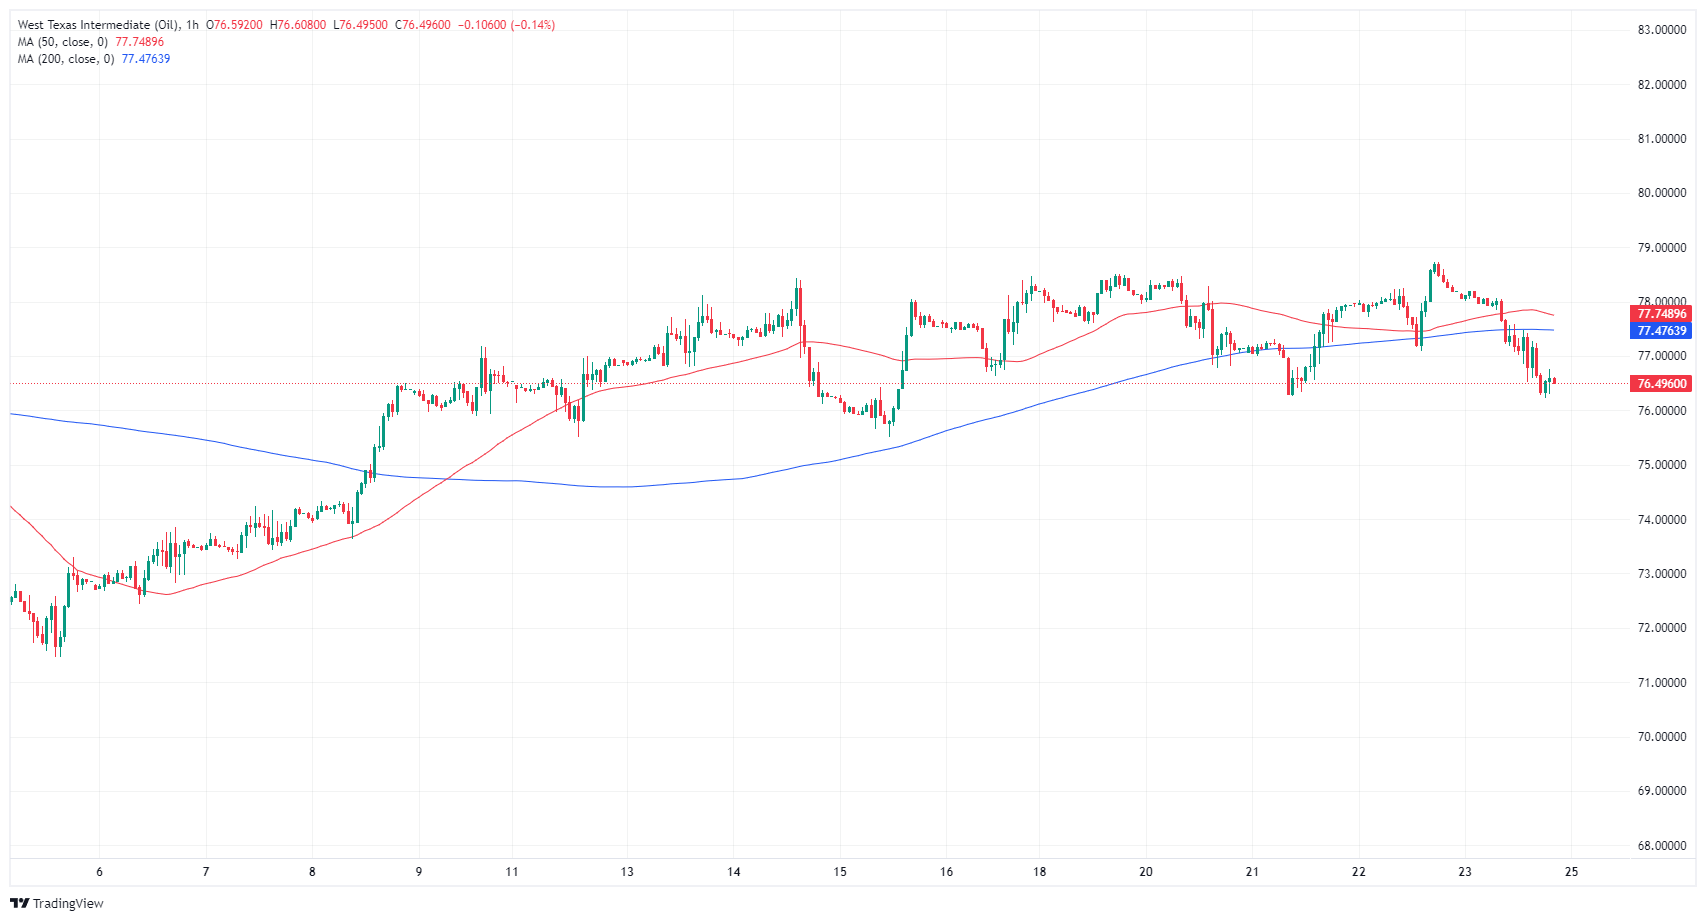
WTI daily chart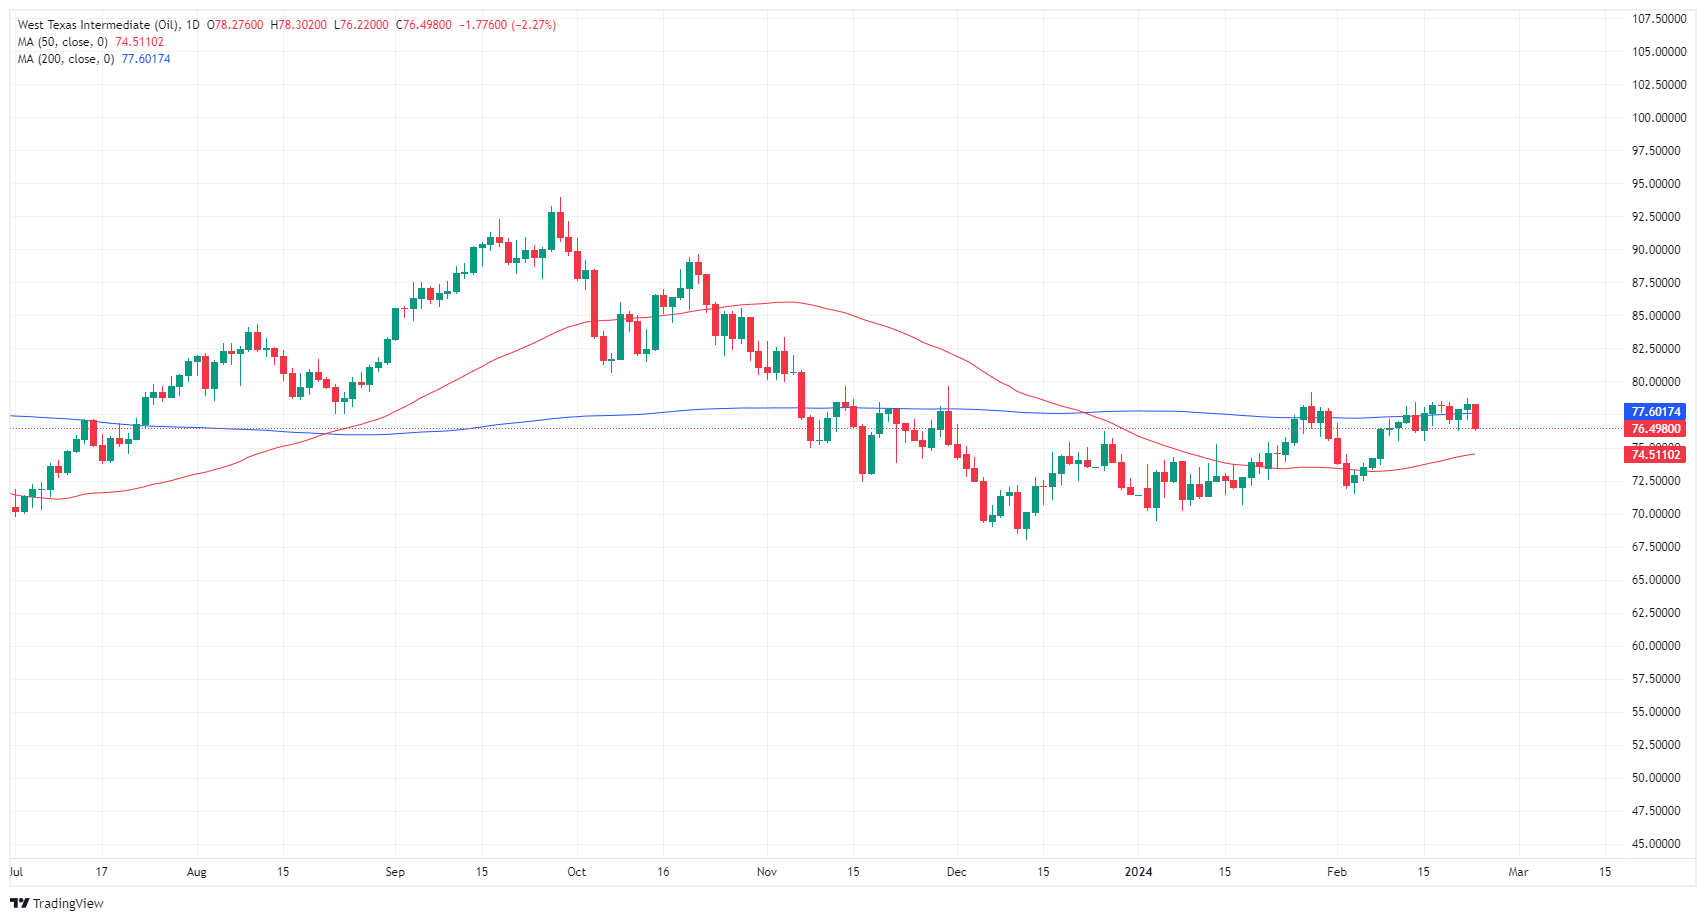
- The USD/NOK is presently trading higher at 10.53, marking a 0.32% increase during Friday's session.
- The US Dollar stands firm as Fed officials show caution due to robust US economic indicators.
- Investors assess the likelihood of a Fed rate cut in March and May as low due to potential adverse implications on price stability.
- The USD is anticipated to see gains as the market adjusts its easing expectations and pushes the first rate cut from the Fed to June.
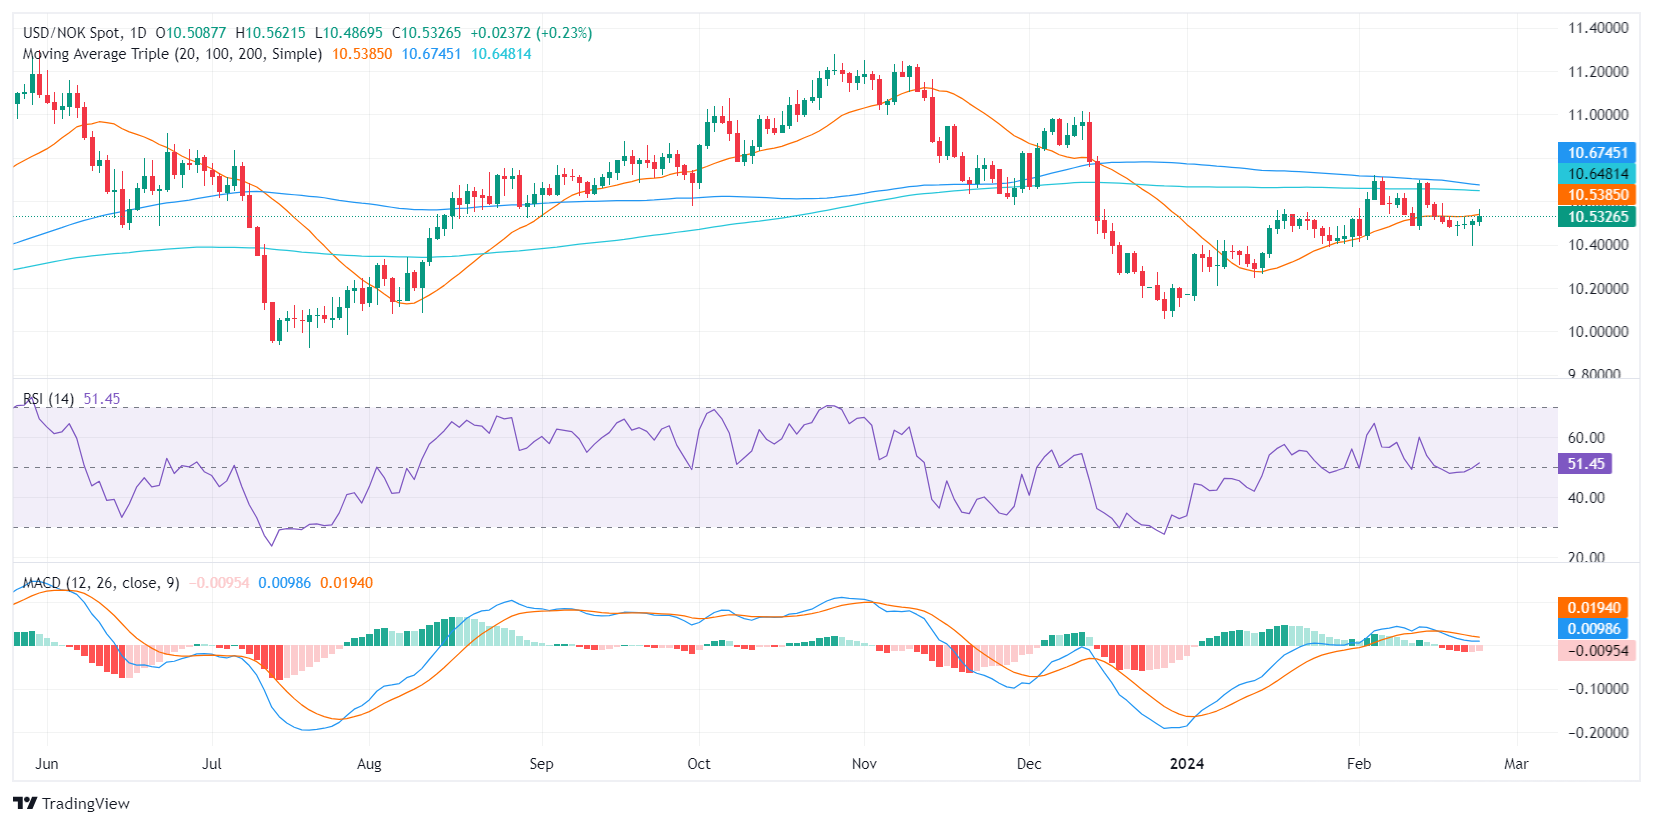
In Friday's trading session, the USD/NOK pair is trading at a level of 10.53, registering a modest gain of 0.32%. The US Dollar (USD) is showing a stable performance in light of Federal Reserve (Fed) officials adopting a cautious stance in light of a strong US economy. As a reaction, the probability of a rate cut in March and May by the Fed appears to be low according to the market’s expectations.
On the other hand, the short term of the NOK will be dictated on whether the Norges Bank will follow the Fed’s stance to delay cuts which will be guided by local data. In addition, the Norwegian currency gained momentum in 2024, due to rising Oil prices, as it is an important global producer, so in case, the black gold advances further the pair’s upside may be limited.
USD/NOK technical analysis
On the daily chart, the Relative Strength Index (RSI) for the USD/NOK is currently in positive territory. The upward slope indicates that buyers are beginning to assert control as the RSI readings moved from negative to positive region recently.
Comparatively, the RSI on the hourly chart shows similar signs of buyer dominance as the readings fall within the positive territory. This reaffirms the presence of the buying sentiment in both short and long-term perspective. Nonetheless, this perspective is somewhat dampened by the Moving Average Convergence Divergence (MACD). The MACD shows red bars in the hourly and daily chart, indicating negative momentum despite being flat. This indicates the presence of sellers in the market, putting a halt to the buying pressure as reflected by the RSI.
In the broader context, the pair is below its 20, 100, and 200-day Simple Moving Averages (SMAs) which is indicative of a controlled bear market. However, the underlined strengthening buyer dominance seen from the RSI might provide a reversal in trend if it maintains its consistency.
USD/NOK daily chart
- Gold price surges, buoyed by a decline in US Treasury yields and optimistic market conditions.
- Risk-on mood prevails, yet Gold attracts investors, defying typical safe-haven asset trends.
- Market sentiment adjusts to Fed's cautious stance with expectations of significant rate easing by year-end.
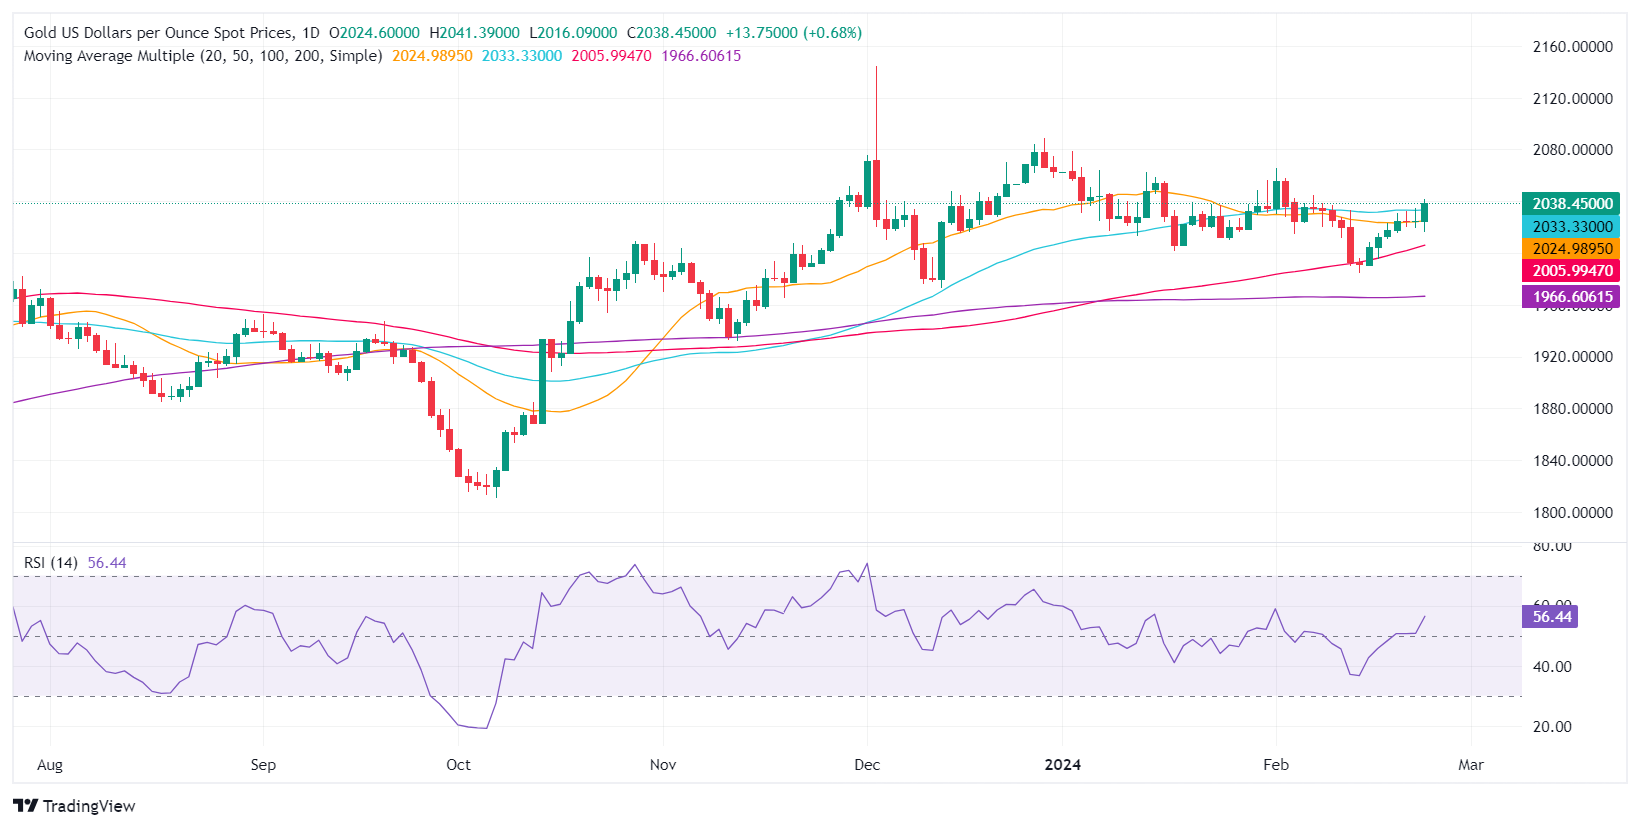
Gold price resumes its weekly uptrend on Friday and is set to finish the week in the green, taking advantage of the fall in US Treasury bond yields amid quiet news flows. Federal Reserve officials continued to cross the wires, led by New York Fed President John Williams, who aligned with his colleagues' recent comments. The XAU/USD exchanges hands at $2,038, up 0.70%.
The financial markets are in a risk-on mode, which usually translates to “less” appetite for safe-haven assets, but not today as Gold remains underpinned by dropping US Treasury yields. The 10-year benchmark note erased most of its gains, falling three and a half basis points, down to 4.248%. Despite Fed officials delivering a “slightly” hawkish tone recently, this was well received by investors who trimmed bets on Fed interest rate cuts and expect 93 basis points of easing toward the year’s end.
Daily digest market movers: Gold advance prompted by soft US Dollar undermined by lower US yields
- The Federal Open Market Committee (FOMC) minutes for January showed that policymakers remain hesitant to cut rates, adopting a cautious approach amid the latest resurgence of inflationary measures. Although acknowledging that the risks of achieving both mandates are more balanced, they would remain “highly attentive” to inflation. This is at the expense of economic risks being tilted to the downside.
- Besides that, the US labor market remains strong after the latest Initial Jobless Claims data saw fewer Americans applying for unemployment benefits.
- US business activity moderated in February, revealed S&P Global. The Services and Composite Indices expanded below the previous month’s reading, though Manufacturing surprisingly jumped, exiting contractionary territory.
- The CME FedWatch Tool sees traders expect the first 25 bps rate cut by the Fed in June 2024.
- Investors are pricing in 95 basis points of easing throughout 2024.
- The US Dollar Index, tracking the performance of the US Dollar against a basket of six major currencies, is currently trading near 103.90, down 0.04%.
- The Federal New York Fed President John Williams said the Fed is on track to cut interest rates “later this year.” He noted that the progress of inflation toward the central bank's 2% target would be “bumpy,” but overall, the economy is headed “in the right direction.”
Technical analysis: Gold surpasses the 50-day SMA eyes on $2,050
Gold has shifted to a neutral-upwards bias as it hurdles the 50-day Simple Moving Average (SMA) at $2,033.75, opening the door to challenge the $2,050 figure. Once those levels are cleared, up next would be the February 1 high at $2,065.60, ahead of the December 28 high at $2,088.48.
On the flip side, sellers dragging the XAU/USD spot price below the 50-day SMA could pave the way to test the October 27 daily high-turned-support at $2,009.42. A breach of the latter will expose the 100-day SMA at $2,002.05. The next stop would be the December 13 low at $1,973.13, followed by the 200-day SMA at $1,965.86.
XAU/USD Price Action - Daily Chart