- Аналітика
- Новини та інструменти
- Новини ринків
Новини ринків
Analysts from Toronto-Dominion Securities (TDS) have noted that short activities in Gold could be on the rise, and originating from China.
Shanghai traders selling into the safe-haven bid in Gold
As Chinese traders return to their seats following Golden Week holidays, our tracking of the largest participants in SHFE gold markets points to evidence that they have begun liquidating their bloated gold length, with 5.5k SHFE lots of net length sold over the last two trading sessions.
These liquidations represent approximately 13.5% of their total net length, and brings their net position a nudge closer to their average year-to-date position. At the same time, while the safe-haven bid may spark marginal buying activity from CTA trend followers this session, our positioning analytics argue for little risk of a large-scale buying program below the $1935/oz range.
Meanwhile, algos are unlikely to add to their shorts above the $1810/oz range, suggesting that prices are now in a no-man's-land for CTA flows for the time being. Given ongoing Shanghai selling activity, however, the risk of subsequent CTA selling activity may be more elevated.
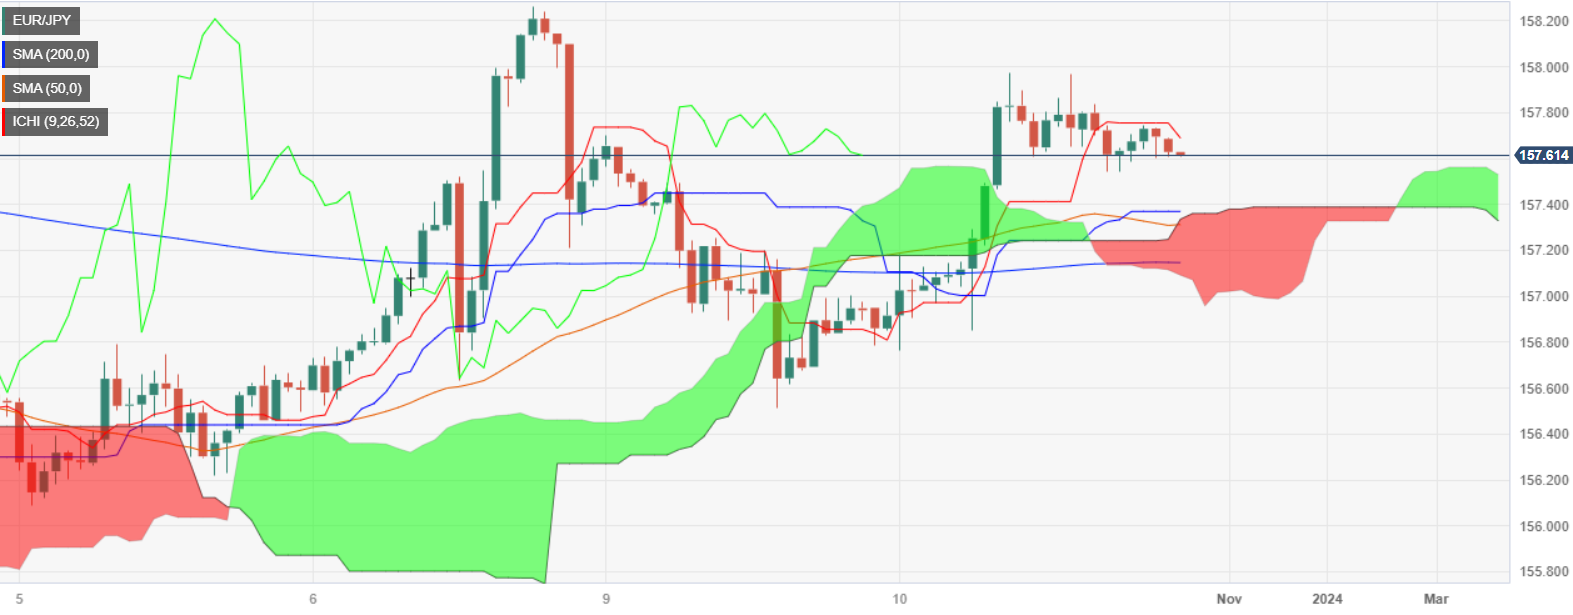
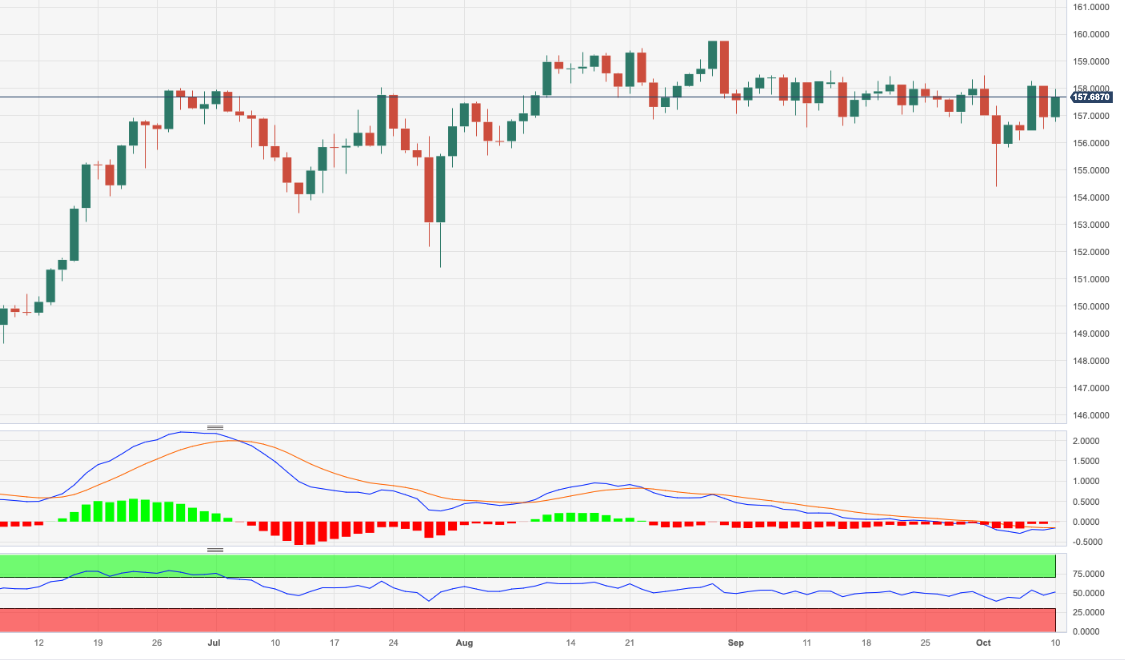
- EUR/JPY hovers at 157.66, seeking direction amidst a prevailing consolidation phase.
- Upside capped by Ichimoku Cloud; a breach of 158.26 needed to target September highs.
- Bearish signals from Chikou Span and Tenkan-Kijun cross may direct focus towards 156.40/49.
EUR/JPY traded sideways for the second straight day, though it printed gains of 0.52% on Tuesday and closed at 157.70. As Wednesday’s Asian Pacific session begins, the cross-currency pair is trading at 157.66, registering minuscule losses of 0.02%, at the time of writing.
Although the daily chart shows the pair remains in consolidation, it remains tilted to the downside as it has failed to record higher highs, since October 6 at 158.26. A breach of the latter is needed, which would put into play, the next cycle high printed on September 13 daily high at 158.65.
Consequently, the EUR/JPY is capped on the upside by the top of the Ichimoku Cloud (Kumo), which if broken could pave the way for further upside. Nevertheless, price action is tracking the top of the Kumo, and with market sentiment being fragile and the Chikou Span crossing below price action, a bearish signal, the pair could test the bottom of the Kumo at 155.50/60. Additionally, the Tenkan-Sen crossing below the Kijun-Sen could act as a magnet, and price action aims towards the 156.40/49 area.
EUR/JPY Price Action – Daily chart
EUR/JPY Technical Levels
Analysts with Toronto-Dominion Securities (TDS) note that US Consumer Price Index (CPI) figures due this week are likely to see a mild printing for September.
US CPI Scanner: Looking for firmer signs of deflationary pressures
Our forecasts for the September CPI report suggest core price inflation stayed largely unchanged vs last month's 0.28% m/m gain. Indeed, we expect the series to print another “soft” 0.3% m/m increase. We also look for a 0.3% gain for the headline, as retail gasoline prices eased post August surge.
Importantly, the report is likely to show that the core goods segment stayed modestly deflationary, while shelter-price gains probably slowed. Note that our unrounded core CPI inflation forecast is 0.26%, so we see a clear bias for a downside surprise to 0.2% m/m.
We now look for headline CPI to slow to 3.2% y/y in 23Q4, after closing 2022 at a booming 7.1% y/y pace. For core CPI, we also project deceleration to a still strong 3.9% y/y in 23Q4 from 6.0% in 22Q4.
... real rates look attractive given positive carry and a risk to higher oil prices in the near-term. However, near-term geopolitical uncertainty and the potential for real rates to keep rising is likely keeping dip buyers away.
- US equities saw mild lift on Tuesday, with broader indexes rising across the board.
- Investors are leaning into expectations of no more rate hikes from the Fed.
- With US inflation figures due later this week, investors will get the chance to readjust their expectations.
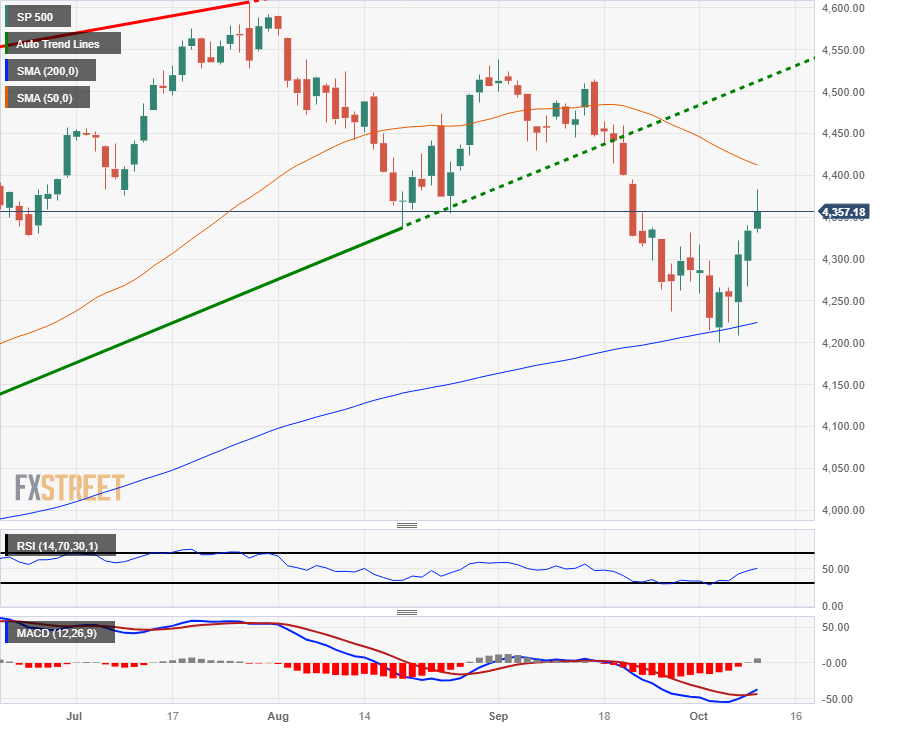
The Standard & Poor's 500 major equity index climbed on Tuesday, reaching an intraday peak of $4,382.92 before settling back slightly into $4,357, gaining 22.58 points, or 0.52%.
The other major equity boards saw similar gains for the day, with the Dow Jones Industrial Average (DJIA) climbing 134.65 points to $33,739.30, gaining 0.40%, and the NASDAQ Composite index rising 78.60 point to close up 0.58% at $13,562.84.
Federal Reserve (Fed) officials came in mixed on Tuesday, but mostly on-brand for the US central bank; inflation remains elevated, but the Fed sees price growth pressures subsiding into the future, and if inflation figures continue to waft softly lower, it's unlikely that the Fed will see additional rate hikes to close out 2023.
Fed officials cool inflation expectations, but warn that policy room remains
Fed's Bostic: We don't need to increase rates any more
NY Fed's Perli: No sign yet Fed needs to change balance sheet plans
Fed's Kashkari: We may have to raises rates further if the economy stays too strong
The weekend's geopolitical escalation of the long-running Israel-Hamas conflict saw concerns about stability in the Middle East on the rise, but equities have absorbed the escalation, and investors will be keeping an eye out for an escalation of combative rhetoric from the US against Iran or Saudi Arabia.
The US, an ardent supporter of Israel, has a finger on the trigger if Iran makes any moves to prop up the Palestinian Hamas, but despite the risks, equity markets have shrugged off the potential for escalation until more evidence presents itself.
S&P 500 Technical Outlook
Tuesday's gains see the S&P 500 edge higher and close in the green for the third consecutive trading day, and the index has closed higher for four of the last five market sessions.
The S&P 500 recently rebounded from the 200-day Simple Moving Average (SMA) near $4,225, but a continuation of bullish momentum will need to overcome a bearish 50-day SMA, currently descending into $4,400.
S&P 500 Daily Chart
S&P 500 Technical Levels
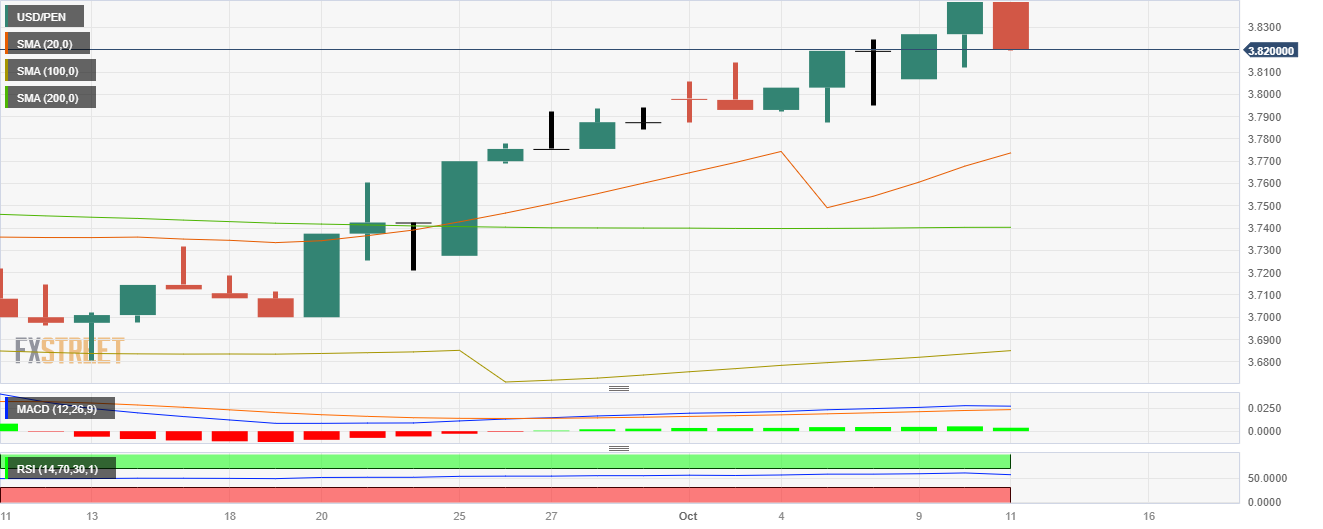
- USD/PEN trades with losses at the 3.8200 area.
- Investors await inflation figures from the US on Thursday, which are expected to have decline in September.
- Dovish Fed officials make the US Dollar lose interest, but the escalation of the Israeli conflict may limit the losses.
On Tuesday, the USD/PEN saw downward movements and declined to 3.8200. On the one hand, Federal Reserve (Fed) officials are delivering dovish messages which weaken the green currency, while the PEN is seen as vulnerable after last week’s rate cuts by the Peruvian Central Bank.
In line with that, after Lorie Logan stated on Monday that the Fed has “less need to continue hiking”, Raphael Bostic added during Tuesday’s session that the bank “doesn't need to increase rates any more”. As a reaction, US bond yields are retreating but remain high, with the 2,5 and 10-year rates standing at 4.96%,4.61% and 4.67%.
On Wednesday, the Federal Open Market Committee (FOMC) will release its September meeting minutes. For Thursday’s session, investors will closely watch the September Consumer Price Index (CPI) figures from the US, which is expected to decline to 3.6% YoY and the Core measure, which is seen falling to 4.1%. In that sense, both events will impact the expectations of the following Fed decisions and, hence, the USD price dynamics.
On the PEN side, the currency seems to be losing interest after last Thursday's Banco Central de Reserva del Peru (BCRP) decision to reduce the rate to 7.25%. However, the policy statement indicated that the decision doesn’t imply a cycle of successive interest rate cuts, as further adjustments will depend on incoming information.
USD/PEN Levels to watch
The technical outlook for the USD/PEN is bullish for the short term, but indicators flash overbought conditions, suggesting that more downside may be on the horizon. The Relative Strength Index (RSI) stands above 70, while the Moving Average Convergence (MACD) prints stagnant green bars. Also, the pair is above the 20,100,200-day Simple Moving Average (SMA), implying that the bulls retain control on a broader scale.
Support levels: 3.7705, 3.7484 (20-day SMA), 3.7350.
Resistance levels: 3.8360, 3.8490, 3.8600.
USD/PEN Daily Chart
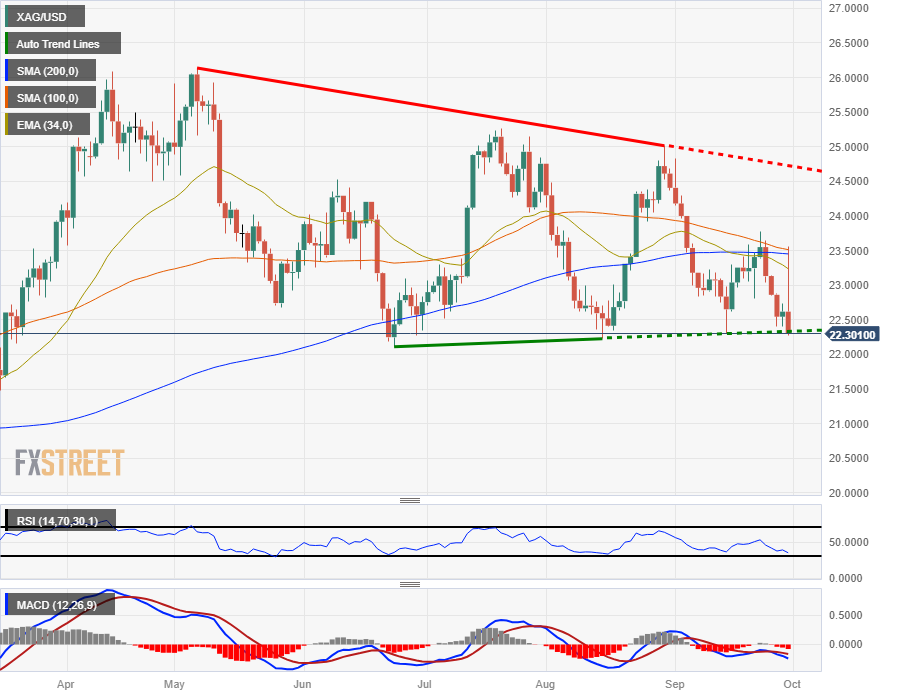
- XAU/USD is sticking close to Tuesday's opening bids after Monday's 1.5% gainer.
- Market sentiment is shifting, but holding steady after the weekend's Gaza Strip escalation.
- US Treasury yields are easing for Tuesday, sapping momentum from spot Gold.
The XAU/USD Gold spot price is holding flat for Tuesday's trading session after the weekend's geopolitical strain from an escalating Gaza Strip conflict sent Gold climbing nearly 3% from a near-term low of $1,810.51.
Gold's response to a ramping up of geopolitical tensions in the Middle East is likely subdued by inflation expectations and investors leery of the Federal Reserve's (Fed) rate outlook; the Fed has kept the door wide open for an additional rate hike before the end of 2023, but a mix of dovish and hawkish comments from different Fed officials on Tuesday are obscuring the way forward.
Fed's Kashkari: We may have to raises rates further if the economy stays too strong
NY Fed: Year-ahead expected inflation edges higher to 3.7% from 3.6% in August
Inflation risks remain a key driver of Gold spot prices, and investors will be keeping a close eye on the Fed before making any major market moves.
Upshot commodity prices on geopolitical tensions and inflation fears will likely remain muted moving forward until investors draw a sharper forecast on the Fed's "dot plot" rate hike expectations looking towards 2024.
XAU/USD Technical Outlook
Spot Gold remains firmly bearish in the medium-term despite the recent rebound in XAU/USD prices, trading far below the 200-day Simple Moving Average (SMA) near $1,930, and an extended bullish move for Gold will quickly run into resistance from the 50-day SMA currently sinking into the $1,900 handle.
XAU/USD sees itself well off 2023's highs near $2,080, with spot Gold down over 10.5%, or $220 per ounce.
If Gold prices continue to sink, the XAU/USD will be set to make a fresh low for the year and make a challenge of the $1,800 major handle, a price that hasn't been by spot Gold since last December.
XAU/USD Daily Chart
XAU/USD Technical Levels
During the Asian session, RBA Deputy Governor Kent will deliver a speech. Additionally, Japan will release its Machinery Tool Orders report. Later in the day, the key reports to watch for will be the US Producer Price Index (PPI) and the release of the FOMC minutes.
Here is what you need to know on Wednesday, October 11:
The US Dollar lost ground again as the improvement in market sentiment continued, and US yields remained far from recent highs. The 10-year yield settled at 4.65%, while the 2-year yield slipped below 5%. The DXY index posted its lowest daily close since September 18, dropping below 106.00.
On Wednesday, the US will release the September Producer Price Index (PPI), which could have significant implications if it surprises to the upside. Later in the day, the Federal Reserve (Fed) will release the minutes from the September FOMC meeting. On Thursday, the Consumer Price Index (CPI) is due.
Wall Street finished with gains on Tuesday, which weighed on the US dollar. Crude oil pulled back modestly, trading within moderate ranges. Commodity prices showed mixed moves, holding onto recent gains. The situation in the Middle East continues to be a source of uncertainty.
EUR/USD rose above the 20-day Simple Moving Average (SMA) for the first time since August. The pair is trading around 1.0600 and faces key resistance at 1.0630. Germany will release the final CPI for September on Wednesday.
GBP/USD also rose above the 20-day SMA. The rally faded near 1.2300, but short-term momentum still favors the Pound.
The Japanese yen was the underperformer on Tuesday among G10 currencies. The modest rebound in yields combined with rising equity prices weighed on the currency. USD/JPY peaked above 149.00 but then pulled back to 148.60.
AUD/USD rose for the fifth consecutive day. The pair is holding firm above 0.6400, looking set to extend the recovery. Key resistance awaits at 0.6500.
NZD/USD held above 0.6000 and posted its highest daily close in two months at 0.6040. It also rose for the fifth consecutive day.
USD/CAD moved sideways near the 1.3600 area as the Canadian Dollar consolidated recent gains. A flat 20-day SMA is awaits at 1.3555.
Like this article? Help us with some feedback by answering this survey:
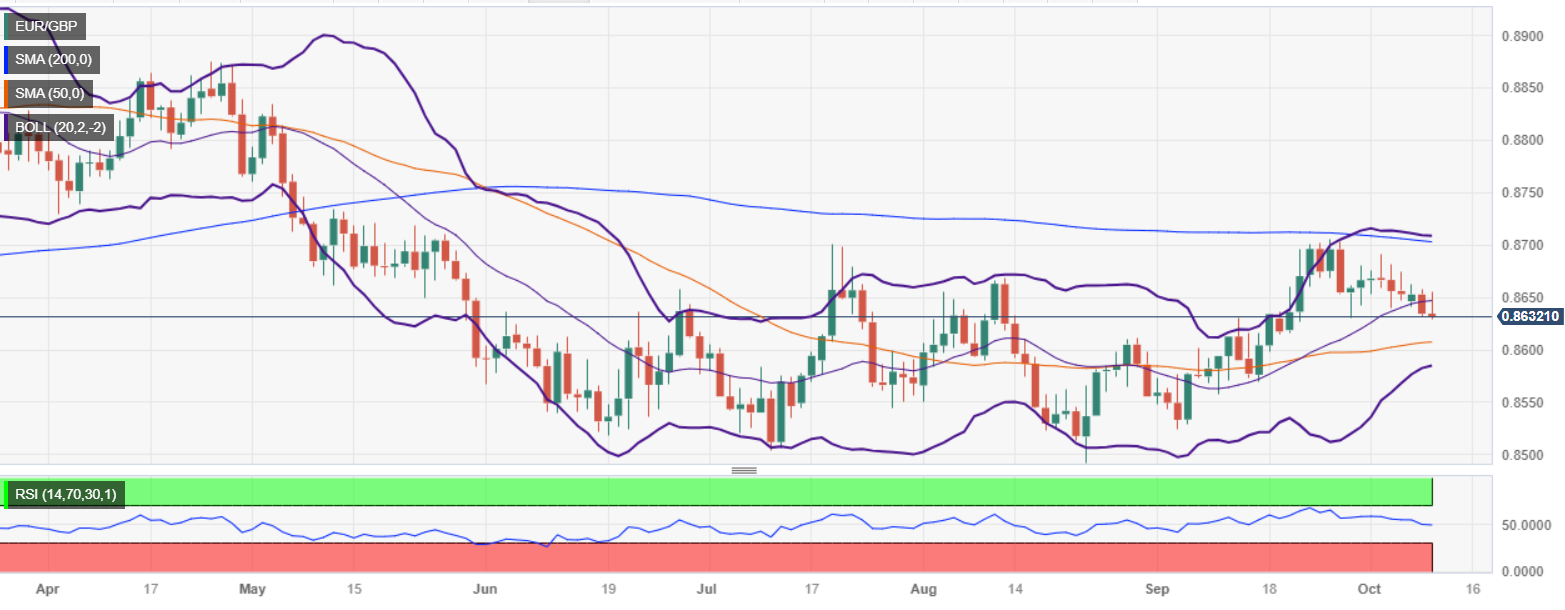
- EUR/GBP lingers at 0.8631, with 0.8628 emerging as a formidable demand zone.
- A breach below 0.8628 could unlock targets at 0.8605 and the pivotal 0.8600.
- Recovery above 0.8655 may pave the way for a test of the crucial 0.8700 barrier.
EUR/GBP prolongs its agony to seven straight days of losses, though it is capped on the downside by the latest cycle low reached on September 28 at 0.8628, which has acted as a strong demand zone. At the time of writing, the cross-currency pair is trading at 0.8631, losing 0.03%.
The daily chart portrays the pair as neutral to downward biased, but EUR/GBP sellers remain unable to crack 0.8628. A breach of the latter, and the 50-day moving average (DMA) at 0.8605 would be up for grabs, before challenging 0.8600. Once cleared, the next support would be the year-to-date (YTD) low of 0.8492.
Conversely, if EUR/GBP buyers lift the spot price past the October 10 daily high of 0.8655, they could test the 200-DMA and the 0.8700 figure confluence. A decisive break would expose the 0.8750 area, followed by the May 3 daily high at 0.8834.
EUR/GBP Price Action – Daily chart
EUR/GBP Technical Levels
Minneapolis Federal Reserve Bank President Neel Kashkari said on Tuesday that he believes the US economy is headed toward a soft landing but warned that it is not yet time to declare victory. Such a scenario would involve the unemployment rate not rising sharply and inflation gradually moving towards the 2% target.
Speaking at a town hall hosted by Minot State University, Kashkari mentioned that the US economy has shown unexpected resilience. He cautioned that if the economy becomes too strong, the central bank may have to raise rates further. Kashkari described the recent increase in the 10-year Treasury yield as "perplexing."
Market reaction
The US Dollar Index is falling for the fifth consecutive day, trading below 106.00, as US yields consolidate a recent decline.
- AUD/USD lifts to 0.6422, benefiting from USD pressure as US Treasury yields recede.
- Geopolitical tensions, with conflict between Israel and Hamas, introduce potential headwinds for AUD.
- Upcoming US and Australian inflation data, alongside continued Fed commentary, to steer pair’s direction.
The Australian Dollar (AUD) registered modest gains versus the US Dollar (USD) late in the North American session, with the latter remaining under selling pressure as US Treasury bond yields began to pair their earlier losses. At the time of writing, the AUD/USD is trading at 0.6422, gaining 0.21% after bouncing from daily lows of 0.6390.
Aussie Dollar gains traction vs. a wavering US Dollar, while geopolitical and economic data looms large
AUD/USD continues to be driven by market mood as Wall Street prints gains of between 0.43% and 0.70%. Nevertheless, it could take a hit as the White House asks the US Congress to provide additional help to Israel amidst a conflict between the latter and Hamas that erupted over the weekend.
Data-wise, the US economic agenda featured the New York Fed Inflation expectations poll for September, which showed Americans are pessimistic about elevated prices, as they see inflation to remain at 3.7%, up from 3.6% in 12 months from now. For three years, they revised its target upward from 2.8% in August to 3%. Other data showed US small businesses are turning pessimistic, as the NFIB index came at 90.8, below forecasts of 91.4. The reasons behind the sentiment is high prices and labor shortages.
On the Australian side, business conditions remained resilient in September as inflation decelerated. At the same, October’s Consumer Sentiment rebounded as rates remained unchanged, but the mood remained clouded amid the increase of cost living.
Ahead of the week, the US economic agenda will feature the producer and consumer inflation on Wednesday and Thursday, respectively, while the Fed parade continues. On the Australian front, Consumer inflation expectations will be featured on Thursday.
AUD/USD Price Analysis: Technical outlook
The AUD/USD daily chart portrays the pair was shy of testing the 50-day moving average (DMA) at 0.6436, which exacerbated a retracement towards the 0.6420 area, opening the door for a downtrend continuation. For sellers, they must drag prices below 0.6400 to gather momentum to drive the spot price towards the year-to-date (YTD) low of 0.6285. Conversely if AUD/USD buyers reclaim the 50-DMA, that would open the door to challenge the 0.6500 figure.
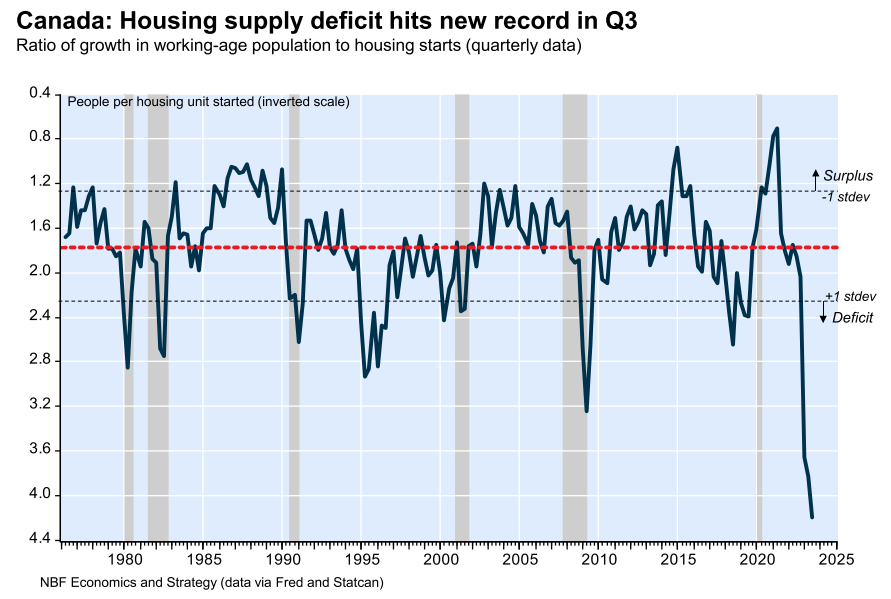
The National Bank of Canada's Stéfane Marion is out with a report on Canada's record housing deficit which set an all-time low in the third quarter.
With Canadian housing costs soaring, supply constraints will only push mortgage lending costs and rents even higher, with Canadian home and shelter costs already seen dragging down economic growth for the foreseeable future.
Canada housing supply hits all-time deficit
The September employment report showed another outsized increase in the working-age population, resulting in a cumulative quarterly gain of 267,000 in Q3. This surge, the largest on record, followed a gain of 238,000 in the second quarter and 204,000 in the first quarter.
There is no precedent in modern Canadian history for setting three consecutive quarterly records for population growth.
... as a result, the housing supply deficit worsened to its worst level on record in Q3.
there is currently only one housing starts for every 4.2 people entering the working-age population (people 15+). This compares to a historical ratio of one housing starts for every 1.8 new entrants to the working-age population.
This massive imbalance is likely to persist for the foreseeable future until demographic growth slows significantly.
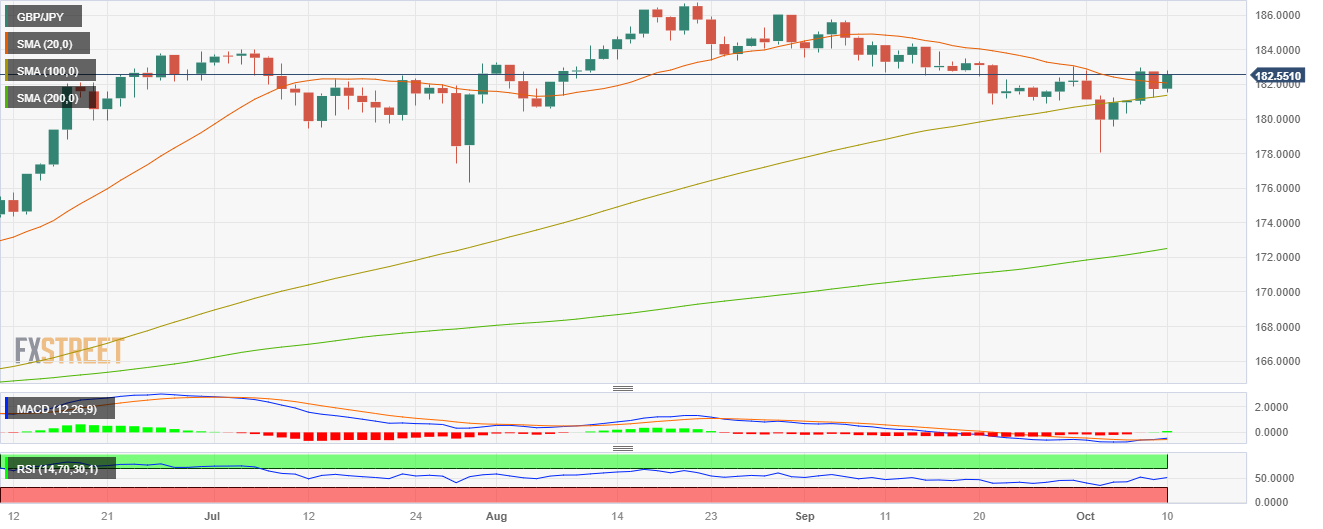
- GBP/JPY advanced near 182.50, up by 0.44%.
- The 100 and 20-day SMA are converging towards 181.50.
- Indicators on the daily chart suggest that bullish momentum is still weak.
In Tuesday's session, the GBP/JPY gained ground and jumped to 182.50, but the daily chart's bullish momentum appears weak.
In line with that, the GBP/JPY has a neutral to bearish technical stance, with the bears gradually recovering and asserting themselves. Despite the Relative Strength Index (RSI) maintaining a positive slope above its midline, bulls appear not to have the necessary momentum to continue climbing. In addition, the Moving Average Convergence (MACD) exhibits stagnant green bars. To add to that, the 20 and 100-day Simple Moving Average are converging towards the 181.50 area, and in case of completing the cross, the bears could gather momentum, usually typical when a short-term crosses below a longer-term moving average.
In that sense, support levels line up at the 181.50 area, followed by the 181.00 and 180.00 area. On the other hand, resistances are seen at 183.00, 183.50 and 184.00.
GBP/JPY Daily chart
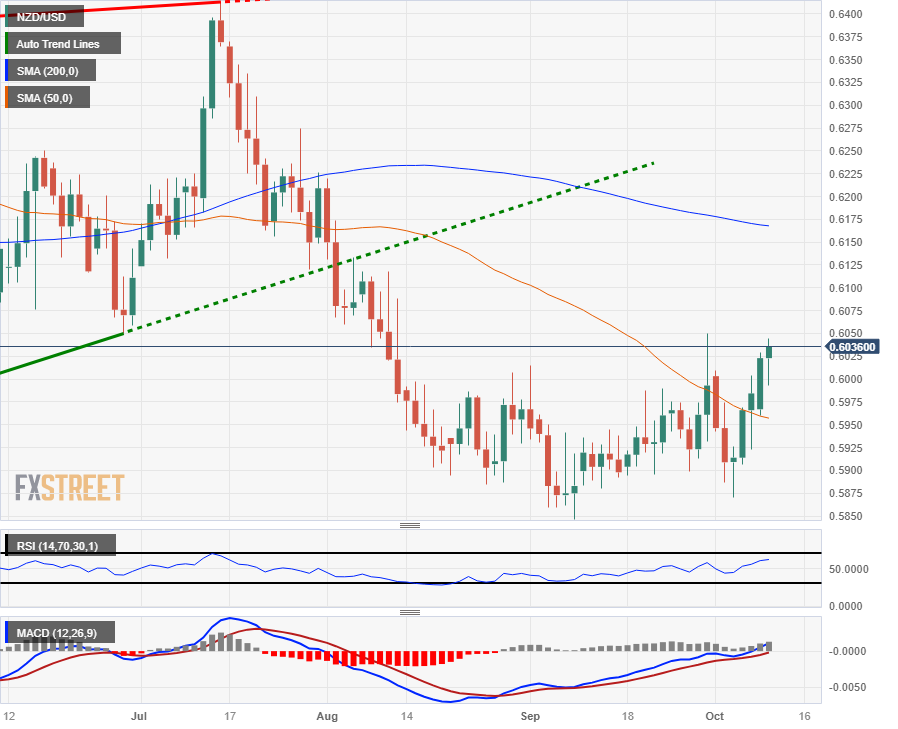
- The NZD/USD is seeing small gains on Tuesday, but is struggling to climb over near-term resistance.
- The Kiwi is getting knocked back from 0.6040 after building a floor from the 0.6000 handle.
- With the economic calendar anemic on the Kiwi side, market direction will be determined by US inflation figures this week.
The NZD/USD found some soft support for Tuesday's trading session, putting in a daily floor near 0.5998, but bullish momentum remains limited and the Kiwi (NZD) is struggling to find a foothold above 0.6040 against the US Dollar (USD).
Economic data on the calendar is incredibly thin and low-impact for the Kiwi this week, though NZD traders will want to keep one eye on the New Zealand Business NZ Purchasing Manager Index (PMI) for September, which last read at a contracting 46.1, and is slated to print at 21:30 GMT on Thursday.
Wednesday brings US Producer Price Index (PPI) figures, with the annualized September reading expected to tick upwards from 2.2% to 2.3%, while Thursday's Consumer Price Index (CPI) for the same period is forecast to print slightly back at 4.1% versus the previous 4.3%.
NZD/USD Technical Outlook
The Kiwi's Tuesday bounce is dragging the NZD/USD higher, but the 0.6050 handle remains the level to clear before the pair can claim new six-week highs, with the 50-day Simple Moving Average (SMA) now providing technical support from 0.5950, with technical resistance from the 200-day Simple Moving Average (SMA) sitting just below 0.6175.
Despite a near-term rebound from 2023's lows near 0.5850, the Kiwi remains firmly lower against the US Dollar for the year, down nearly 6% from the last meaningful swing high at July's peak near 0.6410, and in the red over 7.5% from 2023's February high at 0.6540.
NZD/USD Daily Chart
NZD/USD Technical Levels
With the Chinese Yuan depreciating against the US Dollar, keeping the USD/CNY pinned into yearly highs, economists at Nataxis note that things could continue to deteriorate for the Renminbi as foreign direct investment in China has collapsed recently, sparked by hostility from the Chinese government towards foreign corporate entities and a slumping domestic Chinese economy.
Direct investment by foreign companies has completely collapsed, from $400 billion annually in 2020 to just $20 billion in 2023.
Direct investment by foreign companies has collapsed in two years
This reflects a sharp deterioration in China's image among foreign companies, which is a consequence of the significant slowdown in the Chinese economy, the Chinese government's increasingly hostile attitude towards foreign companies in China, rising political risk, US and European sanctions against China, and the prospect of higher tariffs on Chinese products in the United States and Europe.
This trend in foreign investment in China is reinforcing the depreciation of the renminbi.
The sudden decline in China's attractiveness for foreign companies is probably explained by:
The decline in China's growth outlook, due to population ageing and declining productivity gains.
(Declines in direct foreign investment) is shifting foreign companies' investment to other countries, particularly in Southeast Asia and India, and is stimulating growth in these other countries.
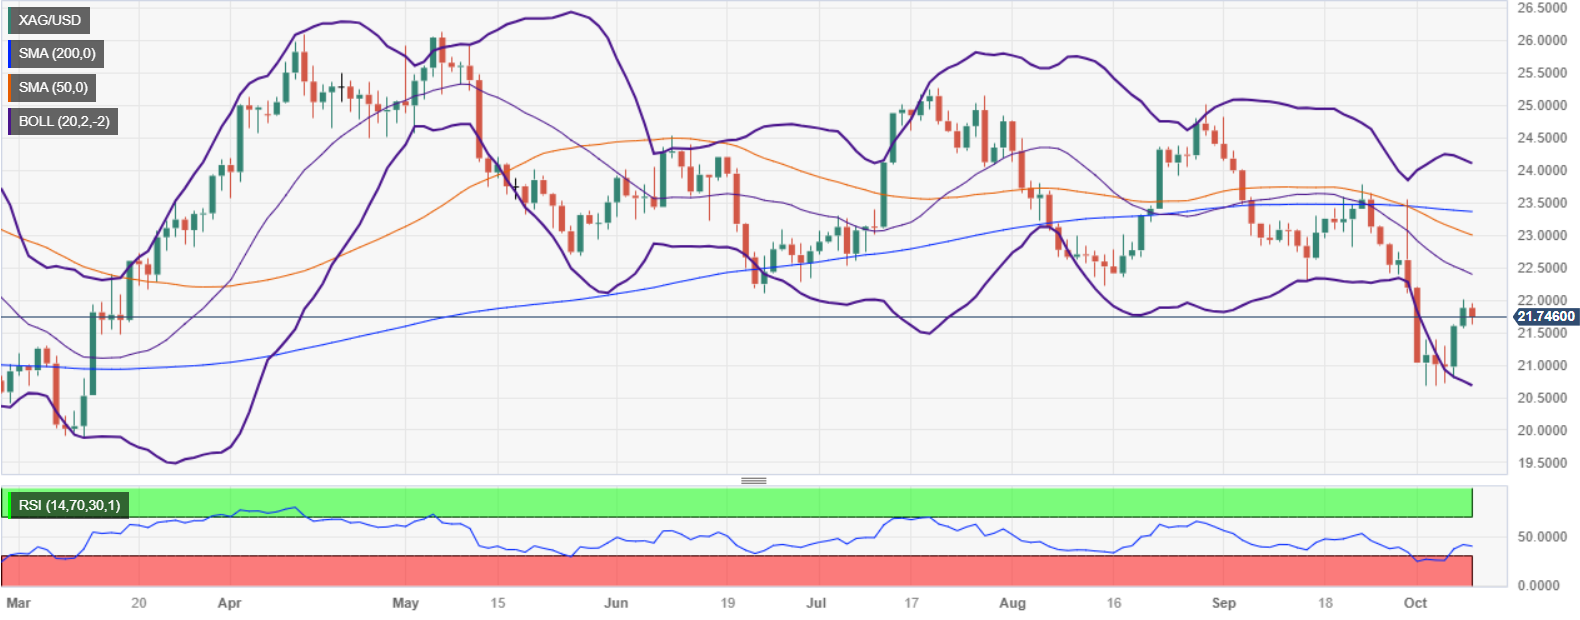
- Silver price struggles beneath the $22 mark, forming a bearish 'harami' pattern on daily charts.
- Potential bearish continuation looms, with sights set on the October 9 low of $21.57.
- Recovery above $22.00 necessitates claiming $22.11, with subsequent hurdles noted at 20-day EMA.
Silver price (XAG/USD) loses some of its bright, retreats from around weekly highs of $22.01 and is back below the figure, exchanging hands at around $21.75, even though US Treasury bond yields continued to extend their losses.
The daily chart portrays the white metal was shy of reclaiming the June 23 swing low of $23.11, but failure to do it, exacerbated selling pressure at around the $22.00 mark. Consequently, XAG/USD dropped and is forming a two-candlestick bearish pattern, called a ‘bearish-harami’, the equivalent of an ‘inside day.’ A bearish continuation would happen, once Silver price slides below the October 9 swing low of $21.57, putting into play a test of the year-to-date (YTD) low of $19.90.
On the other hand, if XAG/USD recovers the $22.00 figure, buyers must claim a June 23 low of $22.11. A breach of the latter will expose the 20-day Exponential Moving Average (EMA) at $22.38 before testing the 50-day moving average (DMA) at $22.98.
XAG/USD Price Action – Daily chart
XAG/USD Technical Levels
- USD/CHF declined towards 0.9040, consolidating below the 20-day SMA.
- Federal Reserve officials will be on the wires later in the session.
- FOMC minutes on Wednesday and CPI figures from September from the US the next week highlights.
The USD/CHF declined near the 0.9040 level and tallied its fifth straight day of losses. For the US Dollar, the economic calendar will remain empty on Tuesday. The only highlights are Christopher Waller and Neel Kashkari from the Federal Reserve (Fed) speaking later in the session. As Lorie Logan stated yesterday, tighter financial conditions may put less pressure on the Fed to continue hiking; both speakers could generate volatility in the bond markets if they provide clues on forward guidance and affect the US Dollar price dynamics. Likewise, no relevant reports or data will be released on the Swiss economic calendar.
In the meantime, the focus is set on Wednesday’s Federal Open Market (FOMC) minutes from the September meeting, where investors will look for further clues on the Fed official's stance. In addition, the US September inflation figures are due on Thursday, which are expected to see the headline and core Consumer Price Index (CPI) decelerating. Furthermore, traders should monitor the conflict in Israel as growing tensions could benefit the US Dollar as a safe haven.
USD/CHF Levels to watch
The daily chart analysis indicates a bearish outlook for the USD/CHF in the short term. The Relative Strength Index (RSI) is below its midline in negative territory, with a negative slope, aligning with the negative signal from the Moving Average Convergence Divergence (MACD), which displays red bars, reinforcing the strong bearish sentiment. Additionally, the pair is below the 20-day Simple Moving Average (SMA), but above the 100 and 200-day SMAs, suggesting that the bulls are in command over the bears on the bigger picture.
Support levels: 0.9050, 0.9030, 0.9000.
Resistance levels: 0.9073 (20-day SMA), 0.9150, 0.9170.
USD/CHF Daily Chart
-638325543745498260.png)
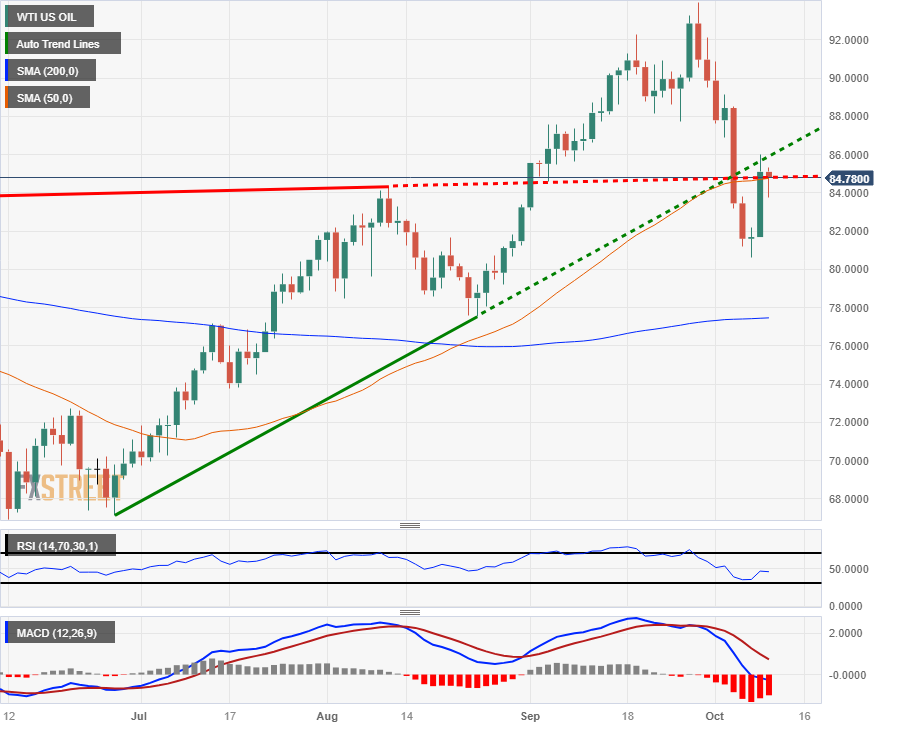
- WTI in play near $85.00, trading flat after clipping higher following the weekend's Hamas-Israel conflict escalation.
- Crude Oil prices jumped as investors grow uneasy about geopolitical instability in the Middle East.
- Investors concerned about the potential for spillover from Gaza Strip into nearby countries, threatening major oil production in the region.
West Texas Intermediary (WTI) Crude Oil prices jumped on Monday after the long-running Gaza Strip conflict between Israel and Palestinian Hamas saw its largest escalation in over fifteen years. WTI barrels are trading near $85.00/bbl after the jump, from last week's lows near $80.60.
While Israel and Hamas are not major players in the oil scene, investors are concerned that geopolitics will spill over into neighboring Iran and Saudi Arabia, and a spreading conflict in the region could also threaten the stability of the Strait of Hormuz, a critical oil supply route that sees nearly a fifth of global oil distribution.
Iran, a public supporter of Hamas, has so far denied any connection or involvement in the Gaza conflict escalation, but market unease remains high about the possibility of further Iranian sanctions from the US, a supporter of Israel.
US politicians are doing little to assuage energy investor fears, with US Senator Lindsey Graham noting on Monday that the US should threaten Iranian oil infrastructure, stating that "If there is an escalation in this conflict, if hostages start getting killed, if Hezbollah in the north attacks Israel in strength, we should tell the Ayatollah we will destroy your oil refineries and your oil infrastructure." Oil barrel traders will be keeping a close eye on any rhetoric escalations from the US.
The US eased Iranian oil restrictions back in August as crude oil supplies drastically undershoot global demand, drawing down US oil reserves into record lows.
Keeping oil prices from spiraling out of control is slumping global demand for crude barrels and a massive overhang in gasoline reserves after refiners capitalized on recent spikes in crude prices, and investors will be looking out for further stimulus programs from China, which could re-ignite demand for oil, further constraining supply lines.
WTI Technical Outlook
WTI Crude Oil barrels climbed over 5.5% on Monday, and are currently splashing around near $85.00/bbl. Despite Monday's spike, WTI remains firmly lower from the recent peak of $93.98.
The recent chart decline in WTI barrel costs saw US oil prices tumble below a rising trendline from the June low of $67.14, and prices are currently hung up on the 50-day Simple Moving Average (SMA), with technical support coming from the 200-day SMA just south of the $78.00 handle.
WTI Daily Chart
WTI Technical Levels
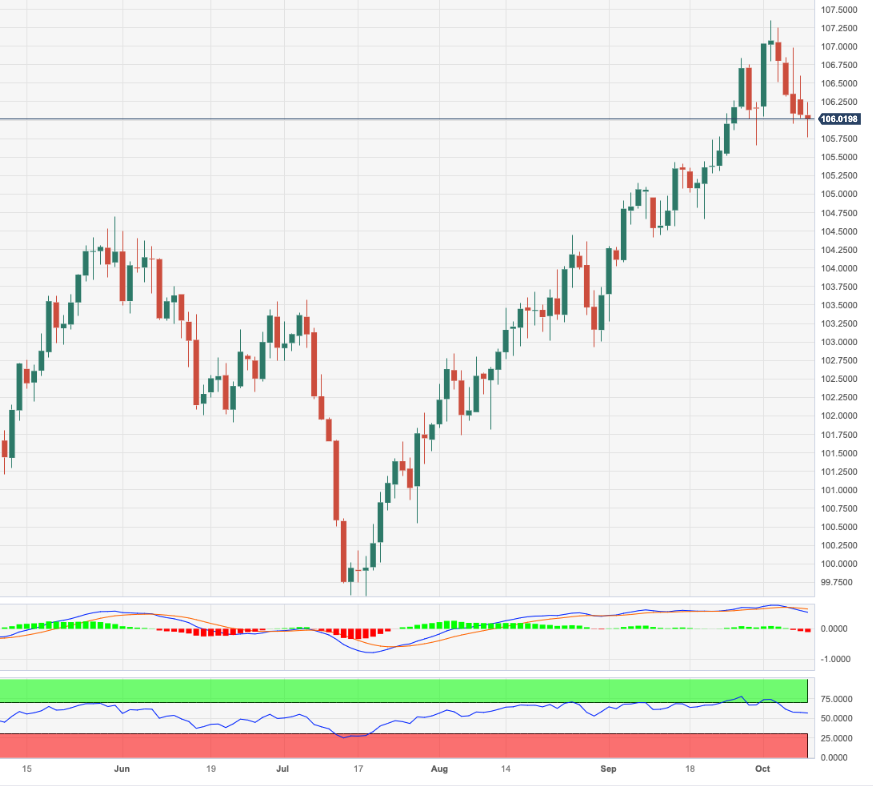
- US Dollar continues consolidating early October gains.
- Inflation in the United States is expected to have decelerated in September.
- Christopher Waller and Neel Kashkari will be on the wires.
The US Dollar (USD) measured by the US Dollar DXY Index trades with losses despite US Treasury yields recovering and a cautious market mood amid the Middle East geopolitical conflict between Israel and the Hamas terrorist group. Investor’s focus is set on Wednesday’s Federal Open Market Committee (FOMC) from the September meeting and the Consumer Price Index (CPI) from the same month.
In the meantime, the United States economy still shows signs of not cooling down as September’s Nonfarm Payrolls (NFP) showed that job creation accelerated while unemployment rose and wage inflation declined. In addition, Manufacturing PMIs came in better than expected and contributed to investors placing hawkish bets on the Federal Reserve (Fed), which took the DXY index to multi-month highs above 107.00. For the rest of the session, investors will look for clues on the next Federal Reserve (Fed) movements on the Christopher Waller and Neel Kashkari speeches later in the session.
Daily Digest Market Movers: US Dollar consolidates last week’s rally; resilient US economy and Middle East geopolitical tensions could reignite its bullish momentum
- The US Dollar DXY index continues consolidating and declining towards 105.70, tallying more than 1% losses in October after peaking at 107.35.
- September Nonfarm Payroll (NFP) came in at 336,000, higher than the 170,000 expected and the previous 270,000. Unemployment rose to 3.8%, and Average Hourly Earnings decelerated to 4.2%.
- US S&P Manufacturing PMI from September came in at 49.2, higher than the expected previous 48.9.
- The ISM Manufacturing PMI rose to 49 vs the expected 47.7 and the previous 47.6.
- All in all, economic activity is showing resilience, and as the labour market is not cooling down, the Federal Reserve Officials (Fed) may consider one more rate hike.
- On Monday, Lorie Logan from the Fed stated that higher bond yields and restrictive financial conditions would mean “less need” for the central bank to continue hiking.
- Christopher Waller and Neel Kashkari from the Fed will be on the wires later in the session, where investors will look for clues regarding forward guidance.
- The minutes from September’s meeting of the Federal Open Market Committee (FOMC) are due on Wednesday, and the Consumer Price Index (CPI) figures from the same month are due on Thursday.
Technical analysis: US Dollar Index slides to 105.70 below the 20-day SMA
The US Dollar Index DXY sees a neutral-to-bearish technical outlook for the short term. The Relative Strength Index (RSI) displays a negative slope near the 50 middle-point while the Moving Average Convergence Divergence (MACD) stands in negative territory, indicating that the bears hold the upper hand in the short term.
That being said, the index is comfortably above the 100 and 200-day Simple Moving Averages (SMA), indicating that the bulls command the broader scale. If they fail to defend the 20-day average at 105.90, more downside may be on the horizon, with support lining up at 105.50, 105.30 and 105.00.
US Dollar FAQs
What is the US Dollar?
The US Dollar (USD) is the official currency of the United States of America, and the ‘de facto’ currency of a significant number of other countries where it is found in circulation alongside local notes. It is the most heavily traded currency in the world, accounting for over 88% of all global foreign exchange turnover, or an average of $6.6 trillion in transactions per day, according to data from 2022.
Following the second world war, the USD took over from the British Pound as the world’s reserve currency. For most of its history, the US Dollar was backed by Gold, until the Bretton Woods Agreement in 1971 when the Gold Standard went away.
How do the decisions of the Federal Reserve impact the US Dollar?
The most important single factor impacting on the value of the US Dollar is monetary policy, which is shaped by the Federal Reserve (Fed). The Fed has two mandates: to achieve price stability (control inflation) and foster full employment. Its primary tool to achieve these two goals is by adjusting interest rates.
When prices are rising too quickly and inflation is above the Fed’s 2% target, the Fed will raise rates, which helps the USD value. When inflation falls below 2% or the Unemployment Rate is too high, the Fed may lower interest rates, which weighs on the Greenback.
What is Quantitative Easing and how does it influence the US Dollar?
In extreme situations, the Federal Reserve can also print more Dollars and enact quantitative easing (QE). QE is the process by which the Fed substantially increases the flow of credit in a stuck financial system.
It is a non-standard policy measure used when credit has dried up because banks will not lend to each other (out of the fear of counterparty default). It is a last resort when simply lowering interest rates is unlikely to achieve the necessary result. It was the Fed’s weapon of choice to combat the credit crunch that occurred during the Great Financial Crisis in 2008. It involves the Fed printing more Dollars and using them to buy US government bonds predominantly from financial institutions. QE usually leads to a weaker US Dollar.
What is Quantitative Tightening and how does it influence the US Dollar?
Quantitative tightening (QT) is the reverse process whereby the Federal Reserve stops buying bonds from financial institutions and does not reinvest the principal from the bonds it holds maturing in new purchases. It is usually positive for the US Dollar.
- EUR/USD rebounds from daily lows, capitalizing on a 17 bps plunge in US 10-year Treasury yields.
- Dovish remarks from Fed officials, hinting at a pause in rate hikes, further dampened USD’s appeal.
- Anticipation builds for forthcoming US and German inflation data, potentially swaying ECB and Fed stances.
The Euro (EUR) recovered ground against the US Dollar (USD) amidst dovish comments from Federal Reserve (Fed) officials, which spurred a drop In US Treasury yields a headwind for the Greenback (USD). The EUR/USD is trading at 1.0616 after bouncing from a daily low of 1.0554.
Euro bounces back against faltering US Dollar amidst dovish Fed tilt
A light economic calendar on both sides of the Atlantic keeps the EUR/USD entertained on US Dollar dynamics and market mood. The US 10-year Treasury bond yield has plunged 17 bps to 4.632% since Monday, undermining the Greenback as shown by the US Dollar Index (DXY). The DXY, which measures the US Dollar performance vs. a basket of six currencies, is diving for the fifth consecutive day, down 1.62%, after hitting a yearly high of 107.34. At the time of writing, it hovers around 105.67, losses 0.36% daily.
A slew of Fed policymakers struck the markets with dovish-tilted remarks, saying that higher long-term US bond yields might prevent them from increasing rates at the upcoming meetings. Today, Atlanta’s Fed President Raphael Bostic stated that monetary policy is already restrictive and that further increases are unnecessary.
Data-wise, the IS small business sentiment moderately decelerated due to inflation and labor shortages. A poll from the New York Fed showed that consumers are expecting inflation a year from not to hit 3.7%, above August’s 3.6%, while for a three-year, they see prices at 3%, from August’s 2.8%.
The drop in German bond yields is capping the EUR/USD advance on the Eurozone front, while the European Central Bank (ECB) is expected to halt its tightening cycle, according to market participants.
Ahead of the week, the US economic docket would feature inflation data on the producer and consumer side. Across the pond, Germany’s inflation is expected to slow down, which could reinforce the thesis that the ECB might keep rates unchanged.
EUR/USD Technical Levels
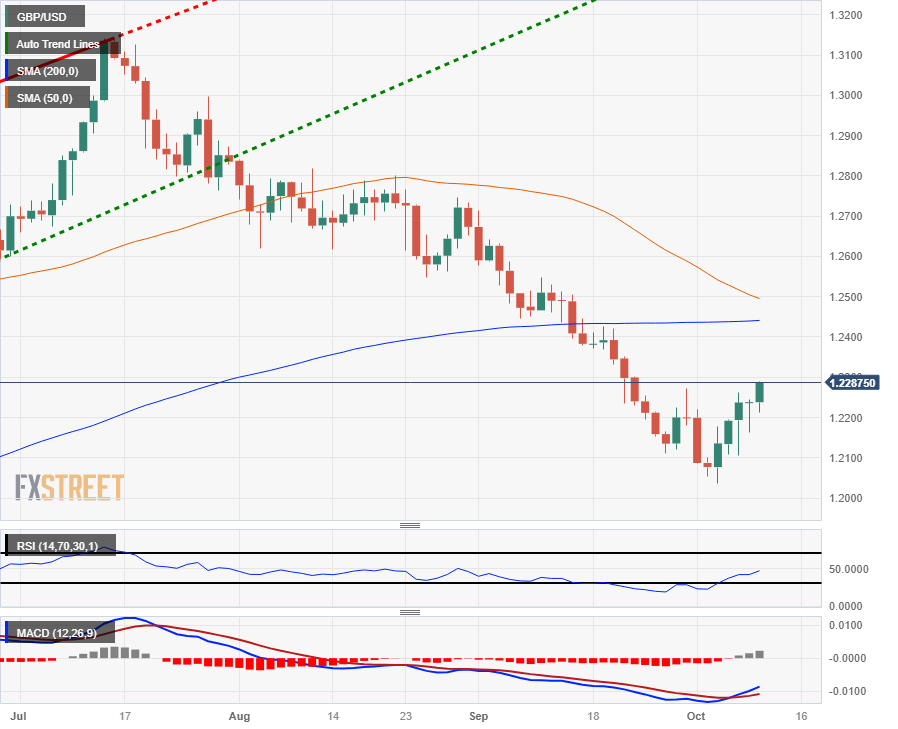
- GBP/USD catches a bid on improving market sentiment, setting a new two-week high.
- UK GDP, manufacturing & production figures due later in the week, BoE Gov Bailey to speak on Friday.
- US inflation data remains a key focus for broader markets, PPI and CPI in the barrel for Wednesday, Thursday.
The GBP/USD is trading higher on Tuesday as market sentiment cautiously recovers following the weekend's Israel-Hamas conflict escalation, and the Pound Sterling (GBP) is catching a bid into fresh two-week highs just shy of 1.2300.
It's a bumper week for US inflation data, with Producer Price Index (PPI) and Consumer Price Index (CPI) figures due tomorrow and Thursday respectively, but the Pound Sterling is also represented on the calendar, with Gross Domestic Product (GDP) and Industrial & Manufacturing Production numbers in the barrel for Thursday.
Federal Reserve (Fed) officials have been hitting the newswires for Tuesday, talking down the potential for further rate hikes, keeping the US Dollar (USD) on the low side and giving risk assets a chance to recover some ground.
Read More:
Fed's Bostic: We don't need to increase rates any more
NY Fed's Perli: No sign yet Fed needs to change balance sheet plans
UK GDP figures on Thursday are expected to show a mild recovery, with the monthly figure for August forecast to print at 0.2%, against the previous -0.5%.
Industrial & Manufacturing Production for the same period is expected to improve but still show minor declines, with the industrial component expected at -0.2% versus the previous -0.7%, and the manufacturing component is seen printing at -0.4% versus the previous -0.8%.
NY Fed: Year-ahead expected inflation edges higher to 3.7% from 3.6% in August
GBP/USD Technical Outlook
The Pound Sterling is set to close in the green for the fifth straight day against the US Dollar, having climbed over 2% from the last low at 1.2037, and the GBP/USD pair is set to take another run at climbing back over the 200-day Simple Moving Average (SMA) near 1.2441, though the 50-day SMA is moving bearish rapidly, declining into 1.2495 and set for a bearish cross of the longer moving average.
GBP/USD Daily Chart
GBP/USD Technical Levels
- USD/JPY experiences restrained gains, hindered by a notable drop in US Treasury bond yields.
- Dovish undertones from Fed officials contrast with potential BoJ policy normalization, creating crosscurrents.
- Anticipated inflation data and BoJ’s upcoming meeting poised to further dictate pair’s trajectory.
USD/JPY prints minimal gains on Tuesday after beginning the week on a lower note, weighed by the fall in US Treasury bond yields, which, continued but a risk-on impulse, is a headwind for the Japanese Yen (JPY), therefore the US Dollar (USD) remains bid. The major is trading at around 148.57 after hitting a daily low of 148.16.
Yen on the defensive amidst Wall Street gains, while dipping US Treasury yields cap USD/JPY upside
Wall Street is trading with solid gains, hence a headwind for safe-haven assets, mainly the Yen, which remains on the defensive as the Bank of Japan (BoJ) is set to extend its ultra-loose policy. Nevertheless, the USD/JPY rally was capped by the US Treasury bond yields plunge as the 10-year benchmark note sits at 4.632%, dropping 17 basis points since Monday.
the main driver in US bond yields has been dovish comments by US Federal Reserve (Fed) officials. Dallas Fed President Lorie Logan said that higher US bond yields “may mean there is less need to raise Fed rates further.” Echoing her comments was the new Fed Vice-Chair Philip Jefferson, saying he would “remain cognizant of the tightening in financial conditions through higher bond yields.” Since then, US bond yields have continued its downward direction, and inflation data to be revealed late in the week, could refrain officials from adopting a dovish stance.
Recently, Atlanta’s Fed President Raphael Bostic said inflation has improved considerably, adding, "I actually don't think we need to increase rates anymore.”
Meanwhile, the latest New York Fed poll showed that consumers expect inflation year from now to stay at 3.7%, exceeding August’s 3.6%, while for a three-year, they see prices at 3%, from the prior month’s 2.8%. Other data showed the US small business sentiment declining moderately blamed on high prices and labor shortages, the poll revealed.
On the Japanese front, the Bank of Japan (BoJ) is expected to raise tis 2023 core inflation forecasts to around 3%, at the upcoming meeting in October 30 and 31. The BoJ would also update their projections for 2024 and 2025, which if upward revised, could open the door towards policy normalization.
USD/JPY Price Analysis: Technical outlook
The daily chart portrays the pair as neutral-biased but slightly tilted to the downside, capped by the October 6 high at around 149.53, the latest cycle high, before reaching the 150.00 mark. For a bearish continuation, the pair must drop below the Kijun-Sen at 148.03, followed by the October 3 swing low of 147.27. Once those levels are cleared, the USD/JPY could test the 146.00 mark. Conversely, if buyers would like to regain control, they need to claim 149.00, so they could challenge 150.00.
- The Canadian Dollar is treading water after an extended weekend.
- Crude Oil is seeing thin action for Tuesday, sapping momentum from the Loonie.
- The broad-market focus remains on Gaza Strip geopolitics.
The Canadian Dollar (CAD) is trading flat against the US Dollar (USD) through the Tuesday market session, with only minor moves on the top and bottom ends. The pair set an early-day low of 1.3569 before rebounding to 1.3617, and the USD/CAD is now bouncing around the middle, testing below 1.3580.
Canada's economic data remains thin for the trading week’s release schedule, leaving the CAD exposed to US Dollar flows and broader investor sentiment.
Market focus remains firmly planted on the ongoing Gaza Strip escalation following Israel’s ongoing response to Hamas rocket attacks over the weekend. Investors are keeping an eye out for any geopolitical spillover from the Israel-Hamas conflict spreading to nearby Middle East countries.
Daily Digest Market Movers: Canadian Dollar sees little momentum for Tuesday
- CAD flat for Tuesday as investors wait for headlines.
- Crude Oil is trading softly back, keeping the Loonie constrained.
- Broad-market sentiment is recovering cautiously from the weekend’s geopolitical escalation.
- USD/CAD traders will be looking ahead to Wednesday Producer Price Index (PPI) figures for the US; expected to show a slight increase year-on-year from 2.2% to 2.3%.
- Inflation remains a key focus for markets as investors hope for signs that the US Federal Reserve (Fed) will get pushed to making rate cuts sooner.
- Thursday brings US Consumer Price Index (CPI) numbers, markets looking for a month-on-month decline from 0.6% to 0.3%.
- Crude Oil’s price jump on-reaction to Gaza Strip conflict is unlikely to spark long-term moves.
- Oil market suppliers are struggling to meet global demand, but a massive overhang in refined gasoline reserves is pressuring prices back down.
Technical Analysis: Canadian Dollar seeing minor gains, USD/CAD slipping from 1.36
The USD/CAD pair is testing lower but still firmly planted between Tuesday’s top and bottom, though a minor uptick for the Canadian Dollar is seeing the pair shed pips from the 1.3600 level.
The Greenback-Loonie pairing tumbled below the 200-hour Simple Moving Average (SMA) near 1.3640 in Monday’s trading, and the pair is struggling to develop a rebound.
Daily candlesticks see the USD/CAD declining for three straight days, down nearly 1.5% from the last high of 1.3785, and a continued decline will set the pair for a challenge of the 50-day SMA near 1.3536.
Canadian Dollar FAQs
What key factors drive the Canadian Dollar?
The key factors driving the Canadian Dollar (CAD) are the level of interest rates set by the Bank of Canada (BoC), the price of Oil, Canada’s largest export, the health of its economy, inflation and the Trade Balance, which is the difference between the value of Canada’s exports versus its imports. Other factors include market sentiment – whether investors are taking on more risky assets (risk-on) or seeking safe-havens (risk-off) – with risk-on being CAD-positive. As its largest trading partner, the health of the US economy is also a key factor influencing the Canadian Dollar.
How do the decisions of the Bank of Canada impact the Canadian Dollar?
The Bank of Canada (BoC) has a significant influence on the Canadian Dollar by setting the level of interest rates that banks can lend to one another. This influences the level of interest rates for everyone. The main goal of the BoC is to maintain inflation at 1-3% by adjusting interest rates up or down. Relatively higher interest rates tend to be positive for the CAD. The Bank of Canada can also use quantitative easing and tightening to influence credit conditions, with the former CAD-negative and the latter CAD-positive.
How does the price of Oil impact the Canadian Dollar?
The price of Oil is a key factor impacting the value of the Canadian Dollar. Petroleum is Canada’s biggest export, so Oil price tends to have an immediate impact on the CAD value. Generally, if Oil price rises CAD also goes up, as aggregate demand for the currency increases. The opposite is the case if the price of Oil falls. Higher Oil prices also tend to result in a greater likelihood of a positive Trade Balance, which is also supportive of the CAD.
How does inflation data impact the value of the Canadian Dollar?
While inflation had always traditionally been thought of as a negative factor for a currency since it lowers the value of money, the opposite has actually been the case in modern times with the relaxation of cross-border capital controls. Higher inflation tends to lead central banks to put up interest rates which attracts more capital inflows from global investors seeking a lucrative place to keep their money. This increases demand for the local currency, which in Canada’s case is the Canadian Dollar.
How does economic data influence the value of the Canadian Dollar?
Macroeconomic data releases gauge the health of the economy and can have an impact on the Canadian Dollar. Indicators such as GDP, Manufacturing and Services PMIs, employment, and consumer sentiment surveys can all influence the direction of the CAD. A strong economy is good for the Canadian Dollar. Not only does it attract more foreign investment but it may encourage the Bank of Canada to put up interest rates, leading to a stronger currency. If economic data is weak, however, the CAD is likely to fall.
- Mexican Peso gathers momentum, breaks below 18.00 on overall US Dollar weakness.
- Mexico's prices continue to deflate, though the Bank of Mexico is likely to maintain rates at 11.25% for year-end.
- USD/MXN has fallen to a new three-day low at around 17.97, bolstered by a risk-on impulse.
Mexican Peso (MXN) rallies for the third consecutive trading day against the US Dollar (USD) as risk appetite is back on the financial markets, while the sudden plunge in US Treasury bond yields takes its toll on the Greenback (USD). US Federal Reserve (Fed) officials adopted a neutral stance, mentioning that high US bond yields on the long-term of the curve “may mean there is less need to raise Fed rates further,” according to Dallas Fed President Lorie Logan. Therefore, the USD/MXN is exchanging hands at around 17.98 after hitting a multi-month high at around 18.49.
The latest economic data in Mexico showed that inflation is decelerating, approaching the Bank of Mexico (Banxico) 3% plus or minus 1% target. Even though the data might suggest the Mexican central bank could shift its approach toward easing its monetary policy, officials expressed their desire to keep rates higher for longer. Aside from this, reports suggesting that China might consider a new round of stimulus sparked a risk-on impulse, as seen by the USD/MXN pair diving beneath the 18.00 figure.
Daily Digest Market Movers: Mexican Peso could test the 18.00 figure on sentiment improvement
- Atlanta’s Fed President Raphael Bostic: “We don’t need to increase rates anymore.”
- The US 10-year Treasury bond yield has dropped to a new six day low of 4.632%, a headwind for the USD/MXN.
- Wall Street is trading with solid gains of between 0.70% and 1.17%, portraying the improvement in risk appetite.
- Mexico's auto parts industry is expected to register a $412 million hit to production by Friday, spurred by the United Auto Workers (UAW) union strike in the US.
- Mexico’s Consumer Price Index (CPI) grew by 4.45% YoY in September, below the 4.47% of estimates.
- The core CPI inflation in Mexico stood stickier at 5.76% YoY, as widely estimated, but has broken below the 6% threshold.
- A Citi Banamex poll showed economists estimate headline inflation at 4.70% and core at 5.09% for the year’s end.
- Analysts polled by Citi Banamex foresee the USD/MXN to end 2023 at 17.80, up from 17.60, and for 2024 at 18.86, up from 18.70 two weeks ago.
- Banxico’s September poll amongst economists reported that interest rates are expected to remain at 11.25% while inflation would dip to 4.66%.
- The same poll shows the USD/MXN exchange rate is set to finish at around 17.64, down from 17.75.
- The Bank of Mexico (Banxico) held rates at 11.25% in September and revised its inflation projections from 3.5% to 3.87% for 2024, above the central bank’s 3% target (plus or minus 1%).
- Banxico’s Government Board highlighted Mexico’s economic resilience and the strong labor market as the main drivers to keep inflation at the current interest rate level.
Technical Analysis: Mexican Peso strengthens, USD/MXN at the brink of dropping below 18.00
Mexican Peso has regained its composure, with the USD/MXN pair gaining downward traction toward the 18.00 figure due to overall US Dollar weakness. Even if the USD/MXN drops below 18.00, sellers must claim key support levels on the way down to regain control and retest the September 30 low of 17.34. First, the 200-day Simple Moving Average (SMA) at 17.78, followed by the 20-day SMA at 17.54. Conversely, if USD/MXN buyers manage to keep the exchange rate above 18.00, that could pave the way to re-test October’s high of 18.48 before challenging 18.50.
Mexican Peso FAQs
What key factors drive the Mexican Peso?
The Mexican Peso (MXN) is the most traded currency among its Latin American peers. Its value is broadly determined by the performance of the Mexican economy, the country’s central bank’s policy, the amount of foreign investment in the country and even the levels of remittances sent by Mexicans who live abroad, particularly in the United States. Geopolitical trends can also move MXN: for example, the process of nearshoring – or the decision by some firms to relocate manufacturing capacity and supply chains closer to their home countries – is also seen as a catalyst for the Mexican currency as the country is considered a key manufacturing hub in the American continent. Another catalyst for MXN is Oil prices as Mexico is a key exporter of the commodity.
How do decisions of the Banxico impact the Mexican Peso?
The main objective of Mexico’s central bank, also known as Banxico, is to maintain inflation at low and stable levels (at or close to its target of 3%, the midpoint in a tolerance band of between 2% and 4%). To this end, the bank sets an appropriate level of interest rates. When inflation is too high, Banxico will attempt to tame it by raising interest rates, making it more expensive for households and businesses to borrow money, thus cooling demand and the overall economy. Higher interest rates are generally positive for the Mexican Peso (MXN) as they lead to higher yields, making the country a more attractive place for investors. On the contrary, lower interest rates tend to weaken MXN.
How does economic data influence the value of the Mexican Peso?
Macroeconomic data releases are key to assess the state of the economy and can have an impact on the Mexican Peso (MXN) valuation. A strong Mexican economy, based on high economic growth, low unemployment and high confidence is good for MXN. Not only does it attract more foreign investment but it may encourage the Bank of Mexico (Banxico) to increase interest rates, particularly if this strength comes together with elevated inflation. However, if economic data is weak, MXN is likely to depreciate.
How does broader risk sentiment impact the Mexican Peso?
As an emerging-market currency, the Mexican Peso (MXN) tends to strive during risk-on periods, or when investors perceive that broader market risks are low and thus are eager to engage with investments that carry a higher risk. Conversely, MXN tends to weaken at times of market turbulence or economic uncertainty as investors tend to sell higher-risk assets and flee to the more-stable safe havens.
The Federal Reserve Bank of New York's latest Survey of Consumer Expectations showed on Tuesday that the US consumers' one-year inflation expectation edged higher to 3.7% in September from 3.6% in August.
Key takeaways
"Three-year ahead expected inflation 3% vs. August’s 2.8%."
"Five-year ahead expected inflation 2.8% vs. August’s 3%."
"Median expected home price rise at 3% vs. August’s 3.1%."
"Expected college cost rise drops by record amount for survey."
"Credit access perceptions weakened in September."
"Consumers' view on financial situation ebbed slightly in September."
"Consumers predicted steady spending growth of 5.3% in September."
Market reaction
The US Dollar stays under modest bearish pressure following this publication. As of writing, the US Dollar Index was down 0.22% on the day at 105.82.
Analysts at TD Securities share their expectations for the upcoming September Consumer Price Index (CPI) data from the US.
Headline CPI to slow to 3.2% y/y in Q4 of 2023
"Our forecasts for the September CPI report suggest core price inflation stayed largely unchanged vs last month's 0.28% m/m gain. Indeed, we expect the series to print another “soft” 0.3% m/m increase."
"We also look for a 0.3% gain for the headline, as retail gasoline prices eased post August surge. Importantly, the report is likely to show that the core goods segment stayed modestly deflationary, while shelter-price gains probably slowed. Note that our unrounded core CPI inflation forecast is 0.26%, so we see a clear bias for a downside surprise to 0.2% m/m."
"Looking ahead: We now look for headline CPI to slow to 3.2% y/y in 23Q4, after closing 2022 at a booming 7.1% y/y pace. For core CPI, we also project deceleration to a still strong 3.9% y/y in 23Q4 from 6.0% in 22Q4."
- USD/CAD drops sharply to near 1.3600 as oil price strengthens and the US Dollar corrects sharply.
- Participation of other Middle East countries in the conflict could dampen the market mood.
- Monthly US headline and core inflation are seen expanding 0.3%
The USD/CAD pair corrected sharply to near 1.3600 in the early New York session. The Loonie asset faces selling pressure amid further downside in the US Dollar and expectations of more upside in the oil price due to the deepening Israel-Hamas conflict.
S&P500 opens on a moderately positive note amid improved market mood. The risk theme remains cheerful as investors are observing how things will develop in the Middle East. However, the participation of other Middle East countries in the conflict could dampen the market mood.
The US Dollar Index (DXY) corrects to near 106.00 as Federal Reserve (Fed) policymakers supported for keeping interest rates steady ahead. Fed policymakers believe that multi-year high Treasury yields are consistently putting pressure on inflation and the central bank needs to be very careful with further policy-tightening.
Going forward, investors will focus on the United States Consumer Price Index (CPI) data for September, which will be published on Thursday. As per the estimates, monthly headline and core inflation are seen expanding by 0.3%. The annual headline and core CPI are seen softening marginally to 3.6% and 4.1% respectively.
Rising oil prices are strengthening the Canadian Dollar. Escalating tensions in the Middle East are expected to keep oil prices upbeat. IMF chief economist Pierre Gourinchas said on Tuesday, that the “IMF research indicates a 10% increase in Oil prices would weigh down on global output by about 0.2% in the following year, boost global inflation by about 0.4%.”
Atlanta Federal Reserve President Raphael Bostic said on Tuesday that the policy rate is sufficiently restrictive to get to the 2% inflation target, per Reuters.
Key quotes
"Impact of war in Israel on the economy is uncertainty."
"Inflation has improved considerably."
"Still a long way to go to get to inflation target."
"There's certainly more for us to do."
"I don't have a recession in my dot plot."
"I think our policy rate is sufficiently restrictive to get inflation to 2%."
"A lot of our policy impact is clearly yet to come."
"If things come in differently from my outlook we might have to increase rates, but that's not my current outlook."
"We don't need to increase rates any more."
"We are in process of finding a new equilibrium on rates."
Market reaction
The US Dollar Index edged slightly lower following these comments and was last seen losing 0.15% on the day at 105.90.
- AUD/USD faces selling pressure above 0.6400 as IMF warned decline in global output due to Middle East tensions.
- The USD Index drifted lower swiftly to near 106.00 as Fed policymakers supported keeping interest rates steady.
- AUD/USD trades in a Rising channel in which each pullback is considered as a buying opportunity.
The AUD/USD pair remained offered above the round-level resistance of 0.6400 in the early New York session. The Aussie asset struggles to extend recovery as the International Monetary Fund (IMF) warned that rising oil prices due to deepening Middle East tensions could dampen global Gross Domestic Product (GDP) and rebound inflation.
The expectations of one more interest rate increase from the Reserve Bank of Australia (RBA) have increased due to rising inflation expectations, supported by higher oil prices.
Meanwhile, the US Dollar Index (DXY) drifted lower swiftly to near 106.00 as Federal Reserve (Fed) policymakers supported keeping interest rates steady at 5.25-5.50% in the November monetary policy meeting.
Going forward, investors will focus on the US inflation data, which will be published on Thursday. The monthly headline and core inflation are seen growing by 0.3% in September.
AUD/USD trades in a Rising channel chart pattern on an hourly scale in which each pullback is considered as a buying opportunity by the market participants. The 50-period Exponential Moving Average (EMA) at 0.6388 is considered as a buying opportunity by the market participants.
The Relative Strength Index (RSI) (14) skids into the 40.00-60.00 range, which indicates a consolidation ahead.
A fresh downside would appear if the Aussie asset dropped below October 03 low around 0.6286. This would expose the asset to 21 October 2022 low at 0.6212, followed by 13 October 2022 low at 0.6170.
In an alternate scenario, a decisive break above August 15 high around 0.6522 will drive the asset to August 9 high at 0.6571. Breach of the latter will drive the asset towards August 10 high at 0.6616.
AUD/USD four-hour chart
-638325422864688000.png)
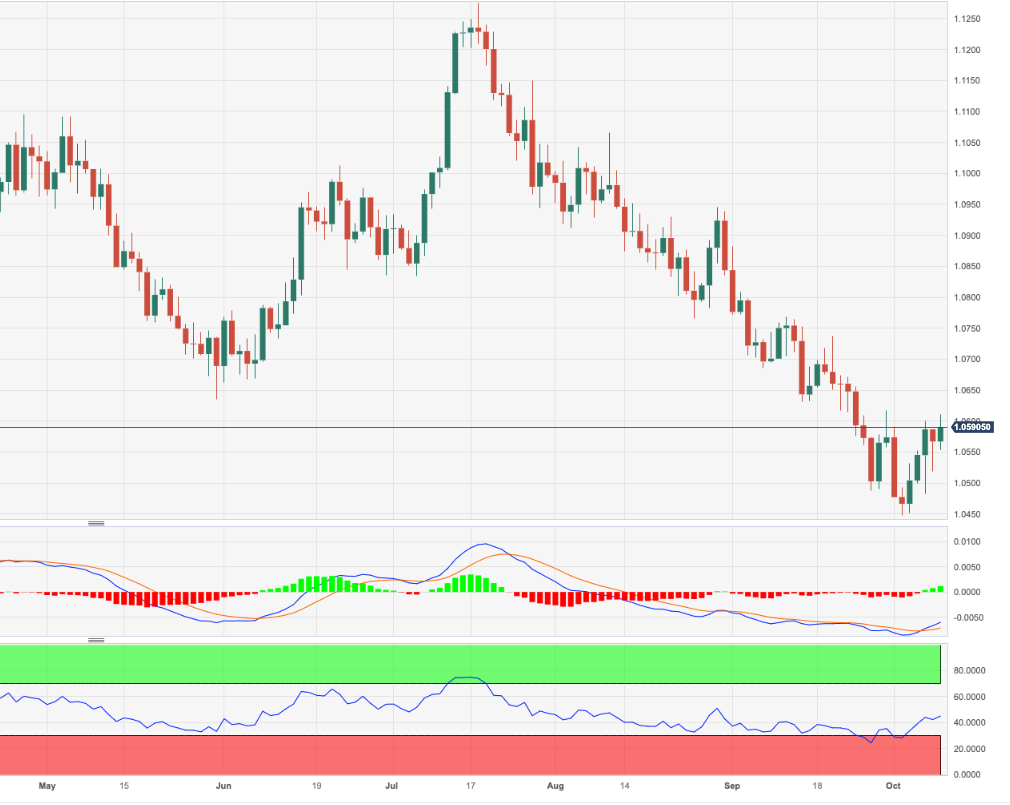
- EUR/USD revisits the area above 1.0600 once again on Tuesday.
- The continuation of the rebound should target the 1.0620 area.
EUR/USD regains composure following Monday’s pessimism and breaks above the 1.0600 hurdle.
In case bulls regain the initiative, the pair should initially retarget the minor barrier at 1.0617 (September 29) ahead of the weekly peak of 1.0767 (September 12). On the flip side, if bears regain the upper hand, the pair could slip back to the area of yearly lows around 1.0450 (October 3).
Meanwhile, further losses remain on the table as long as the pair navigates the area below the key 200-day SMA, today at 1.0823.
EUR/USD daily chart
- DXY extends the bearish move to the 105.80 zone on Tuesday.
- Further losses could put a test of 105.65 back on the radar.
DXY remains under pressure and puts the 106.00 region to the test on Tuesday.
In case bears push harder, then index could then slip back to the 105.65 level (September 29). Further weakness from here could see the weekly low of 104.42 (September 11) revisited.
In the meantime, while above the key 200-day SMA, today at 103.17, the outlook for the index is expected to remain constructive.
DXY daily chart
The Federal Reserve (Fed) remains in strong control of short-term rates and there are no signs that the Fed needs to change its balance sheet plans, Roberto Perli, the New York Fed’s head of monetary policy implementation, said on Tuesday, per Reuters.
Key quotes
"Unclear when reserves will grow scarce."
"All signs suggest reserves remain abundant."
"Money market rates will signal when reserves growing scarce."
"Fed can still do repos to add liquidity if needed."
"Confident Fed can effectively stop balance sheet drawdown smoothly."
"Standing repo, conventional repos can address stress quickly."
"Federal funds rate remains influential in money markets."
"Fed rate control tools working well amid recent challenges."
"Reverse repo facility works well, responsive to market conditions."
Market reaction
These comments failed to trigger a noticeable market reaction. As of writing, the US Dollar Index was down 0.06% on the day at 106.00.
- Silver price trades sideways below $22.00 as Middle East tensions improve appeal for safe-haven assets.
- The US Dollar remains under pressure as Fed policymakers support keeping interest rates steady.
- Silver price turns sideways in a range of $21.40-22.00 after an upside move.
Silver price (XAG/USD) trades sideways below $22.00 and seems gathering strength for a fresh upside as Middle East tensions have improved appeal for the safe-haven assets. The white metal is well expected to move higher as the US Dollar Index (DXY) is struggling for a firm footing after neutral interest rate guidance from Federal Reserve (Fed) policymakers.
S&P500 futures added some gains in the European session, portraying an improvement in the risk appetite of the market participants. The USD Index faces pressure due to improved market mood. The broader risk theme is still downbeat due to fears of stretch in the Israel-Hamas conflict beyond Gaza.
The US Dollar remains under pressure as Dallas Fed Bank President Lorie Logan and Vice Chair Philip Jefferson supported keeping interest rates steady due to rising Treasury yields, which have already ramped up borrowing rates.
Meanwhile, investors turned worried about the global economic outlook as higher oil prices could add to inflationary pressures ahead. IMF chief economist Pierre Gourinchas said on Tuesday, that the “IMF research indicates a 10% increase in Oil prices would weigh down on global output by about 0.2% in the following year, boost global inflation by about 0.4%.”
Silver technical analysis
Silver price turns sideways in a range of $21.40-22.00 after an upside move. The precious metal got strengthened after a breakout of the consolidation formed in a range of $20.70-21.40. The 50-period Exponential Moving Average (EMA) at $21.66 is acting as a support for the Silver price bulls.
The Relative Strength Index (RSI) (14) shifts into the 40.00-60.00 range, which signifies a rangebound performance ahead.
Silver hourly chart
-638325378686625206.png)
- EUR/JPY fades Monday’s drop and climbs to the 158.00 region.
- Further side-lined trade appears favoured so far.
EUR/JPY sets aside Monday’s small pullback and resumes the upside to the boundaries of the 158.00 zone on Tuesday.
In the meantime, the cross remains stuck within the consolidative range and the breakout of it exposes a visit to the so far monthly high of 158.65 (September 13) prior to the 2023 top at 159.76 (August 30), which precedes the key round level at 160.00.
On the downside, the so far monthly low of 154.34 (October 3) emerges as the initial contention in case of bearish attempts.
So far, the longer term positive outlook for the cross appears favoured while above the 200-day SMA, today at 150.00.
EUR/JPY daily chart
- The Greenback cannot bank on the risk of flight from Monday.
- Fed’s Logan and Jefferson delivered a message that the Fed is done hiking.
- The US Dollar Index breaks below 106 but faces selling pressure.
The US Dollar (USD) is seeing its gains from Monday being erased as the flight to safety eased quite quickly. Markets were quite quick to assess the situation in Israel and Gaza. For a minute, markets were bracing for a possible spillover in the region to the bigger oil-producing countries, though it was until late Monday evening when Saudi Crown Prince Mohammad bin Salman issued a statement urging both parties to come to the table and discuss opinions instead of reverting to violence.
The US markets need to catch up a bit with events as several US markets were closed on Monday for the public holiday. On Monday, both Dallas Federal Reserve (Fed) President Lorie Logan and Fed Governor Philip Jefferson said that interest rates have reached the end of their hiking path. Meanwhile, the US bond markets sees prices peaking and yields dropping in a catch-up move from Monday’s reduced schedule.
Daily digest: US Dollar facing some pressure
- At 10:00 GMT on Tuesday the National Federation of Independent Business’ (NFIB) Business Optimism Index for September was released. Previous number was 91.3, with the current number a touch lower near 90.8.
- Near 12:55 GMT, the YoY Redbook Index is due to come out. Expectations are for an unchanged print at -0.1%. Fed’s Minneapolis director Neel Kashkari is due to speak near 19:00 GMT. Mary Daly from the San Francisco Fed is due to speak near 22:00 GMT.
- The US Treasury is heading to the markets to refund some tenures. A 3-month and a 6-month bill are due to be issued together with a 3-year note auction.
- Christopher J. Waller from the Fed’s Board of Governors is expected to speak at 17:30 GMT.
- Equities are in the green as risk in the Middle East region looks to be contained for now. Asian equities soar over 2% with Japanese indices leading the charge. European equities are up over 1%. Meanwhile, US equity futures are rather reluctant and stick to rather flat quotations.
- The CME Group FedWatch Tool shows that markets are pricing in an 87.5% chance that the Federal Reserve will keep interest rates unchanged at its meeting in November.