- Аналітика
- Новини та інструменти
- Новини ринків
Новини ринків
- EUR/USD shed 0.25% and fell back into the 1.0300 handle on Wednesday.
- Despite the midweek downside push, Fiber is holding above two year lows for now.
- EU Retail Sales, German Industrial Production, and US Challenger Job Cuts on the docket.
EUR/USD fell back once again on Wednesday, dipping back into the 1.0300 handle as Fiber traders weigh mixed EU data while sitting in the shadow of Friday’s looming US Nonfarm Payrolls (NFP) jobs data dump.
European data broadly recovered early Wednesday, with German Retail Sales and pan-European Producer Price Index (PPI) figures both rising from previous prints, but most data printed with below-average caveats, especially EU PPI inflation which remains in contraction territory. Euro traders will be hoping for an upside swing in pan-EU Retail Sales figures for the year ended in December, due early Thursday, but not until after German Industrial Production figures kick off the European trading session.
A raft of speeches from Federal Reserve (Fed) policymakers await traders on Thursday, as well as Challenger Job Cuts for December, which will serve as the last punch of NFP preview data before the bumper labor print on Friday.
ADP Employment Change in December showed slower hiring at 122K compared to 140K expected and 146K in November. Wage data is at its slowest since mid-2021.
The Federal Reserve's latest Meeting Minutes indicated greater concern over President Trump's tariff plans than initially thought. Despite earlier reassurances from Fed speakers about immigration and trade policies' minimal impact, the minutes highlighted four discussion points on major US policy changes affecting central banking. Additionally, the Fed agreed it was time to slow rate cuts, stressing that policy uncertainty is driving expectations for fewer cuts in 2025 than previously anticipated.
EUR/USD price forecast
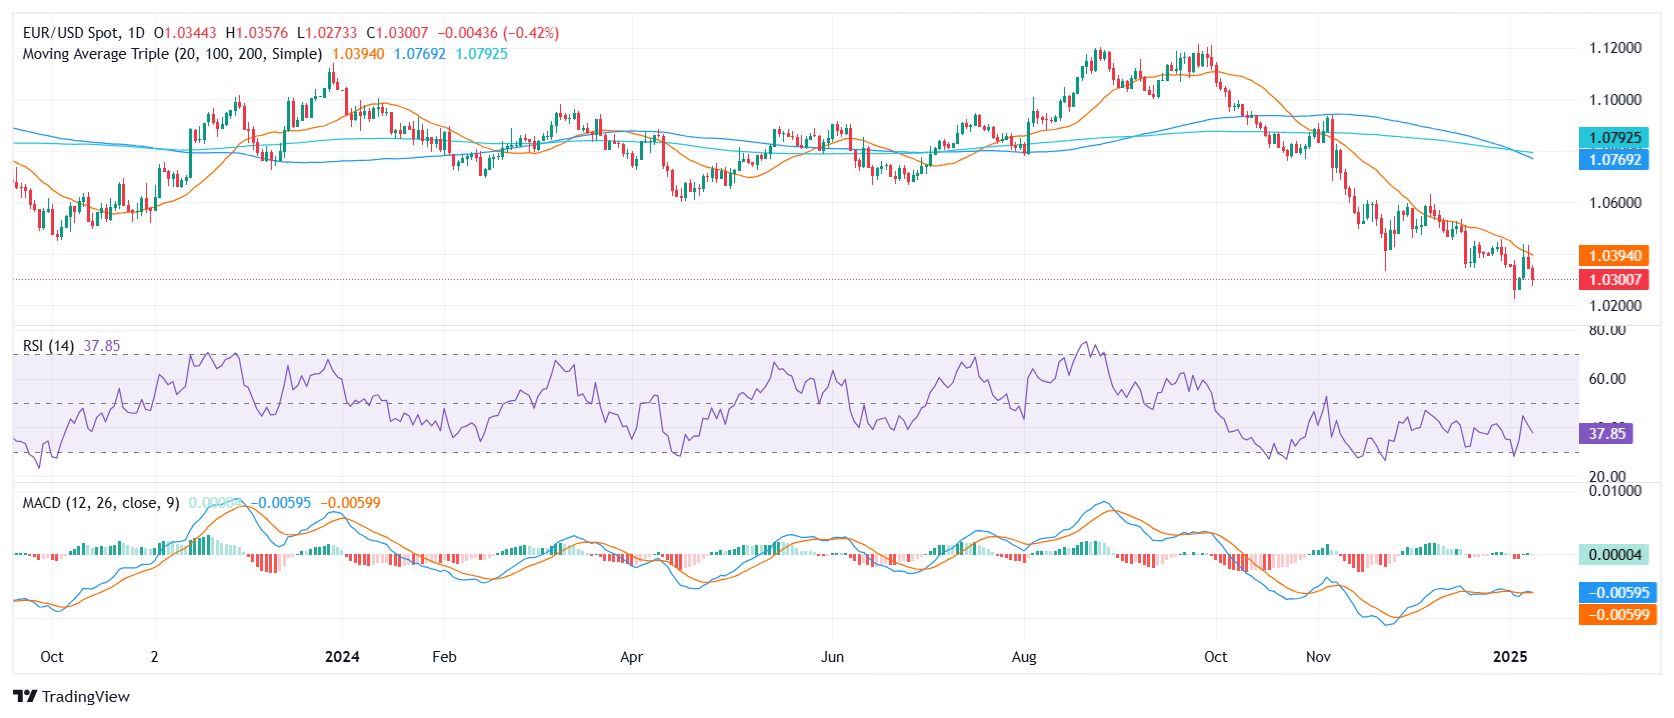
EUR/USD near-term battle with the 1.0300 handle leaves Fiber traders pushed firmly onto the backfoot as bidders struggle to keep price action north of multi-year lows. The pair has slumped consistently since kicking off a bearish trend near the end of September. EUR/USD fell 8.82% top-to-bottom, knocking into 26-month lows in the process.
A bullish turnaround is on the cards with bids testing into arguably oversold territory, but Euro bulls will need to first contend with the 50-day Exponential Moving Average (EMA), which is grinding down into the 1.0500 handle.
EUR/USD daily chart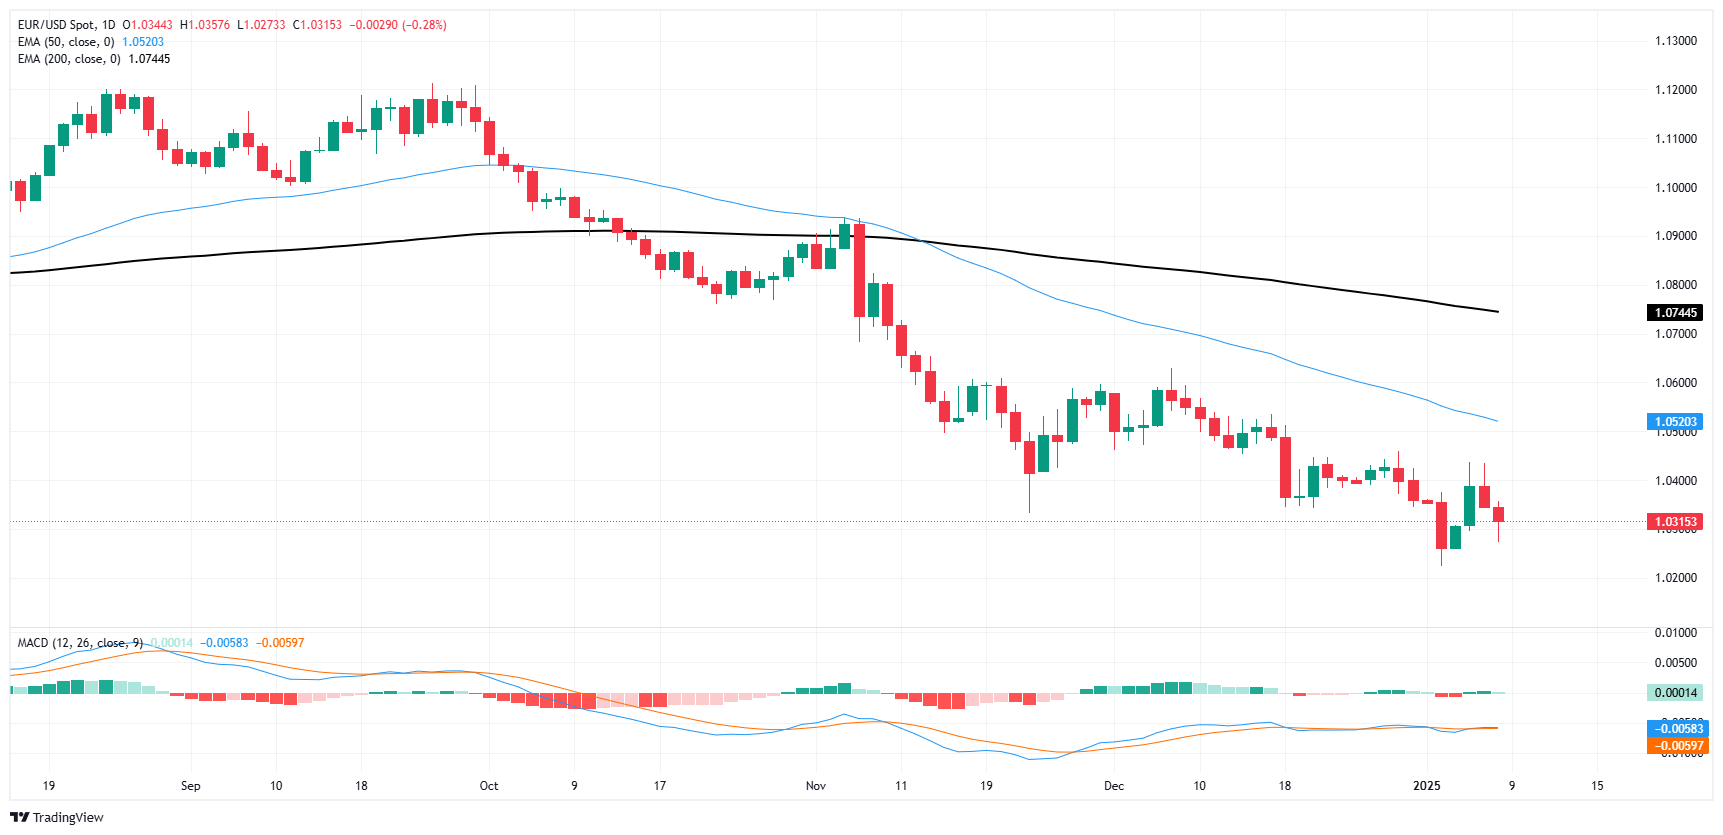
Euro FAQs
The Euro is the currency for the 19 European Union countries that belong to the Eurozone. It is the second most heavily traded currency in the world behind the US Dollar. In 2022, it accounted for 31% of all foreign exchange transactions, with an average daily turnover of over $2.2 trillion a day. EUR/USD is the most heavily traded currency pair in the world, accounting for an estimated 30% off all transactions, followed by EUR/JPY (4%), EUR/GBP (3%) and EUR/AUD (2%).
The European Central Bank (ECB) in Frankfurt, Germany, is the reserve bank for the Eurozone. The ECB sets interest rates and manages monetary policy. The ECB’s primary mandate is to maintain price stability, which means either controlling inflation or stimulating growth. Its primary tool is the raising or lowering of interest rates. Relatively high interest rates – or the expectation of higher rates – will usually benefit the Euro and vice versa. The ECB Governing Council makes monetary policy decisions at meetings held eight times a year. Decisions are made by heads of the Eurozone national banks and six permanent members, including the President of the ECB, Christine Lagarde.
Eurozone inflation data, measured by the Harmonized Index of Consumer Prices (HICP), is an important econometric for the Euro. If inflation rises more than expected, especially if above the ECB’s 2% target, it obliges the ECB to raise interest rates to bring it back under control. Relatively high interest rates compared to its counterparts will usually benefit the Euro, as it makes the region more attractive as a place for global investors to park their money.
Data releases gauge the health of the economy and can impact on the Euro. Indicators such as GDP, Manufacturing and Services PMIs, employment, and consumer sentiment surveys can all influence the direction of the single currency. A strong economy is good for the Euro. Not only does it attract more foreign investment but it may encourage the ECB to put up interest rates, which will directly strengthen the Euro. Otherwise, if economic data is weak, the Euro is likely to fall. Economic data for the four largest economies in the euro area (Germany, France, Italy and Spain) are especially significant, as they account for 75% of the Eurozone’s economy.
Another significant data release for the Euro is the Trade Balance. This indicator measures the difference between what a country earns from its exports and what it spends on imports over a given period. If a country produces highly sought after exports then its currency will gain in value purely from the extra demand created from foreign buyers seeking to purchase these goods. Therefore, a positive net Trade Balance strengthens a currency and vice versa for a negative balance.
- NZD/USD edges lower to near 0.5610 in Thursday’s early Asian session.
- Fed officials said they will slow the pace of rate cuts due to the uncertainty, minutes of the meeting showed Wednesday.
- Chinese December CPI inflation data will be released on Thursday.
The NZD/USD pair trades with mild losses to around 0.5610 during the early Asian session on Thursday. The expectation of a slower rate cut by the Federal Reserve (Fed) continues to underpin the US Dollar (USD) broadly.
Minutes released on Wednesday showed that Fed policymakers expressed concern about inflation and the impact that President-elect Donald Trump’s policies could have. Fed officials indicated they would be moving more slowly on rate reductions because of the uncertainty.
Fed officials pencilled the expected cuts in 2025 to two from four in the previous estimate at September’s meeting. A more hawkish stance of the US central bank and the signal that it would slow the pace of rate cuts in 2025 provide some support to the Greenback and act as the headwind for NZD/USD.
Investors await the Chinese December Consumer Price Index (CPI) inflation data, which is due later on Thursday. Several Fed officials are scheduled to speak later in the day. On Friday, the US Nonfarm Payrolls (NFP) for December will be in the spotlight.
On Tuesday, the National Development and Reform Commission (NDRC), China's top economic planner, issued a guideline for building a unified national market, breaking down market barriers to boost domestic demand while enhancing openness. The fresh supportive measures from China could boost the Kiwi, as China is a major trading partner for New Zealand.
New Zealand Dollar FAQs
The New Zealand Dollar (NZD), also known as the Kiwi, is a well-known traded currency among investors. Its value is broadly determined by the health of the New Zealand economy and the country’s central bank policy. Still, there are some unique particularities that also can make NZD move. The performance of the Chinese economy tends to move the Kiwi because China is New Zealand’s biggest trading partner. Bad news for the Chinese economy likely means less New Zealand exports to the country, hitting the economy and thus its currency. Another factor moving NZD is dairy prices as the dairy industry is New Zealand’s main export. High dairy prices boost export income, contributing positively to the economy and thus to the NZD.
The Reserve Bank of New Zealand (RBNZ) aims to achieve and maintain an inflation rate between 1% and 3% over the medium term, with a focus to keep it near the 2% mid-point. To this end, the bank sets an appropriate level of interest rates. When inflation is too high, the RBNZ will increase interest rates to cool the economy, but the move will also make bond yields higher, increasing investors’ appeal to invest in the country and thus boosting NZD. On the contrary, lower interest rates tend to weaken NZD. The so-called rate differential, or how rates in New Zealand are or are expected to be compared to the ones set by the US Federal Reserve, can also play a key role in moving the NZD/USD pair.
Macroeconomic data releases in New Zealand are key to assess the state of the economy and can impact the New Zealand Dollar’s (NZD) valuation. A strong economy, based on high economic growth, low unemployment and high confidence is good for NZD. High economic growth attracts foreign investment and may encourage the Reserve Bank of New Zealand to increase interest rates, if this economic strength comes together with elevated inflation. Conversely, if economic data is weak, NZD is likely to depreciate.
The New Zealand Dollar (NZD) tends to strengthen during risk-on periods, or when investors perceive that broader market risks are low and are optimistic about growth. This tends to lead to a more favorable outlook for commodities and so-called ‘commodity currencies’ such as the Kiwi. Conversely, NZD tends to weaken at times of market turbulence or economic uncertainty as investors tend to sell higher-risk assets and flee to the more-stable safe havens.
- GBP/USD shed over 0.9% on Wednesday as market sentiment droops.
- A thin data schedule on the UK side leaves Cable traders to face looming NFP figures.
- The Fed may be more concerned about government policy than previously believed.
GBP/USD sank nearly a full percent on Wednesday, falling away from the 1.2500 handle which is proving too difficult for Pound Sterling bidders to reclaim. The pair tested below 1.2350 briefly, and Cable is poised for a further dip into multi-month lows.
Meaningful economic data is absent on the UK side, a running theme for the first full trading week of 2025. Cable traders will remain exposed to broad-market flows into and out of the US Dollar as traders gear up for a hectic end to the week. A raft of speeches from Federal Reserve (Fed) policymakers await traders on Thursday, as well as Challenger Job Cuts for December, which will serve as the last punch of Nonfarm Payrolls (NFP) preview data before the bumper labor print on Friday.
On Wednesday, the ADP Employment Change report indicated a slower hiring rate than anticipated for December, with a total of 122K jobs added compared to the expected 140K and November’s 146K. Additionally, ADP wage data showed its slowest growth since mid-2021.
In the same day, the Federal Reserve's latest Meeting Minutes disclosed that policymakers might be more apprehensive about President Donald Trump's proposed tariffs than previously thought. Over the past few weeks, Fed officials had downplayed the possible effects of immigration and trade policies on their decisions, but the recent policy meeting included four discussions about significant shifts in U.S. policy that could profoundly affect central banking. Furthermore, the Fed reached a consensus that it was time to reduce the speed of rate cuts, underscoring that policy uncertainty plays a crucial role in their lowered expectations for fewer rate reductions in 2025 than the market had earlier anticipated.
GBP/USD price forecast
GBP/USD briefly tested a new nine-month low at 1.2321 on Wednesday before a half-hearted upswing later in the day, pushing the pair back above 1.2350. January trading just started, but Cable is already on pace to close in the red for a fourth consecutive month. A technical floor is priced in at the 1.2300 price level thanks to a sharp drop and turnaround at the key level back in April.
GBP/USD daily chart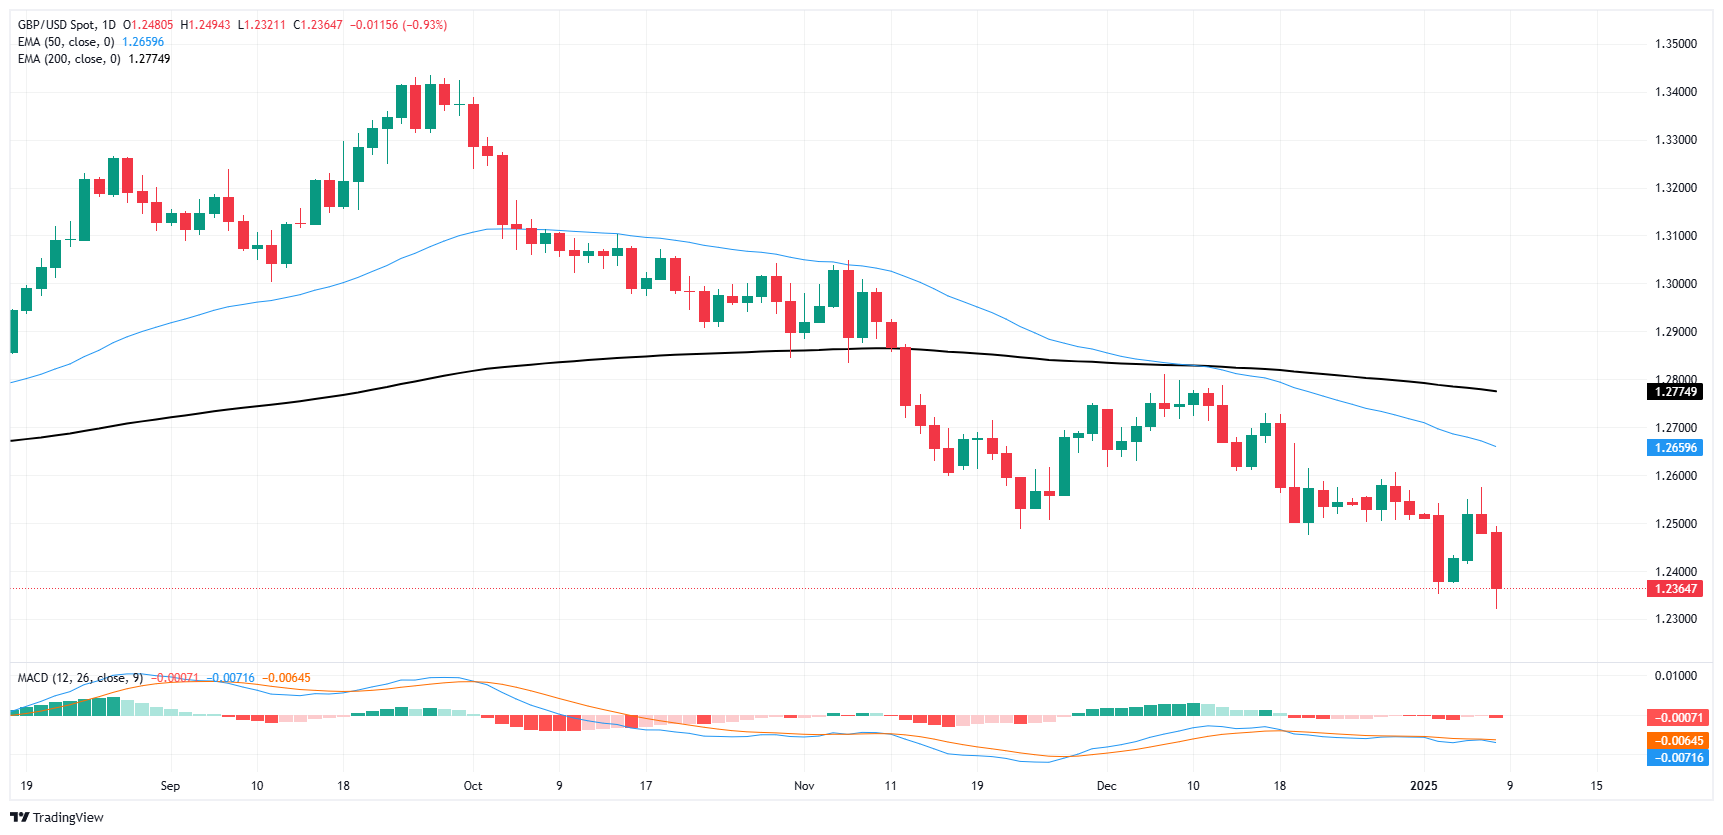
Pound Sterling FAQs
The Pound Sterling (GBP) is the oldest currency in the world (886 AD) and the official currency of the United Kingdom. It is the fourth most traded unit for foreign exchange (FX) in the world, accounting for 12% of all transactions, averaging $630 billion a day, according to 2022 data. Its key trading pairs are GBP/USD, also known as ‘Cable’, which accounts for 11% of FX, GBP/JPY, or the ‘Dragon’ as it is known by traders (3%), and EUR/GBP (2%). The Pound Sterling is issued by the Bank of England (BoE).
The single most important factor influencing the value of the Pound Sterling is monetary policy decided by the Bank of England. The BoE bases its decisions on whether it has achieved its primary goal of “price stability” – a steady inflation rate of around 2%. Its primary tool for achieving this is the adjustment of interest rates. When inflation is too high, the BoE will try to rein it in by raising interest rates, making it more expensive for people and businesses to access credit. This is generally positive for GBP, as higher interest rates make the UK a more attractive place for global investors to park their money. When inflation falls too low it is a sign economic growth is slowing. In this scenario, the BoE will consider lowering interest rates to cheapen credit so businesses will borrow more to invest in growth-generating projects.
Data releases gauge the health of the economy and can impact the value of the Pound Sterling. Indicators such as GDP, Manufacturing and Services PMIs, and employment can all influence the direction of the GBP. A strong economy is good for Sterling. Not only does it attract more foreign investment but it may encourage the BoE to put up interest rates, which will directly strengthen GBP. Otherwise, if economic data is weak, the Pound Sterling is likely to fall.
Another significant data release for the Pound Sterling is the Trade Balance. This indicator measures the difference between what a country earns from its exports and what it spends on imports over a given period. If a country produces highly sought-after exports, its currency will benefit purely from the extra demand created from foreign buyers seeking to purchase these goods. Therefore, a positive net Trade Balance strengthens a currency and vice versa for a negative balance.
- NZD/JPY slips on Wednesday, hovering around 88.75 after failing to overcome a mid-week ceiling.
- RSI dips to 53 in positive territory, signaling a sudden loss of bullish momentum.
- MACD histogram shows flat green bars, hinting that the recent upside may be running out of steam.
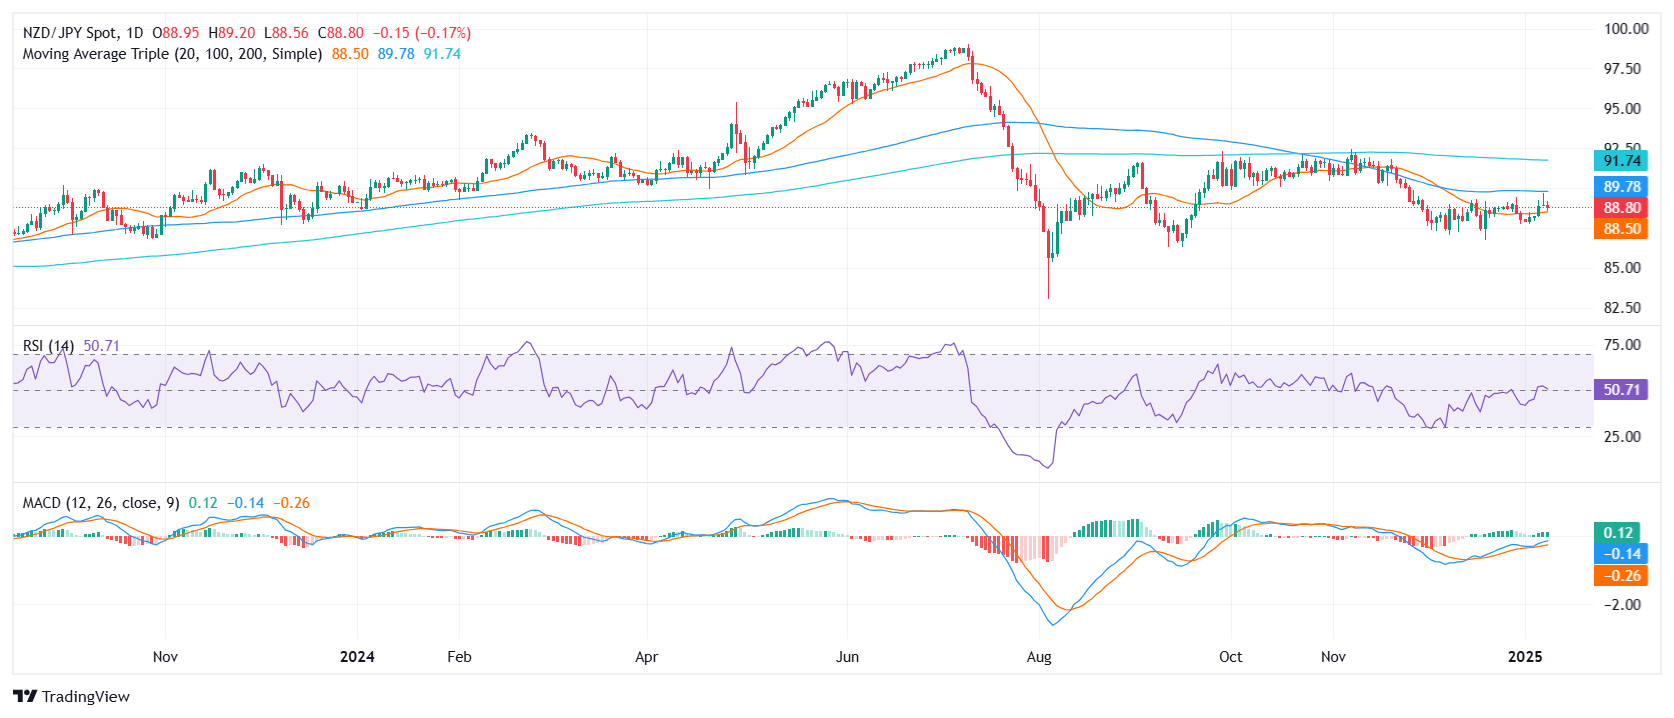
NZD/JPY retreated on Wednesday, declining by 0.33% to settle near 88.75. Earlier attempts to break above the 100-day Simple Moving Average (SMA) near 90.00 faltered, curbing the pair’s recent rebound. The Relative Strength Index (RSI) has pulled back to 53, indicating fading buying interest, while the Moving Average Convergence Divergence (MACD) histogram remains flat, suggesting limited follow-through on the upside push.
Should the bulls continue to struggle at the 100-day SMA, the pair may face additional downside pressure. Immediate support levels could appear around 88.50, with a deeper drop targeting 88.00 if selling accelerates. Conversely, a clean break above the 100-day SMA might reignite bullish momentum, paving the way toward the 89.50 zone before encountering potential psychological resistance at 90.00.
NZD/JPY daily chart
- USD/JPY ascends to 158.34, supported by hawkish hints in Fed's December minutes and positive US employment figures.
- Technical indicators suggest potential resistance at 159.00, with a pivotal target of 160.00 in sight, under watch for possible Japanese intervention.
- Downside risks remain, with immediate support at the Tenkan-Sen line of 157.28, followed by December’s low at 156.02.
The USD/JPY edged higher late in the North American session after the Federal Reserve revealed its December meeting minutes. This, along with US jobs data and risk aversion, keeps the Greenback underpinned throughout the day. The pair trades at 158.34, up 0.19%.
USD/JPY Price Forecast: Technical outlook
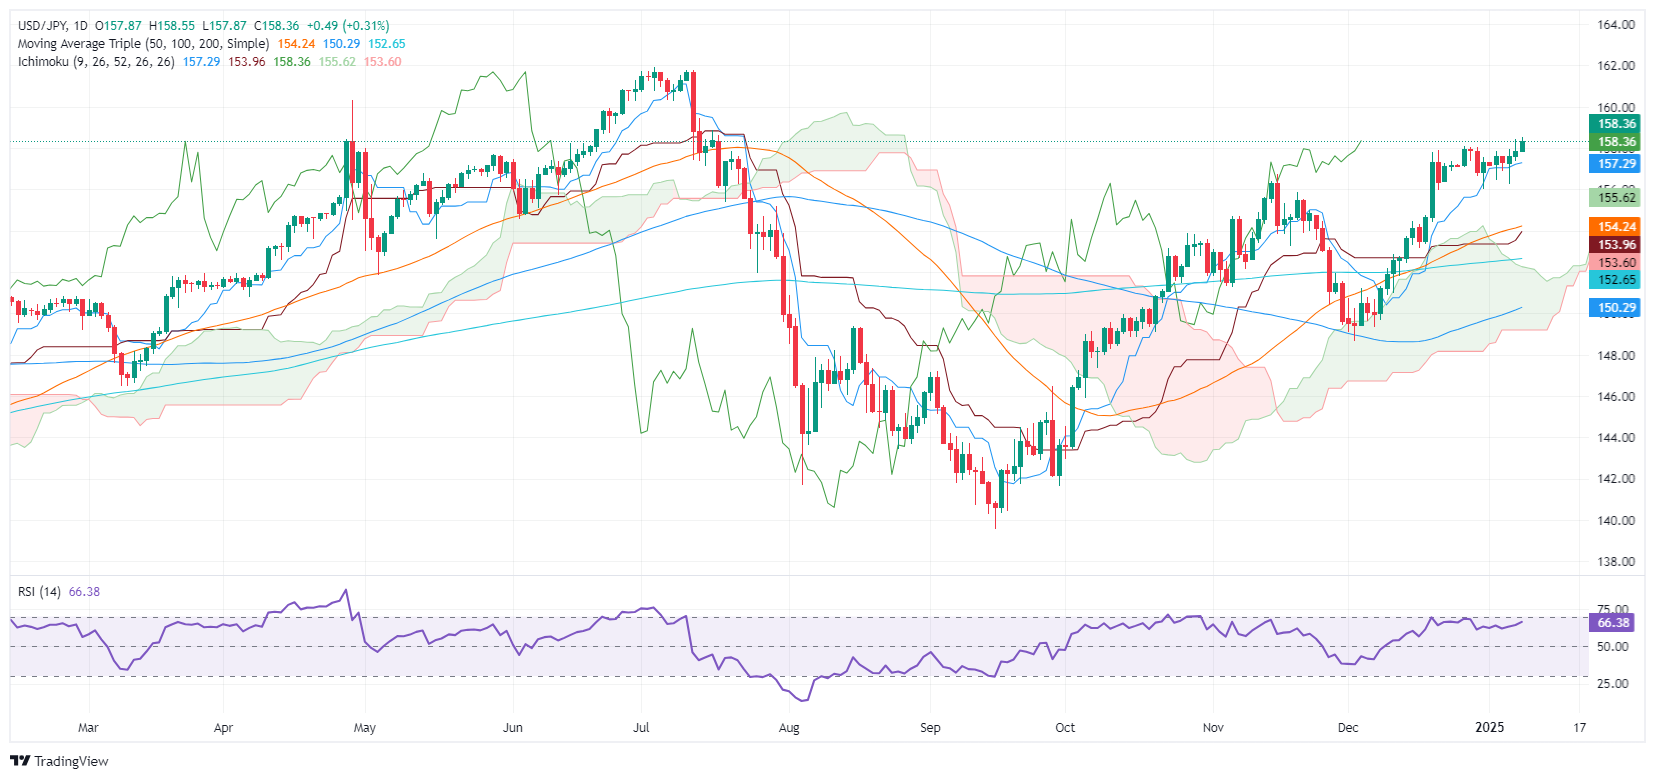
The USD/JPY has risen above December’s high before the US Nonfarm Payrolls report, opening the door to challenge the 160.00 figure. Due to being close to the latter, Japanese authorities would likely begin their intervention jawboning to halt the Greenback’s advance.
That said, the USD/JPY first key resistance would be 159.00. Once cleared, the next stop would be 160.00 ahead of testing last year’s peak at 161.95.
Conversely, if sellers moved in and kept the USD/JPY from rising above 159.00, the first support would be the Tenkan-Sen at 157.28. A breach of the latter will expose the December 31 swing low of 156.02.
USD/JPY Price Chart – Daily
Japanese Yen FAQs
The Japanese Yen (JPY) is one of the world’s most traded currencies. Its value is broadly determined by the performance of the Japanese economy, but more specifically by the Bank of Japan’s policy, the differential between Japanese and US bond yields, or risk sentiment among traders, among other factors.
One of the Bank of Japan’s mandates is currency control, so its moves are key for the Yen. The BoJ has directly intervened in currency markets sometimes, generally to lower the value of the Yen, although it refrains from doing it often due to political concerns of its main trading partners. The BoJ ultra-loose monetary policy between 2013 and 2024 caused the Yen to depreciate against its main currency peers due to an increasing policy divergence between the Bank of Japan and other main central banks. More recently, the gradually unwinding of this ultra-loose policy has given some support to the Yen.
Over the last decade, the BoJ’s stance of sticking to ultra-loose monetary policy has led to a widening policy divergence with other central banks, particularly with the US Federal Reserve. This supported a widening of the differential between the 10-year US and Japanese bonds, which favored the US Dollar against the Japanese Yen. The BoJ decision in 2024 to gradually abandon the ultra-loose policy, coupled with interest-rate cuts in other major central banks, is narrowing this differential.
The Japanese Yen is often seen as a safe-haven investment. This means that in times of market stress, investors are more likely to put their money in the Japanese currency due to its supposed reliability and stability. Turbulent times are likely to strengthen the Yen’s value against other currencies seen as more risky to invest in.
- AUD dips 0.36% to 0.6215 on Wednesday.
- Wall Street trims Trump-inspired losses, aiding brief Aussie rebound.
- Australian Retail Sales, Trade figures eyed in Asian session.
- FOMC Minutes confirm gradual approach to 2025 rate cuts.
The Australian Dollar declined by 0.36% to 0.6215 on Wednesday despite Wall Street reversing some earlier risk-off moves tied to President-elect Donald Trump’s tariff threats. Although the Aussie drew marginal support from the late US equity bounce, it remains vulnerable ahead of key November Retail Sales and External Trade data due in the Asian session. Traders look for fresh catalysts after the Federal Open Market Committee (FOMC) Meeting Minutes and local inflation data failed to offer much optimism.
Daily digest market movers: Aussie weakens after US labor market data, local inflation data
- The Australian Dollar shed over 0.40% at one point versus the USD, pressured by Trump’s potential emergency tariff move and strong labor market data.
- On the US data front, US Initial Jobless Claims dropped from 211K to 201K, below forecasts of 218K, underscoring a strong labor market.
- ADP data showed 122K private jobs added in December, missing the 140K forecast, as hiring and pay gains slowed.
- On the local front, Australian Weighted CPI for November rose 2.3% YoY, slightly above estimates, but the trimmed mean dipped from 3.5% to 3.2%.
- FOMC Meeting Minutes indicated a cautious approach to further rate cuts and highlighted inflation risks from trade policy.
- Traders turn to Aussie Retail Sales and Trade Balance data, due Thursday, for additional insight into domestic economic momentum.
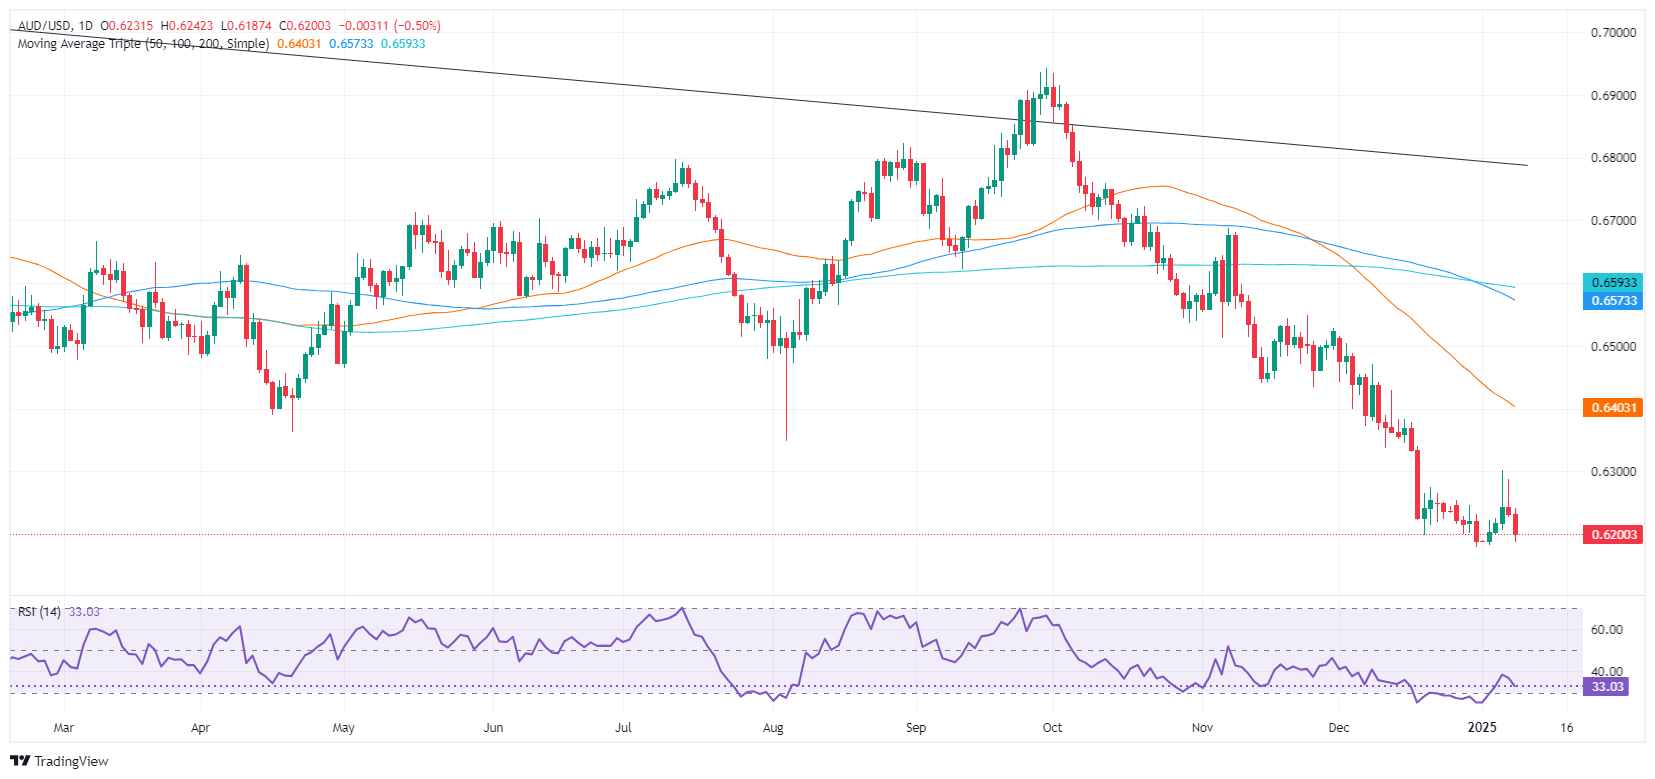
AUD/USD technical outlook: Aussie falters at 20-day SMA amid fading momentum
The Relative Strength Index (RSI) stands at 35, drifting lower in negative territory, while the Moving Average Convergence Divergence (MACD) histogram prints decreasing green bars. The pair faced resistance at its 20-day Simple Moving Average (SMA), losing traction as risk sentiment deteriorated.
Without a clear catalyst, downside risks may persist if tariff fears escalate and US economic data remain supportive of the US Dollar.
Australian Dollar FAQs
One of the most significant factors for the Australian Dollar (AUD) is the level of interest rates set by the Reserve Bank of Australia (RBA). Because Australia is a resource-rich country another key driver is the price of its biggest export, Iron Ore. The health of the Chinese economy, its largest trading partner, is a factor, as well as inflation in Australia, its growth rate and Trade Balance. Market sentiment – whether investors are taking on more risky assets (risk-on) or seeking safe-havens (risk-off) – is also a factor, with risk-on positive for AUD.
The Reserve Bank of Australia (RBA) influences the Australian Dollar (AUD) by setting the level of interest rates that Australian banks can lend to each other. This influences the level of interest rates in the economy as a whole. The main goal of the RBA is to maintain a stable inflation rate of 2-3% by adjusting interest rates up or down. Relatively high interest rates compared to other major central banks support the AUD, and the opposite for relatively low. The RBA can also use quantitative easing and tightening to influence credit conditions, with the former AUD-negative and the latter AUD-positive.
China is Australia’s largest trading partner so the health of the Chinese economy is a major influence on the value of the Australian Dollar (AUD). When the Chinese economy is doing well it purchases more raw materials, goods and services from Australia, lifting demand for the AUD, and pushing up its value. The opposite is the case when the Chinese economy is not growing as fast as expected. Positive or negative surprises in Chinese growth data, therefore, often have a direct impact on the Australian Dollar and its pairs.
Iron Ore is Australia’s largest export, accounting for $118 billion a year according to data from 2021, with China as its primary destination. The price of Iron Ore, therefore, can be a driver of the Australian Dollar. Generally, if the price of Iron Ore rises, AUD also goes up, as aggregate demand for the currency increases. The opposite is the case if the price of Iron Ore falls. Higher Iron Ore prices also tend to result in a greater likelihood of a positive Trade Balance for Australia, which is also positive of the AUD.
The Trade Balance, which is the difference between what a country earns from its exports versus what it pays for its imports, is another factor that can influence the value of the Australian Dollar. If Australia produces highly sought after exports, then its currency will gain in value purely from the surplus demand created from foreign buyers seeking to purchase its exports versus what it spends to purchase imports. Therefore, a positive net Trade Balance strengthens the AUD, with the opposite effect if the Trade Balance is negative.
- Gold climbs following Fed minutes hinted at a potential slowdown in the rate easing cycle.
- US Dollar Index maintains gains, while US Treasury yields show a slight pullback from recent highs.
- Gold market watchers eye US Nonfarm Payrolls report and UoM Consumer Sentiment data.
Gold price climbed during the North American session after the United States (US) Federal Reserve (Fed) struck a neutral to slightly hawkish tone in last December meeting minutes, hinting that it “would be appropriate to slow pace of easing.” At the time of writing, XAU/USD trades at $2,659, up by 0.34%.
During the December meeting, officials decided to lower borrowing costs by 25 basis points. However, “some participants said there was merit in keeping rates unchanged at that meeting, citing the higher risk of persistently elevated inflation.” Following the minutes’ release, XAU/USD edged towards $2,658 before paring some of those gains.
The US Dollar Index (DXY), which measures the Greenback’s performance against a basket of six currencies, holds to earlier gains of 0.33% at 109.04. The US 10-year benchmark note coupon retraced after hitting 4.73% to 4.699%, up by three basis points (bps).
Earlier, market participants shifted wary of a CNN article revealing that US President-elect Donald Trump might consider a national economic emergency declaration, allowing him to impose tariffs on adversaries and allies.
Bullion buyers ignored mixed US jobs reports, as private companies hired fewer people than expected. However, the US Department of Labor revealed that Americans' applications for jobless benefits were reduced compared to the previous week and came below forecasts.
Fed Governor Christopher Waller crossed the wires and said that tariffs would not cause persistent inflation, which would continue to fall towards the Fed’s 2% goal. Waller added that he favors further rate cuts, which would be data-dependent.
In the meantime, Gold traders are eyeing Friday's release of the US Nonfarm Payroll report and the University of Michigan (UoM) Consumer Sentiment. If both readings come stronger than expected, the XAU/USD might edge lower on broad US Dollar strength.
Daily digest market movers: Gold price climbs amid high US yields, ignore US data
- Gold shrugs off higher US real yields, rising three bps to 2.31%.
- Initial Jobless Claims in the US dropped to 201K for the week ending January 3, down from 211K and well below the forecast of 218K, according to the Department of Labor.
- ADP reported that private sector hiring totaled 122K in December, falling short of the 140K expected by economists.
- Market expectations indicate the Federal Reserve may implement two rate cuts in 2025, with the December Fed funds futures contract pricing in 54 basis points of easing.
- Gold surged to a two-day high of $2,664 following news that China’s central bank increased its reserves for the second consecutive month, adding 300K ounces to reach 73.3 million. The People's Bank of China (PBoC) resumed bullion purchases, which could keep XAU/USD prices skewed to the upside.
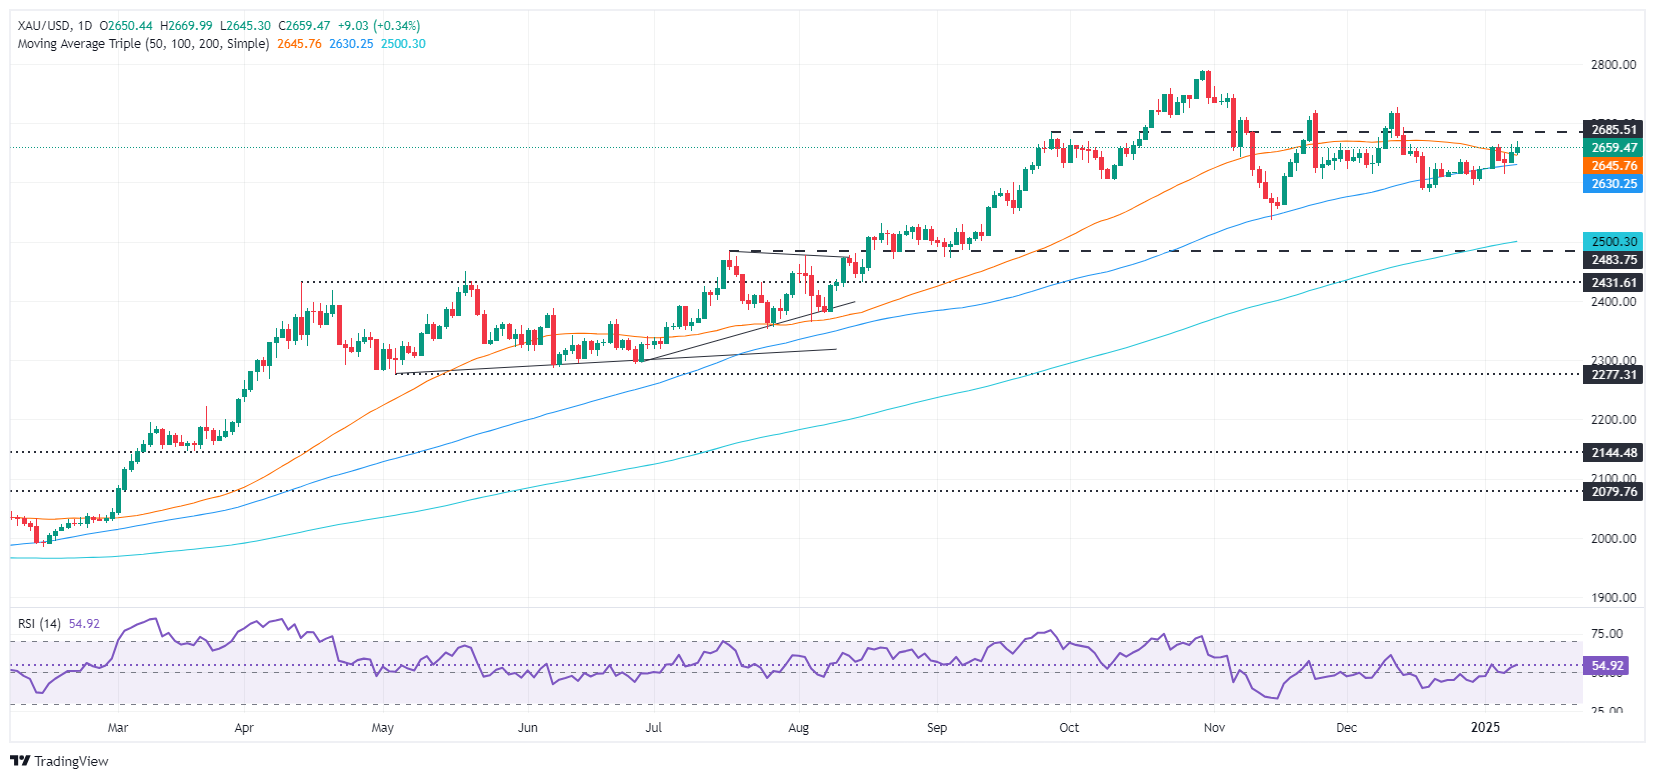
XAU/USD technical outlook: Gold price surges above $2,650
Gold price remains consolidated but slightly tilted to the upside after reclaiming the 50-day Simple Moving Average (SMA) at $2,648. If bulls push prices above $2,660, it will pave the way to challenge $2,700 before testing the December 12 peak at $2,726, ahead of the record high at $2,790.
On the flip side, if sellers drag the XAU/USD below the 100-day SMA of $2,628, look for a test of $2,500 before Gold extends its losses to the 200-day SMA at $2,498.
Gold FAQs
Gold has played a key role in human’s history as it has been widely used as a store of value and medium of exchange. Currently, apart from its shine and usage for jewelry, the precious metal is widely seen as a safe-haven asset, meaning that it is considered a good investment during turbulent times. Gold is also widely seen as a hedge against inflation and against depreciating currencies as it doesn’t rely on any specific issuer or government.
Central banks are the biggest Gold holders. In their aim to support their currencies in turbulent times, central banks tend to diversify their reserves and buy Gold to improve the perceived strength of the economy and the currency. High Gold reserves can be a source of trust for a country’s solvency. Central banks added 1,136 tonnes of Gold worth around $70 billion to their reserves in 2022, according to data from the World Gold Council. This is the highest yearly purchase since records began. Central banks from emerging economies such as China, India and Turkey are quickly increasing their Gold reserves.
Gold has an inverse correlation with the US Dollar and US Treasuries, which are both major reserve and safe-haven assets. When the Dollar depreciates, Gold tends to rise, enabling investors and central banks to diversify their assets in turbulent times. Gold is also inversely correlated with risk assets. A rally in the stock market tends to weaken Gold price, while sell-offs in riskier markets tend to favor the precious metal.
The price can move due to a wide range of factors. Geopolitical instability or fears of a deep recession can quickly make Gold price escalate due to its safe-haven status. As a yield-less asset, Gold tends to rise with lower interest rates, while higher cost of money usually weighs down on the yellow metal. Still, most moves depend on how the US Dollar (USD) behaves as the asset is priced in dollars (XAU/USD). A strong Dollar tends to keep the price of Gold controlled, whereas a weaker Dollar is likely to push Gold prices up.
Markets roiled on Wednesday but mostly stuck within tight ranges as investors gear up for a hectic release schedule ahead of Friday’s key US NFP jobs print.
Here’s what you need to know heading into Thursday, January 9:
The US Dollar Index (DXY) explored higher ground on Wednesday as tepid investor sentiment kept one foot solidly in the safe haven Greenback. However, traders are proving to be unwilling to tilt too far in either direction, stopping short of pushing the DXY into fresh 26-month highs. A raft of speeches from Federal Reserve (Fed) policymakers await traders on Thursday, as well as Challenger Job Cuts for December, which will serve as the last punch of Nonfarm Payrolls (NFP) preview data before the bumper labor print on Friday.
FOMC Minutes show officials weigh in potential changes to trade and immigration policies
EUR/USD is back testing the 1.0300 handle after flubbing a near-term bullish recovery. The pair is one bad day away from touching the 1.0200 level for the first time in over two years, and Euro traders will be hoping for an upside swing in pan-EU Retail Sales figures for the year ended in December, due early Thursday, but not until after German Industrial Production figures kick off the European trading session.
GBP/USD tested a fresh nine-month low on Wednesday, tapping 1.2320 as the UK side of the economic calendar remains thin and Cable traders struggle to find the buy button. One last bearish push into the low side will see GBP/USD crossing below 1.3200 and setting fresh 14-month lows.
AUD/USD traders have an unwieldy data schedule to contend with on Thursday. Australian Retail Sales figures for November are due early in the Antipodean session, which are expected to swing upwards, while Australia’s Trade Balance is expected to contract slightly. China will follow-up with its own data release, which could see knock-on impacts for the Aussie. Chinese Consumer Price Index (CPI) inflation for December is expected to cool to next to flat.
USD/JPY continues to grind its way higher as the Bank of Japan (BoJ) struggles to find a way to overcome the Yen’s wide interest rate differential that doesn’t involve raising interest rates. USD/JPY hit multi-decade highs last summer, and the BoJ’s efforts to directly intervene on the Yen’s behalf has turned out to be not only exorbitantly expensive, but also temporary. The pair is up almost 14% after reaching a technical bottom near 140.00 in September.
Fed FAQs
Monetary policy in the US is shaped by the Federal Reserve (Fed). The Fed has two mandates: to achieve price stability and foster full employment. Its primary tool to achieve these goals is by adjusting interest rates. When prices are rising too quickly and inflation is above the Fed’s 2% target, it raises interest rates, increasing borrowing costs throughout the economy. This results in a stronger US Dollar (USD) as it makes the US a more attractive place for international investors to park their money. When inflation falls below 2% or the Unemployment Rate is too high, the Fed may lower interest rates to encourage borrowing, which weighs on the Greenback.
The Federal Reserve (Fed) holds eight policy meetings a year, where the Federal Open Market Committee (FOMC) assesses economic conditions and makes monetary policy decisions. The FOMC is attended by twelve Fed officials – the seven members of the Board of Governors, the president of the Federal Reserve Bank of New York, and four of the remaining eleven regional Reserve Bank presidents, who serve one-year terms on a rotating basis.
In extreme situations, the Federal Reserve may resort to a policy named Quantitative Easing (QE). QE is the process by which the Fed substantially increases the flow of credit in a stuck financial system. It is a non-standard policy measure used during crises or when inflation is extremely low. It was the Fed’s weapon of choice during the Great Financial Crisis in 2008. It involves the Fed printing more Dollars and using them to buy high grade bonds from financial institutions. QE usually weakens the US Dollar.
Quantitative tightening (QT) is the reverse process of QE, whereby the Federal Reserve stops buying bonds from financial institutions and does not reinvest the principal from the bonds it holds maturing, to purchase new bonds. It is usually positive for the value of the US Dollar.
- The Canadian Dollar shed another 0.2% on Wednesday as the Loonie shrivels.
- Canada saw a data-light day on the calendar, market flows continue to tilt toward the Greenback.
- US jobs data cooled, keeping investor sentiment tepid.
The Canadian Dollar (CAD) shed another one-fifth of one percent on Wednesday as the Loonie continues to flub chances for a technical recovery from multi-year lows against the US Dollar. CAD flows remains subdued, and the Loonie is backsliding into near-term congestion against the Greenback.
Canada was largely absent from the economic data docket on Wednesday as markets broadly focus on US jobs data, with the ADP Employment Change for December easing more than expected in December and serving as a tepid preview of Friday’s upcoming US Nonfarm Payrolls (NFP) report.
Daily digest market movers: US jobs data bodes poorly for the Loonie as risk sentiment weighs
- A clear lack of Canadian economic data keeps market flows decidedly in the Greenback’s court.
- US ADP job gains shrank to 122K in December, below the expected 140K. Slowing US jobs growth could put a hamper on investor sentiment as signs of economic softening risk blowing past rate cutting territory directly into the recession zone.
- The Fed’s latest Meeting Minutes revealed Fed policymakers are pumping the brakes on further rate cuts due in no small part to incoming US President Donald Trump’s plans to unilaterally apply steep tariffs to all of the US’ main allies and trading partners in an effort to fund his scattershot government policy plans.
- In the face of a volatile new chapter in US-Canadian relations, Canadian Prime Minister Justin Trudeau has vacated his position, leaving Canadian parliament prorogued until the end of March as Canadian politicians select a new leader from the Canadian Liberal Party.
- Canadian employment and labor figures are due on Friday, but market reactions will be eclipsed by the US’ latest Nonfarm Payrolls (NFP) jobs data dump.
Canadian Dollar price forecast
The Canadian Dollar (CAD) continues to recede against the US Dollar as Loonie traders struggle to find reasons to hit the buy button. USD/CAD has been caught in rough sideways churn since the Loonie fell to multi-year lows against the Greenback in mid-December, bolstering the USD/CAD pair to its highest bids since the pandemic.
Despite a near-term freeze in momentum, the pair is still leaning firmly into bull country, though buyers are struggling to finish the journey to the 1.4500 handle. The 1.4400 level is proving to be the barrier to beat, and Loonie bidders could force the pair back down to the 50-day Exponential Moving Average (EMA) which is rising into 1.4200.
USD/CAD daily chart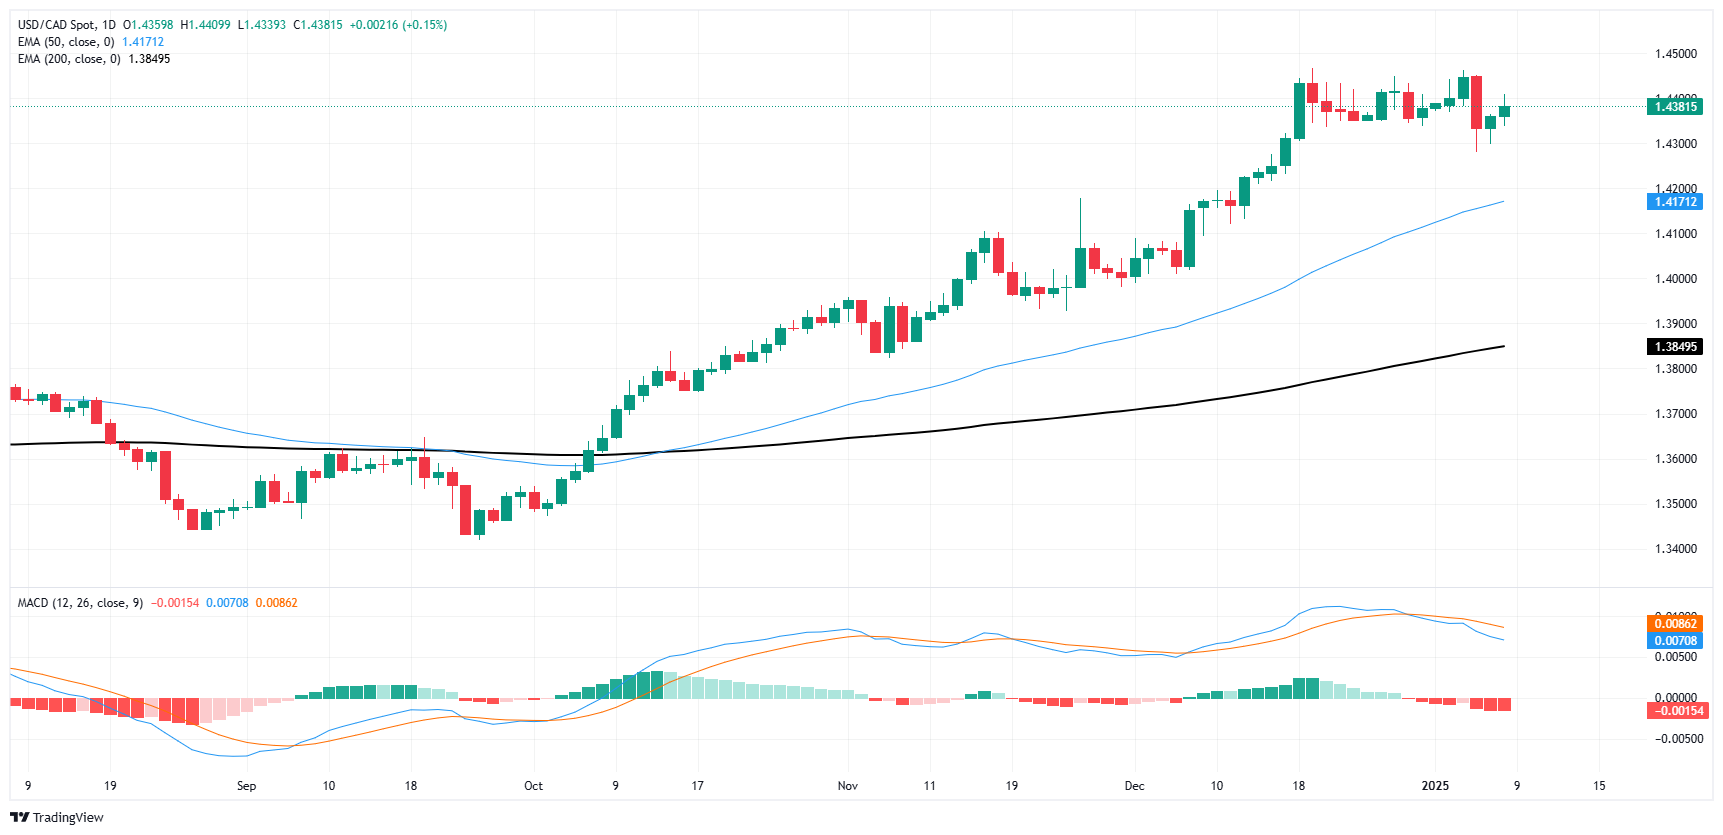
Canadian Dollar FAQs
The key factors driving the Canadian Dollar (CAD) are the level of interest rates set by the Bank of Canada (BoC), the price of Oil, Canada’s largest export, the health of its economy, inflation and the Trade Balance, which is the difference between the value of Canada’s exports versus its imports. Other factors include market sentiment – whether investors are taking on more risky assets (risk-on) or seeking safe-havens (risk-off) – with risk-on being CAD-positive. As its largest trading partner, the health of the US economy is also a key factor influencing the Canadian Dollar.
The Bank of Canada (BoC) has a significant influence on the Canadian Dollar by setting the level of interest rates that banks can lend to one another. This influences the level of interest rates for everyone. The main goal of the BoC is to maintain inflation at 1-3% by adjusting interest rates up or down. Relatively higher interest rates tend to be positive for the CAD. The Bank of Canada can also use quantitative easing and tightening to influence credit conditions, with the former CAD-negative and the latter CAD-positive.
The price of Oil is a key factor impacting the value of the Canadian Dollar. Petroleum is Canada’s biggest export, so Oil price tends to have an immediate impact on the CAD value. Generally, if Oil price rises CAD also goes up, as aggregate demand for the currency increases. The opposite is the case if the price of Oil falls. Higher Oil prices also tend to result in a greater likelihood of a positive Trade Balance, which is also supportive of the CAD.
While inflation had always traditionally been thought of as a negative factor for a currency since it lowers the value of money, the opposite has actually been the case in modern times with the relaxation of cross-border capital controls. Higher inflation tends to lead central banks to put up interest rates which attracts more capital inflows from global investors seeking a lucrative place to keep their money. This increases demand for the local currency, which in Canada’s case is the Canadian Dollar.
Macroeconomic data releases gauge the health of the economy and can have an impact on the Canadian Dollar. Indicators such as GDP, Manufacturing and Services PMIs, employment, and consumer sentiment surveys can all influence the direction of the CAD. A strong economy is good for the Canadian Dollar. Not only does it attract more foreign investment but it may encourage the Bank of Canada to put up interest rates, leading to a stronger currency. If economic data is weak, however, the CAD is likely to fall.
- The Federal Reserve’s hawkish monetary stance contributes to rising Treasury yields, reinforcing the US Dollar’s current strength.
- Rumors of a potential national economic emergency declaration bolster safe-haven demand and support the Greenback’s appeal.
- Encouraging labor market figures, including lower jobless claims and steady employment gains, further amplify bullish sentiment.
The US Dollar Index (DXY), which measures the value of the USD against a basket of currencies, gained towards 109.00 on Wednesday, mainly due to strong labor market figures. The Federal Reserve’s (Fed) hawkish shift still supports elevated United States (US) bond yields, favoring the USD bulls. Meanwhile, geopolitical risks and trade war concerns help maintain safe-haven flows, capping any Greenback’s pullback.
Daily digest market movers: US Dollar sees gains as markets assess fresh labor data
- US upcoming President Donald Trump may declare a national economic emergency to enact large-scale tariffs, spurring safe-haven bids for the US Dollar.
- Long-term US bond yields continue climbing on heavy supply; the 10-year hovers near 4.70%, while the 30-year approaches 4.93%.
- December’s Federal Open Market Committee (FOMC) minutes loom large after the Federal Reserve’s latest 25 basis point cut and pivot to a more hawkish stance, with some officials pushing for steady rates.
- Labor data shine: Weekly initial jobless claims fell to 201,000, beating the 218,000 consensus. Private sector employment rose by 122,000 in December, though below market expectations.
- Automatic Data Processing (ADP) notes a slowdown in hiring and pay gains, but health care leads job creation in the second half of 2024.
- Reports of strong US economic outperformance continue, delaying the market’s Fed cut expectations.
DXY technical outlook: Indicators maintain momentum above key support
The US Dollar Index defended its 20-day Simple Moving Average, confirming underlying bullish momentum. Technical indicators show continued upward traction, yet they are not near overbought territory, suggesting room for additional gains. Any dips may be shallow, with buyers emerging on safe-haven flows and robust yield appeal. Unless a significant shift in sentiment occurs, the DXY looks poised to sustain its constructive bias in the sessions ahead.
Fed FAQs
Monetary policy in the US is shaped by the Federal Reserve (Fed). The Fed has two mandates: to achieve price stability and foster full employment. Its primary tool to achieve these goals is by adjusting interest rates. When prices are rising too quickly and inflation is above the Fed’s 2% target, it raises interest rates, increasing borrowing costs throughout the economy. This results in a stronger US Dollar (USD) as it makes the US a more attractive place for international investors to park their money. When inflation falls below 2% or the Unemployment Rate is too high, the Fed may lower interest rates to encourage borrowing, which weighs on the Greenback.
The Federal Reserve (Fed) holds eight policy meetings a year, where the Federal Open Market Committee (FOMC) assesses economic conditions and makes monetary policy decisions. The FOMC is attended by twelve Fed officials – the seven members of the Board of Governors, the president of the Federal Reserve Bank of New York, and four of the remaining eleven regional Reserve Bank presidents, who serve one-year terms on a rotating basis.
In extreme situations, the Federal Reserve may resort to a policy named Quantitative Easing (QE). QE is the process by which the Fed substantially increases the flow of credit in a stuck financial system. It is a non-standard policy measure used during crises or when inflation is extremely low. It was the Fed’s weapon of choice during the Great Financial Crisis in 2008. It involves the Fed printing more Dollars and using them to buy high grade bonds from financial institutions. QE usually weakens the US Dollar.
Quantitative tightening (QT) is the reverse process of QE, whereby the Federal Reserve stops buying bonds from financial institutions and does not reinvest the principal from the bonds it holds maturing, to purchase new bonds. It is usually positive for the value of the US Dollar.
- The Dow Jones fell 150 points on Wednesday after US jobs figures missed the mark.
- ADP hiring data slowed more than expected, and wage growth shrank to a two-year low.
- Investors await the Fed’s latest Meeting Minutes from December’s rate cut assessment.
The Dow Jones Industrial Average (DJIA) ground its way lower once again on Wednesday. The index backslid a choppy 150 points after equities turned tepid on the back of a misfire in preview jobs data ahead of this week’s key Nonfarm Payrolls (NFP) report.
ADP Employment Change showed a slower pace of hiring than markets expected in December, easing to 122K versus the expected 140K and November’s 146K. ADP wage data also pumped the brakes and hit its slowest pace since mid-2021.
The key print on Wednesday will be the Federal Reserve’s (Fed) latest Meeting Minutes from the December rate call. The Fed trimmed interest rates one final time by 25 bps to wrap up 2024, but now it looks set to hold off on any further rate cuts until the midpoint of 2025 as the US economy chugs along. Policy concerns about incoming President Donald Trump weigh on policymakers, even as they insist they don’t.
US markets will close early on Thursday, so traders should expect a tightening in market volumes during the American trading window. US operations are winding down in observance of the passing of former US President Jimmy Carter, who died in late December at the age of 100.
Dow Jones news
Equities listed on the Dow Jones were split roughly down the middle on Wednesday, but concentrated losses in key stocks are dragging the average to the low side. Johnson & Johnson (JNJ) tumbled to a new yearly low despite reaching ‘Fast Track’ status with the Food & Drug Administration for several of its new pharmaceutical offerings. JNJ is now down around 3% on the day and pushing below $142 per share.
Dow Jones price forecast
The Dow Jones’ bearish tilt, which began in late November, continues to weigh on the major equity index. The DJIA is on pace to close in the red for a sixth consecutive week and remains down nearly 6% from its all-time peak of 45,071 in November. Of the last 19 consecutive trading days, the Dow Jones has closed flat or in the red for all but three of them, including a record-setting run of 11 straight bearish sessions.
Despite a near-term bearish swing, downside momentum still faces significant headwinds. The DJIA is still trading north of the 200-day Exponential Moving Average (EMA) near 41,200, and bidders are still trying to get their feet under them and muscle price action back above the 50-day EMA near 43,150.
Dow Jones daily chart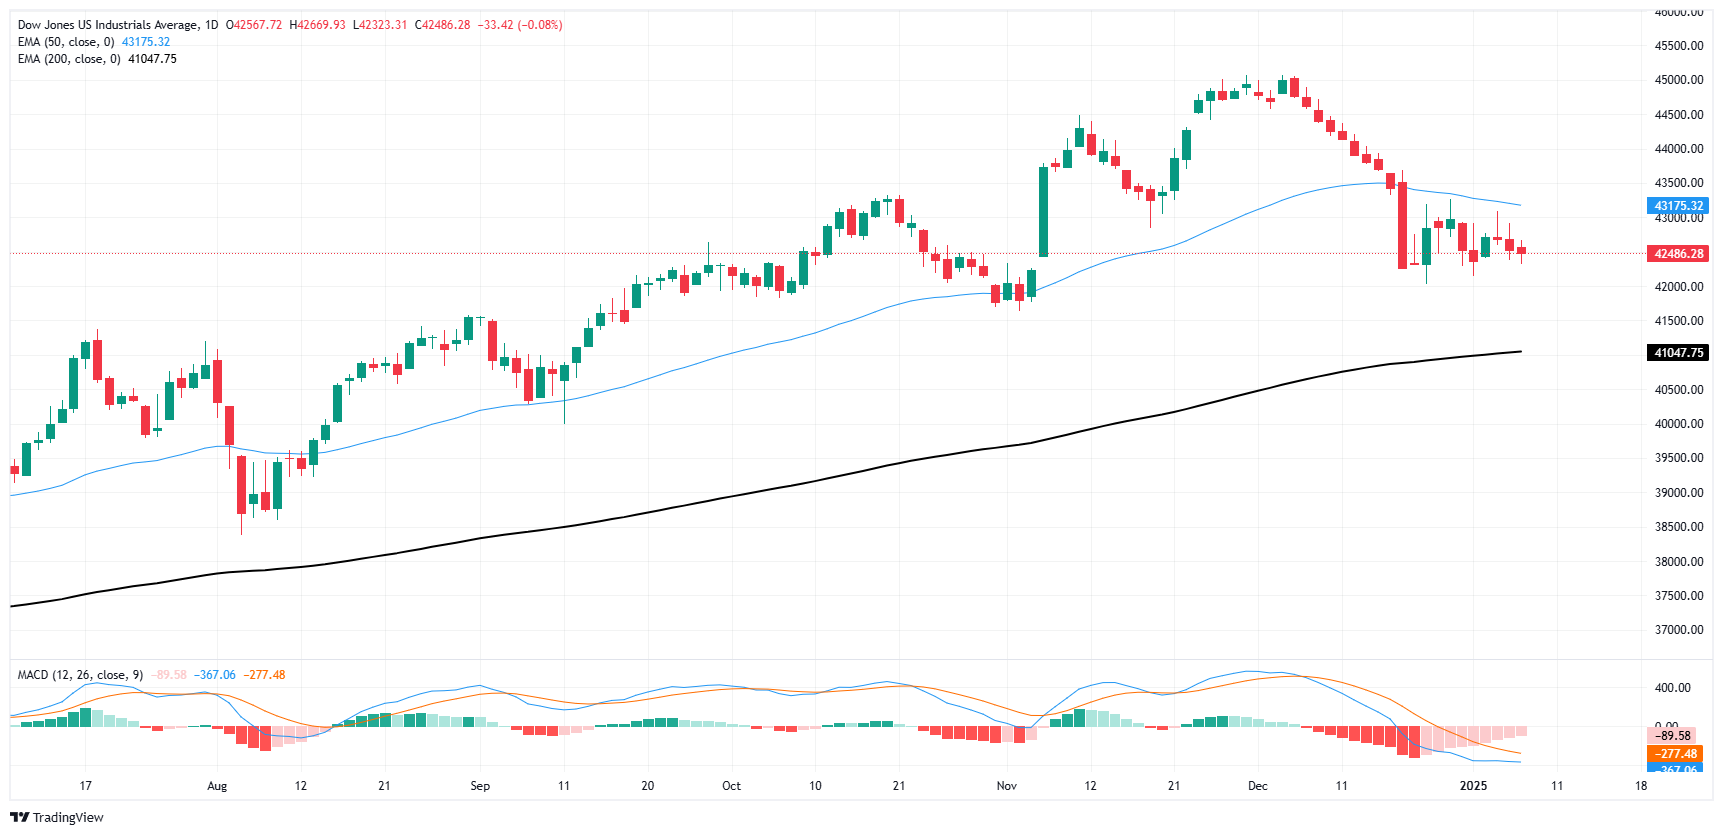
Dow Jones FAQs
The Dow Jones Industrial Average, one of the oldest stock market indices in the world, is compiled of the 30 most traded stocks in the US. The index is price-weighted rather than weighted by capitalization. It is calculated by summing the prices of the constituent stocks and dividing them by a factor, currently 0.152. The index was founded by Charles Dow, who also founded the Wall Street Journal. In later years it has been criticized for not being broadly representative enough because it only tracks 30 conglomerates, unlike broader indices such as the S&P 500.
Many different factors drive the Dow Jones Industrial Average (DJIA). The aggregate performance of the component companies revealed in quarterly company earnings reports is the main one. US and global macroeconomic data also contributes as it impacts on investor sentiment. The level of interest rates, set by the Federal Reserve (Fed), also influences the DJIA as it affects the cost of credit, on which many corporations are heavily reliant. Therefore, inflation can be a major driver as well as other metrics which impact the Fed decisions.
Dow Theory is a method for identifying the primary trend of the stock market developed by Charles Dow. A key step is to compare the direction of the Dow Jones Industrial Average (DJIA) and the Dow Jones Transportation Average (DJTA) and only follow trends where both are moving in the same direction. Volume is a confirmatory criteria. The theory uses elements of peak and trough analysis. Dow’s theory posits three trend phases: accumulation, when smart money starts buying or selling; public participation, when the wider public joins in; and distribution, when the smart money exits.
There are a number of ways to trade the DJIA. One is to use ETFs which allow investors to trade the DJIA as a single security, rather than having to buy shares in all 30 constituent companies. A leading example is the SPDR Dow Jones Industrial Average ETF (DIA). DJIA futures contracts enable traders to speculate on the future value of the index and Options provide the right, but not the obligation, to buy or sell the index at a predetermined price in the future. Mutual funds enable investors to buy a share of a diversified portfolio of DJIA stocks thus providing exposure to the overall index.
- Mexican Peso tumbled and hit a daily low of 20.52 as risk aversion boosted the Greenback.
- Mixed US job reports show resilience, with fewer unemployment claims than expected, supporting the US Dollar.
- Traders await FOMC December minutes and Mexico’s CPI data, eyeing insights into future monetary policy and inflation trends.
The Mexican Peso (MXN) was pressured by broad US Dollar (USD) strength on Wednesday, as risk-aversion capped the Mexican currency's advance due to reiterated tariff threats by United States (US) President-elect Donald Trump. This, alongside solid US jobs data, keeps the USD/MXN pair rising and exchanging hands at 20.37, up by 0.29%.
Risk aversion is driving the financial markets after CNN revealed that, according to sources, President-elect Donald Trump is considering “a national economic emergency declaration to allow for a new tariff program.”
The CNN article stated: “In 2019, Trump used the International Economic Emergency Powers Act (IEEPA) to threaten a 5% tariff on all Mexican imports that would rise to 25% if Mexico declined to take action to reduce the number of undocumented immigrants crossing the border with the United States.”
Consequently, USD/MXN jumped in the headlines to a daily peak of 20.52 before retreating to current exchange rates.
Meanwhile, the US economy continues to fare better than expected after the mixed US jobs data release. Although the ADP Employment Change for December fell shy of expectations, the US Department of Labor revealed that the number of people applying for unemployment benefits fell short of estimates.
Federal Reserve (Fed) Governor Christopher Waller stated that he does not anticipate tariffs causing persistent inflation and noted that the labor market is not exhibiting signs of overheating. While he supports additional rate cuts in 2025, he emphasized that the decision would depend on inflation progress.
Meanwhile, USD/MXN traders are eyeing the release of the December meeting minutes of the Federal Open Market Committee (FOMC). Mexico’s inflation data will also be in the spotlight on Thursday, with the release of the Consumer Price Index (CPI) for December, which is expected to continue showing the evolution of the disinflation process.
Daily digest market movers: Mexican Peso dives ahead of FOMC minutes
- Mexico’s inflation in December is expected to drop from 4.55% to 4.28% YoY in headline figures. According to analysts, core CPI is projected to rise from 3.58% to 3.62% YoY.
- In addition, traders will watch the release of the Banco de Mexico (Banxico) December meeting minutes on Thursday.
- According to the US Department of Labor, Initial Jobless Claims for the week ending January 3 fell to 201K from 211K, below estimates of 218K.
- Automatic Data Processing (ADP) revealed that private companies hired 122K people, below the 140K foreseen by economists.
- Interest rate probabilities suggest that the Federal Reserve would cut rates twice during the year, as the December 2025 Fed funds rate futures contract priced in 54 basis points (bps) of easing.
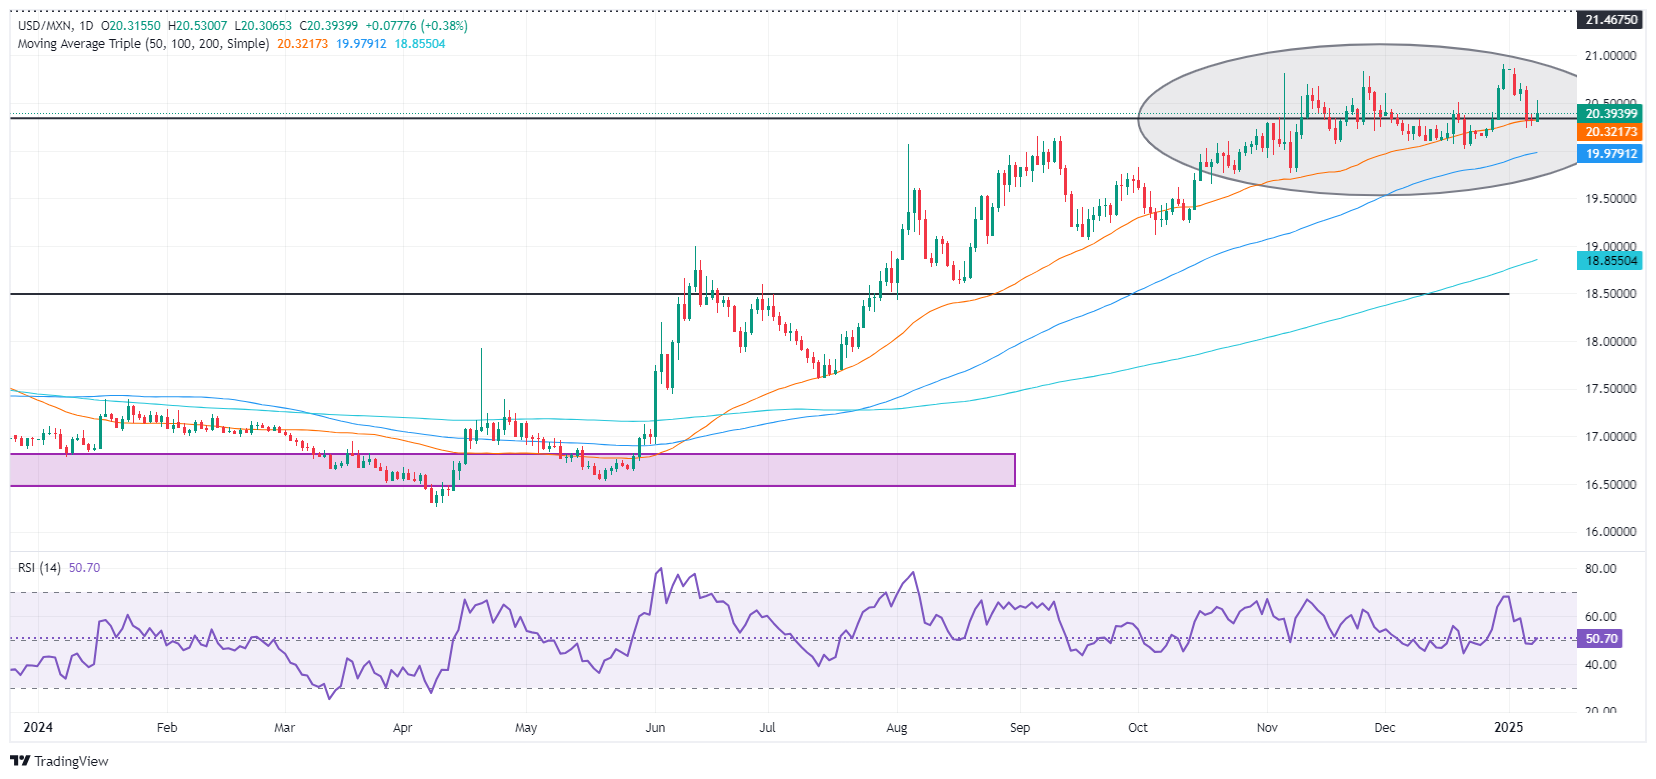
USD/MXN technical outlook: Mexican Peso remains heavy as USD/MXN climbs above 20.35
The uptrend in the exotic pair is expected to continue as the Fed turns slightly hawkish. USD/MXN bulls are leaning to the 50-day Simple Moving Average (SMA) at 20.28, and each of the three times that prices had hit the latter, the pair climbed above the 20.30 mark.
The Relative Strength Index (RSI) shifted bullish, indicating buyers are gathering steam.
If USD/MXN clears the 20.50 price level, the next resistance would be the year-to-date (YTD) high of 20.90, ahead of 21.00, and the March 8, 2022, peak of 21.46. Conversely, if USD/MXN tumbles below the 50-day SMA of 20.28, the next support would be the 20.00 figure, ahead of the 100-day SMA at 19.93, followed by the 19.50 figure.
Mexican Peso FAQs
The Mexican Peso (MXN) is the most traded currency among its Latin American peers. Its value is broadly determined by the performance of the Mexican economy, the country’s central bank’s policy, the amount of foreign investment in the country and even the levels of remittances sent by Mexicans who live abroad, particularly in the United States. Geopolitical trends can also move MXN: for example, the process of nearshoring – or the decision by some firms to relocate manufacturing capacity and supply chains closer to their home countries – is also seen as a catalyst for the Mexican currency as the country is considered a key manufacturing hub in the American continent. Another catalyst for MXN is Oil prices as Mexico is a key exporter of the commodity.
The main objective of Mexico’s central bank, also known as Banxico, is to maintain inflation at low and stable levels (at or close to its target of 3%, the midpoint in a tolerance band of between 2% and 4%). To this end, the bank sets an appropriate level of interest rates. When inflation is too high, Banxico will attempt to tame it by raising interest rates, making it more expensive for households and businesses to borrow money, thus cooling demand and the overall economy. Higher interest rates are generally positive for the Mexican Peso (MXN) as they lead to higher yields, making the country a more attractive place for investors. On the contrary, lower interest rates tend to weaken MXN.
Macroeconomic data releases are key to assess the state of the economy and can have an impact on the Mexican Peso (MXN) valuation. A strong Mexican economy, based on high economic growth, low unemployment and high confidence is good for MXN. Not only does it attract more foreign investment but it may encourage the Bank of Mexico (Banxico) to increase interest rates, particularly if this strength comes together with elevated inflation. However, if economic data is weak, MXN is likely to depreciate.
As an emerging-market currency, the Mexican Peso (MXN) tends to strive during risk-on periods, or when investors perceive that broader market risks are low and thus are eager to engage with investments that carry a higher risk. Conversely, MXN tends to weaken at times of market turbulence or economic uncertainty as investors tend to sell higher-risk assets and flee to the more-stable safe havens.
- EUR/USD declines by 0.48% on Wednesday, settling near 1.0295 after failing to break above the 20-day SMA.
- RSI falls sharply to 39 in negative territory, revealing intensified selling pressure.
- MACD histogram prints decreasing green bars, suggesting waning bullish momentum and a renewed downside tilt.
EUR/USD struggled on Wednesday, shedding 0.48% to trade around 1.0295. This latest drop underscores the pair’s inability to sustain any meaningful recovery, as multiple attempts to breach the 20-day Simple Moving Average (SMA) since early 2025 have been met with forceful selling. As a result, bullish momentum appears to be receding, leaving sellers firmly in control of the near-term price action.
Technical readings paint a downbeat picture. The Relative Strength Index (RSI) has dropped to 39, reinforcing the notion that downward pressure is picking up pace. Meanwhile, the Moving Average Convergence Divergence (MACD) histogram shows a decline in green bars, hinting that any previous efforts by buyers have begun to fade. Despite these setbacks, a definitive move above the 20-day SMA would still represent the clearest signal of a reversal, should buyers regroup and attempt another push higher.
Until that materializes, however, the path of least resistance remains tilted to the downside. Traders will keep a close watch on incoming macro catalysts and price action around the 20-day SMA for early signs of a possible turnaround.
EUR/USD daily chart
- AUD/USD falls with Trump's tariff threats and robust US labor data fueling gains in the US Dollar.
- US initial jobless claims drop significantly, underscoring the labor market's strength.
- Australian inflation data shows slight increase but fails to boost the Aussie as traders awaited FOMC minutes.
The Australian dollar posted losses of over 0.40% against the US Dollar, and the latter remains supported by US President-elect Donald Trump’s tariff threats. At the time of writing, the AUD/USD trades at 0.6204 after bouncing off daily lows of 0.6187.
AUD/USD faces downward pressure as Trump's potential economic emergency declaration looms
Recently, US data showed that the labor market remains strong, as Initial Jobless Claims for the week ending January 4 dropped from 211K to 201K, according to the US Department of Labor. The figures were below the consensus of 218K.
Earlier, Automatic Data Processing (ADP) revealed that private companies hired 122K people, below the 140K foreseen by economists.
Nonetheless, the main driver continues to be Donald Trump, as CNN revealed that he is considering a national economic emergency declaration to impose new tariffs, sources said.
In the central bank space, Federal Reserve Governor Christopher Waller commented that he doesn’t expect tariffs to produce persistent inflation, adding that the labor market is not behaving like an economy is overheating. He supports further cuts in 2025, but it will depend on the progress of inflation.
On the Australian side, inflation figures were released yet failed to increase appetite for the Aussie Dollar. Australian Weighted CPI for November, rose 2.3% YoY, above expectations and October’s readings of 2.2% and 2.1% each. The CPI Annual Trimmed Mean for the same period cooled slightly, from 3.5% to 3.2% YoY.
Ahead in the day, traders eye the release of the Federal Open Market Committee (FOMC) December meeting minutes, which are expected to show the committee's reasons for lowering borrowing costs in 2025.
AUD/USD Price Forecast: Technical outlook
The AUD/USD downtrend remains intact, after carving successive series of lower highs and lower lows since October 2024. Although the pair bottomed out at around 0.6178, further downside is seen as the pair hovers near 0.6200. A breach of the latter will expose the October 2022 swing low of 0.6169, followed by April’s 2020 monthly low of 0.5991.
On the upside, 0.6250 would be the first resistance level before traders could challenge the current week's peak at 0.6301.
Australian Dollar PRICE Today
The table below shows the percentage change of Australian Dollar (AUD) against listed major currencies today. Australian Dollar was the strongest against the British Pound.
| USD | EUR | GBP | JPY | CAD | AUD | NZD | CHF | |
|---|---|---|---|---|---|---|---|---|
| USD | 0.49% | 1.20% | 0.32% | 0.26% | 0.50% | 0.68% | 0.18% | |
| EUR | -0.49% | 0.70% | -0.13% | -0.23% | 0.00% | 0.19% | -0.32% | |
| GBP | -1.20% | -0.70% | -0.84% | -0.93% | -0.69% | -0.51% | -1.01% | |
| JPY | -0.32% | 0.13% | 0.84% | -0.06% | 0.18% | 0.35% | -0.15% | |
| CAD | -0.26% | 0.23% | 0.93% | 0.06% | 0.24% | 0.42% | -0.09% | |
| AUD | -0.50% | -0.01% | 0.69% | -0.18% | -0.24% | 0.18% | -0.31% | |
| NZD | -0.68% | -0.19% | 0.51% | -0.35% | -0.42% | -0.18% | -0.51% | |
| CHF | -0.18% | 0.32% | 1.01% | 0.15% | 0.09% | 0.31% | 0.51% |
The heat map shows percentage changes of major currencies against each other. The base currency is picked from the left column, while the quote currency is picked from the top row. For example, if you pick the Australian Dollar from the left column and move along the horizontal line to the US Dollar, the percentage change displayed in the box will represent AUD (base)/USD (quote).
- The Minutes of the Fed’s December 17-18 policy meeting will be published on Wednesday.
- Details surrounding the discussions on the decision to trim interest rates by 25 basis points will be scrutinized by investors.
- The publication could influence the market pricing of the Fed’s policy outlook and the US Dollar’s valuation.
The Minutes of the United States (US) Federal Reserve’s (Fed) December 17-18 monetary policy meeting will be published on Wednesday at 19:00 GMT. Policymakers lowered the rate by 25 basis points (bps) to the range of 4.25%-4.5% at the last policy meeting of 2024. However, the revised Summary of Economic Projections (SEP), also known as the dot plot, highlighted a cautious stance on further policy easing moving forward.
Jerome Powell and co decided to cut rates after December meeting
The Federal Open Market Committee (FOMC) voted 11 to 1 in favor of a 25 bps rate cut, with Cleveland Fed President Beth Hammack preferring to leave the policy rate unchanged. The Fed refrained from making significant changes to its policy statement from the November meeting, reiterating that it will assess incoming data, the evolving outlook and balance of risks when considering the extent and timing of additional rate adjustments.
"Based on my estimate that monetary policy is not far from a neutral stance, I prefer to hold policy steady until we see further evidence that inflation is resuming its path to our 2% objective,” Hammack said in explaining her decision to dissent.
Meanwhile, the revised SEP showed a majority of policymakers forecasted two more 25 bps rate cuts in 2025, down from four in September’s dot plot. In the post-meeting press conference, Fed Chairman Jerome Powell noted that they can be more cautious in reducing rates going forward and explained that a slower pace of cuts was reflecting expectations of higher inflation.
Speaking on the policy outlook over the weekend, Fed Governor Adriana Kugler said that their job on taming inflation is not yet done, while San Francisco Fed President Mary Daly noted that inflation is still “uncomfortably” above the Fed’s target.
Economic Indicator
FOMC Minutes
FOMC stands for The Federal Open Market Committee that organizes 8 meetings in a year and reviews economic and financial conditions, determines the appropriate stance of monetary policy and assesses the risks to its long-run goals of price stability and sustainable economic growth. FOMC Minutes are released by the Board of Governors of the Federal Reserve and are a clear guide to the future US interest rate policy.
Read more.Next release: Wed Jan 08, 2025 19:00
Frequency: Irregular
Consensus: -
Previous: -
Source: Federal Reserve
Minutes of the Federal Open Market Committee (FOMC) is usually published three weeks after the day of the policy decision. Investors look for clues regarding the policy outlook in this publication alongside the vote split. A bullish tone is likely to provide a boost to the greenback while a dovish stance is seen as USD-negative. It needs to be noted that the market reaction to FOMC Minutes could be delayed as news outlets don’t have access to the publication before the release, unlike the FOMC’s Policy Statement.
When will FOMC Minutes be released, and how could it affect the US Dollar?
The FOMC will release the minutes of the December 17-18 policy meeting at 19:00 GMT on Wednesday. Investors will scrutinize the discussions surrounding the policy outlook.
In case the publication shows that policymakers considered holding the policy rate steady but voted for a cut with anticipation of a slowdown in policy easing in 2025, the immediate reaction could support the USD. On the other hand, the USD could come under pressure if the document suggests that policymakers are willing to continue with rate reductions once they are convinced that President-elect Donald Trump’s policies, especially regarding import tariffs, will not stoke inflation.
According to the CME FedWatch Tool, markets are currently pricing in a nearly 90% probability of the Fed leaving the policy rate unchanged at the January meeting. This market positioning suggests that the USD doesn’t have a lot of room left on the upside. Additionally, investors could refrain from taking large positions based on FOMC Minutes and opt to wait until Friday’s December jobs report, causing the market reaction to remain short-lived.
Eren Sengezer, European Session Lead Analyst at FXStreet, shares a brief outlook for the USD Index:
“The Relative Strength Index (RSI) indicator on the daily chart declined below 60 on Monday, reflecting a loss of bullish momentum. On the downside, the Fibonacci 23.6% retracement level of the October-January uptrend forms key support for the USD Index at 107.00 ahead of 105.80 (Fibonacci 38.2% retracement) and the 105.80-105.50 area , where the Fibonacci 38.2% retracement and the 200-day Simple Moving Average is located.”
“Looking north, immediate resistance could be spotted at 109.30 (end-point of the uptrend) before 110.00 (round level, static level) and 110.60 (static level from November 2022).”
US Dollar FAQs
The US Dollar (USD) is the official currency of the United States of America, and the ‘de facto’ currency of a significant number of other countries where it is found in circulation alongside local notes. It is the most heavily traded currency in the world, accounting for over 88% of all global foreign exchange turnover, or an average of $6.6 trillion in transactions per day, according to data from 2022. Following the second world war, the USD took over from the British Pound as the world’s reserve currency. For most of its history, the US Dollar was backed by Gold, until the Bretton Woods Agreement in 1971 when the Gold Standard went away.
The most important single factor impacting on the value of the US Dollar is monetary policy, which is shaped by the Federal Reserve (Fed). The Fed has two mandates: to achieve price stability (control inflation) and foster full employment. Its primary tool to achieve these two goals is by adjusting interest rates. When prices are rising too quickly and inflation is above the Fed’s 2% target, the Fed will raise rates, which helps the USD value. When inflation falls below 2% or the Unemployment Rate is too high, the Fed may lower interest rates, which weighs on the Greenback.
In extreme situations, the Federal Reserve can also print more Dollars and enact quantitative easing (QE). QE is the process by which the Fed substantially increases the flow of credit in a stuck financial system. It is a non-standard policy measure used when credit has dried up because banks will not lend to each other (out of the fear of counterparty default). It is a last resort when simply lowering interest rates is unlikely to achieve the necessary result. It was the Fed’s weapon of choice to combat the credit crunch that occurred during the Great Financial Crisis in 2008. It involves the Fed printing more Dollars and using them to buy US government bonds predominantly from financial institutions. QE usually leads to a weaker US Dollar.
Quantitative tightening (QT) is the reverse process whereby the Federal Reserve stops buying bonds from financial institutions and does not reinvest the principal from the bonds it holds maturing in new purchases. It is usually positive for the US Dollar.
- Initial Jobless Claims in the US declined by 10,000 in the week ending January 4.
- US Dollar Index clings to daily gains above 109.00 after the data.
There were 201,000 initial jobless claims in the week ending January 4, the weekly data published by the US Department of Labor (DOL) showed on Wednesday. This print followed the previous week's print of 211,000 and came in better than the market expectation of 218,000.
Further details of the publication revealed that the advance seasonally adjusted insured unemployment rate was 1.2%.
"The advance number for seasonally adjusted insured unemployment during the week ending December 28 was 1,867,000, an increase of 33,000 from the previous week's revised level," the DOL noted in its press release. "The 4-week moving average was 1,865,500, a decrease of 3,000 from the previous week's revised average."
Market reaction
The US Dollar Index stays in positive territory after the data and was last seen rising 0.5% on the day at 109.20.
Federal Reserve Governor Christopher Waller said on Wednesday that he will support additional rate cuts in 2025 but the pace will depend on further inflation progress, per Reuters.
Key takeaways
"Inflation will continue to make progress towards 2%."
"Economy overall on solid footing, nothing to suggest labor market will weaken dramatically in coming months."
"Though recent inflation progress has been slow, much of that is due to imputed prices for housing and non-market services that are a less reliable guide to underlying price pressures."
"Base effects will improve inflation in 2025; more recent monthly and other shorter-term data also indicates improvement to come."
"Geopolitical conflicts and tariffs could be a source of renewed price pressure."
"Do not expect tariffs to produce persistent inflation and thus are not likely to influence views on appropriate monetary policy."
"Central bankers have a broad set of challenges ahead, from aging populations to geopolitical conflict and challenges to globalization."
Market reaction
The US Dollar Index showed no immediate reaction to these comments and was last seen gaining 0.4% on the day at 109.12.
Fed FAQs
Monetary policy in the US is shaped by the Federal Reserve (Fed). The Fed has two mandates: to achieve price stability and foster full employment. Its primary tool to achieve these goals is by adjusting interest rates. When prices are rising too quickly and inflation is above the Fed’s 2% target, it raises interest rates, increasing borrowing costs throughout the economy. This results in a stronger US Dollar (USD) as it makes the US a more attractive place for international investors to park their money. When inflation falls below 2% or the Unemployment Rate is too high, the Fed may lower interest rates to encourage borrowing, which weighs on the Greenback.
The Federal Reserve (Fed) holds eight policy meetings a year, where the Federal Open Market Committee (FOMC) assesses economic conditions and makes monetary policy decisions. The FOMC is attended by twelve Fed officials – the seven members of the Board of Governors, the president of the Federal Reserve Bank of New York, and four of the remaining eleven regional Reserve Bank presidents, who serve one-year terms on a rotating basis.
In extreme situations, the Federal Reserve may resort to a policy named Quantitative Easing (QE). QE is the process by which the Fed substantially increases the flow of credit in a stuck financial system. It is a non-standard policy measure used during crises or when inflation is extremely low. It was the Fed’s weapon of choice during the Great Financial Crisis in 2008. It involves the Fed printing more Dollars and using them to buy high grade bonds from financial institutions. QE usually weakens the US Dollar.
Quantitative tightening (QT) is the reverse process of QE, whereby the Federal Reserve stops buying bonds from financial institutions and does not reinvest the principal from the bonds it holds maturing, to purchase new bonds. It is usually positive for the value of the US Dollar.
The Pound Sterling (GBP) plunged more than a cent in response to the Trump tariff headlines, leaving it the worst-performing major currency on the session, Scotiabank’s Chief FX Strategist Shaun Osborne notes.
GBP/USD slumps on tariff report
“Losses are steadying in the mid/upper 1.23s but scope for recovery may remain limited in the short run. The GBP’s tone was already a little soft, reflecting building market concerns about rising domestic yields. Cable losses extended to a new, short-term cycle low at 1.2325 earlier. Spot is within reach of the 1.2300 major low reached in April last year.”
“Spot losses are stabilizing around 1.2350, close to last week’s low, but new lows and broadly bearish trend momentum suggest the GBP’s soft tone is liable to extend moving forward and likely means potential for near-term rebounds is very limited. Resistance is likely to be firm around 1.2450/75 now.”
Weak German data (soft November Retail Sales and a sharp, 5.4% plunge in Factory Orders over the November month are pushing the EUR lower, Scotiabank’s Chief FX Strategist Shaun Osborne notes.
EUR/USD extends losses on tariff report
“Spot losses have accelerated on the Trump tariff headlines in early dealing. The EUR could not hold gains above 1.04 yesterday and losses extended further than I had expected through the mid/upper 1.03s. Losses means the EUR is straying even further from out fair value estimate, leaving it one standard deviation below equilibrium at 1.0528.”
“The EUR’s failure to advance through the mid1.04 zone and yesterday’s loss of support in the mid/upper 1.03s leaves spot looking vulnerable again. Short-term trend momentum has shifted again—reflecting a weak EUR undertone—which may add to pressure for a retest of the mid/upper 1.02s.”
The Canadian Dollar (CAD) was little changed against the generally stronger USD overnight—which is no mean feat considering the amount of attention Canada is getting from the US president-elect, Scotiabank’s Chief FX Strategist Shaun Osborne notes.
CAD slips after holding steady overnight
“Markets perhaps don’t quite know what to make of the political vacuum at home and Trump’s apparent wish to co-opt Canada as the US’ 51st state. That may all be deflection, considering perhaps some more obvious foreign policy challenges for the incoming administration. Renewed tariff threats from Trump are weighing more obviously on the CAD as our session gets underway.”
“USD/CAD’s dithering around the 1.4335 technical breakdown point leaves the CAD’s position on the charts weaker now than at the start of the week when a mild rebound looked possible. A reversion to range trading around the 1.44 point looks more likely now, with near-term downside risk for USD/CAD alleviated. Resistance is 1.4465.”
The US Dollar (USD) is tracking higher. Headlines indicating that Trump might cite a national economic emergency as the justification for a new round of broadly applied tariffs is driving the USD higher in early trade, Scotiabank’s Chief FX Strategist Shaun Osborne notes.
Trump mulls ‘emergency’ basis for broad tariffs
“Stocks weakened on the headline, as did bonds—with Gilts underperforming. Rising US yields after yesterday’s US data round (highest ISM Services prices in two years or so and the strongest JOLTS report in 6 months) extends the recent pattern of firmer term rates and cautious expectations for additional Fed easing through the year ahead—less than 50bps of easing is now expected over the next 12 months, swaps suggest.”
“Rising US rates may not be as powerful a support fort the USD as they have been in the past few months. That’s because 1) rates are rising elsewhere, keeping spreads stable or even driving some narrowing in differentials and 2) to some extent, rising US term rates reflect a rising term premium— additional yield investors are demanding for the risk of holding US Treasury debt.”
“That may reflect investor concerns about the risk of a loosening fiscal policy as president-elect Trump’s term is about to start. Markets are long USDs, the DXY remains strongly overvalued and we continue to see the USD closely track its post-2016 election performance when it tumbled quite sharply in January of 2017. Despite the USD’s advance today, it’s not entirely clear that gains are sustainable in the longer run.”
- USD/JPY climbed to its highest level since July above 158.50 on Wednesday.
- The US Dollar benefits from the souring risk mood after Trump tariff news.
- ADP Employment Change data and FOMC Minutes coming up next.
USD/JPY continued to stretch higher and touched its strongest level since July above 158.50 on Wednesday. At the time of press, the pair was trading at 158.48, rising 0.27% on a daily basis.
Rising US Treasury bond yields support USD
US President-elect Donald Trump is considering declaring a national economic emergency to allow for a new tariff program, CNN reported on Wednesday, citing four sources familiar with the matter. With the immediate reaction, the benchmark 10-year US Treasury bond yield rose above 4.7%, boosting the US Dollar (USD).
In the early American session, the Automatic Data Processing (ADP) will release the private sector employment data for December, which is forecast to show an increase of 140,000 after November's print of 146,000.
Later in the day, the Federal Reserve will publish the minutes of the December policy meeting. Investors will scrutinize the details surrounding the discussions on the policy outlook for 2025 after the revised Summary of Economic Projections showed a majority of policymakers were forecasting two 25 basis points rate cuts this year.
Japanese Yen FAQs
The Japanese Yen (JPY) is one of the world’s most traded currencies. Its value is broadly determined by the performance of the Japanese economy, but more specifically by the Bank of Japan’s policy, the differential between Japanese and US bond yields, or risk sentiment among traders, among other factors.
One of the Bank of Japan’s mandates is currency control, so its moves are key for the Yen. The BoJ has directly intervened in currency markets sometimes, generally to lower the value of the Yen, although it refrains from doing it often due to political concerns of its main trading partners. The BoJ ultra-loose monetary policy between 2013 and 2024 caused the Yen to depreciate against its main currency peers due to an increasing policy divergence between the Bank of Japan and other main central banks. More recently, the gradually unwinding of this ultra-loose policy has given some support to the Yen.
Over the last decade, the BoJ’s stance of sticking to ultra-loose monetary policy has led to a widening policy divergence with other central banks, particularly with the US Federal Reserve. This supported a widening of the differential between the 10-year US and Japanese bonds, which favored the US Dollar against the Japanese Yen. The BoJ decision in 2024 to gradually abandon the ultra-loose policy, coupled with interest-rate cuts in other major central banks, is narrowing this differential.
The Japanese Yen is often seen as a safe-haven investment. This means that in times of market stress, investors are more likely to put their money in the Japanese currency due to its supposed reliability and stability. Turbulent times are likely to strengthen the Yen’s value against other currencies seen as more risky to invest in.