- Phân tích
- Tin tức và các công cụ
- Tin tức thị trường
Tin tức thì trường
- EUR/JPY rises and reclaims the 142.00 area, courtesy of improving market sentiment.
- Decelerating US economic data and UK’s tax cuts U-turn tempered investors’ fears, spurring a rally in global equities.
- Near term, the EUR/JPY is downward biased, and it could aim towards 140.80 if it clears 142.00.
The EUR/JPY climbs towards the 20-day EMA as the Asian session gets underway, up by a minimal 0.02%, as appetite for riskier assets augmented, courtesy of traders’ expectations for a less aggressive Fed, following the release of US economic data, suggesting economy activity slowed. Also, UK’s tax cut budget has been put aside by the Chancellor of the Exchequer, Kwasi Kuarteng, as it triggered market turmoil. At the time of writing, the EUR/JPY is trading at 142.14.
EUR/JPY Price Analysis: Technical outlook
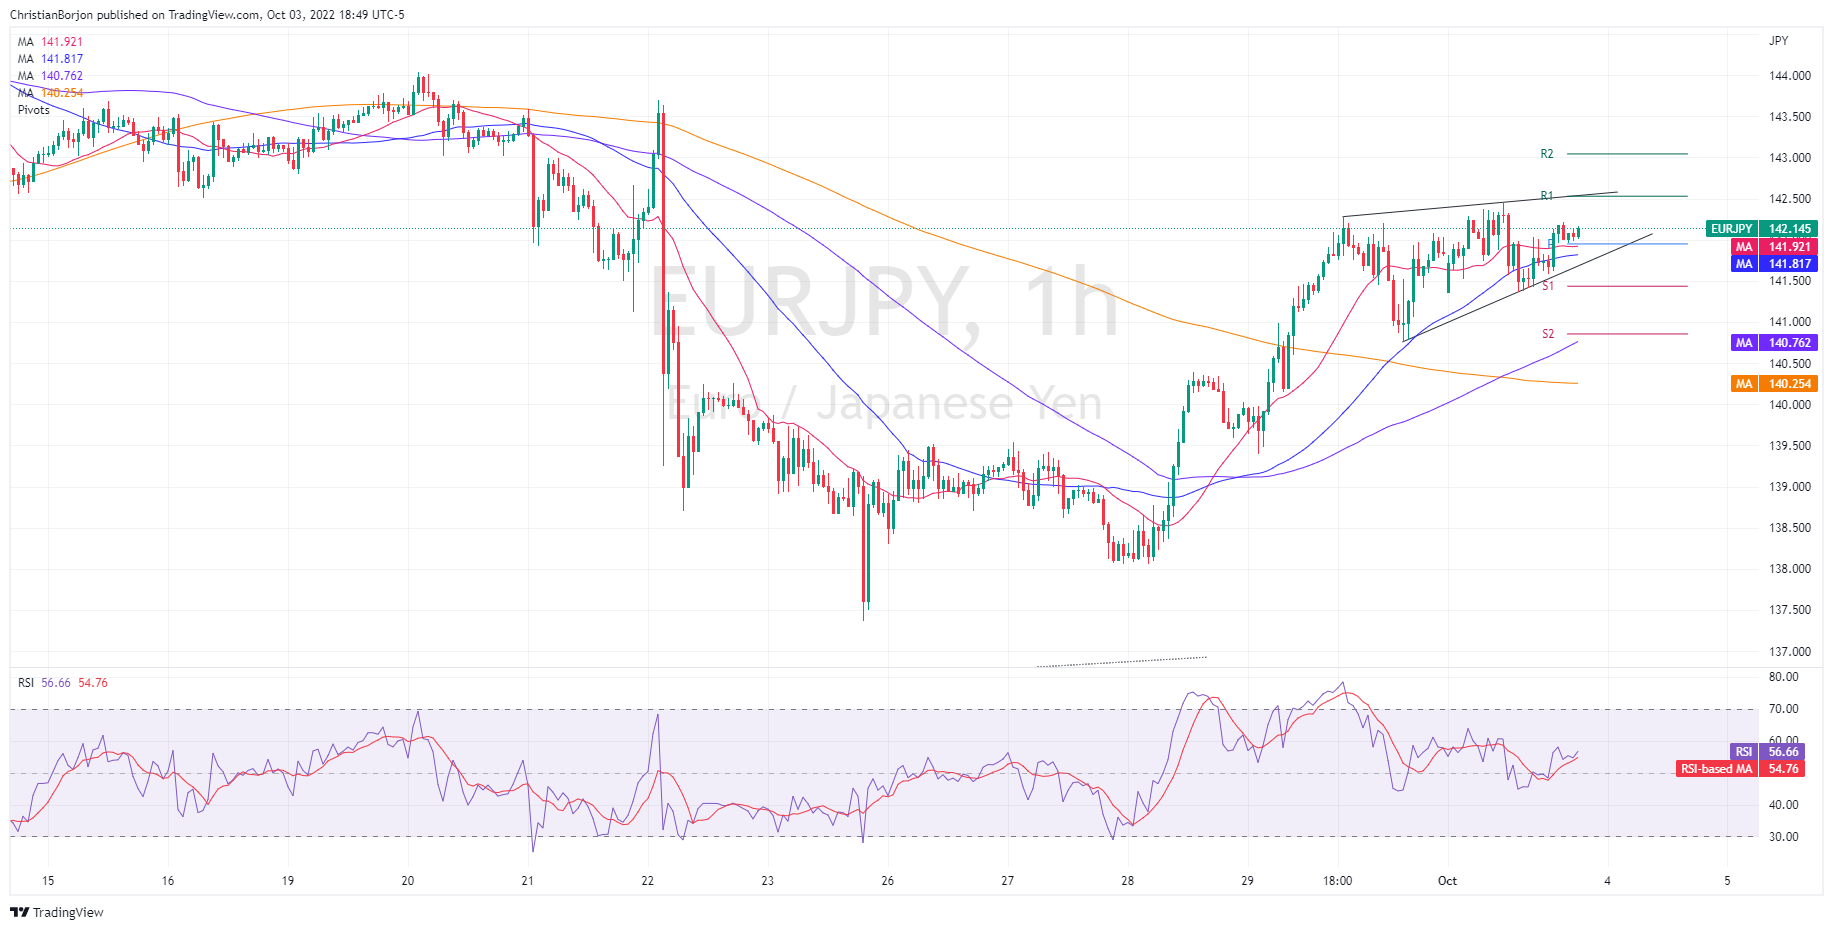
From a daily chart perspective, the EUR/JPY is still neutral-to-upward biased, unable to crack above the 20-day EMA, located at 142.12. Even though the pair pierced the 20-day EMA, price action needs to get higher and break the YTD high at 145.63 to pave the way for further gains and shift the bias upwards. Nevertheless, the Relative Strength Index (RSI), even though it persists in positive territory, is almost flat, suggesting that the price is consolidating.
The EUR/JPY hourly chart depicts the formation of an ascending wedge, which usually is a bearish-biased chart pattern. Nevertheless, it should be noted that the EMAs reside below the spot price, so there would be some difficult hurdles to surpass on the way south.
Therefore, the EUR/JPY first support would be the 20-EMA at 141.92, followed by the 50-EME at 141.81, ahead of the bottom trendline of the wedge, around 141.70. Once cleared, the next support would be the S1 daily pivot point at 141.45, followed by the confluence of the S2 pivot and the 100-EMA at 140.80.
EUR/JPY Key Technical Levels
- GBP/USD is marching towards 1.1400 as pound bulls got strengthened on UK’s U-turn on tax cut move.
- More liquidity in the palms of individuals due to tax cuts would have offset the impact of policy tightening.
- Fed’s tight monetary policy stance has trimmed the extent of manufacturing activities.
The GBP/USD pair is gathering momentum in the early Tokyo session to cross Monday’s high at 1.1334. The cable has been strengthened after witnessing a north-side break of the consolidation formed in a 1.1029-1.1232 range. The asset is expected to hit the critical resistance of 1.1400 sooner as the UK government’s U-turn move on tax cuts has infused fresh blood into the pound bulls. Adding to that, the weaker US dollar index (DXY) is a cherry on the cake.
On Monday, the report came from British Prime Minister Liz Truss and Finance Minister Kwasi Kwarteng citing that the administration would reverse a cut to the higher rate income tax causing UK gilt yields to fall sharply. As reports from Kwarteng’s office confirmed that the government is not proceeding with the abolition of the 45p tax rate, pound bulls displayed a long-lasting ball.
The market participants were blaming the administration for progressing with monetary easing in the UK economy as the Bank of England (BOE) is already addressing the troublesome job of containing the mounting price pressures. More liquidity in the palms of individuals due to tax cuts would have offset the impact of policy tightening measures taken at the time.
Meanwhile, the US dollar index (DXY) has established confidently below 112.00 and is looking to extend correction further. US economic fundamentals are deteriorating now as soaring interest rates by the Federal Reserve (Fed) have forced the manufacturers to trim their usage of production capacities. A decline in US ISM Manufacturing PMI data to 50.9 vs. the expectations of 52.2 and the prior release of 52.8 activated seller in the counter.
This week, the US Nonfarm Payrolls (NFP) will hog the limelight. As per the consensus, the US economy created 250k jobs in September against the August reading of 315k. While the jobless rate will remain steady at 3.7%.
- Gold price is facing less-confident hurdles around $1,700.00 after a vertical rally.
- Downbeat performance from US ISM Manufacturing data has weakened the DXY.
- Lower consensus for labor cost index data is becoming a concern for the DXY.
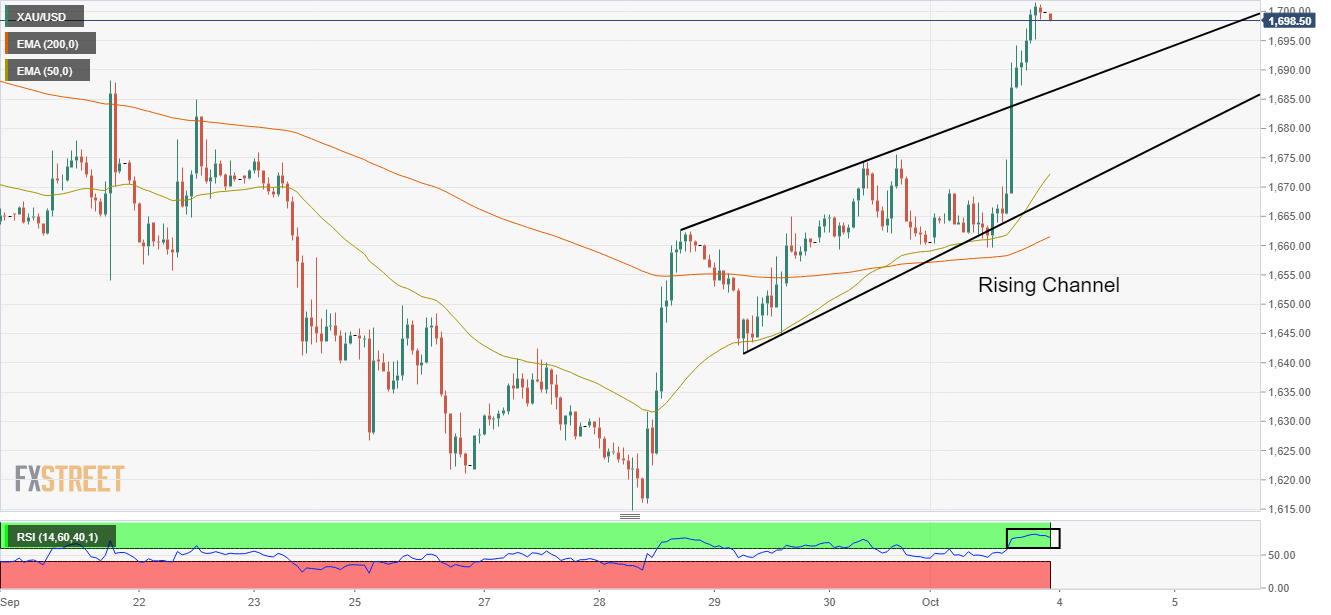
Gold price (XAU/USD) is hovering around the psychological resistance of $1,700.00 in the early Asian session. The precious metal displayed a juggernaut rally after delivering an upside break of the consolidation formed in a range of $1,660.00-1,675.70 in the past three trading sessions and is now facing pressure around $1,700.00. The yellow metal is expected to spend a little time around the critical resistance and will prepare for a further impulsive wave.
Meanwhile, the US dollar index (DXY) has printed a fresh weekly low at 111.47 and is looking to decline further on sluggish economic fundamentals. Weaker US ISM Manufacturing PMI data and lower consensus for US employment data are responsible for corrective action in the DXY. The US ISM Manufacturing PMI declined to 50.9 vs. the expectations of 52.2 and the prior release of 52.8.
This week, the release of the US NFP data will keep the DXY on the tenterhooks. The US NFP is seen lower at 250k vs. the prior release of 315k. While the Unemployment Rate is seen stabilizing at 3.7%. Apart from that, investors will keenly focus on the Average Hourly Earnings data. As price pressures have not shifted significantly to the lower side, the earnings data holds meaningful importance. The labor cost index is seen lower by 10 basis points (bps) to 5.1% on an annual basis.
Gold technical analysis
Gold prices have witnessed a juggernaut rally after an upside break of the Rising Channel chart pattern on an hourly scale. An upside break of the above-mentioned chart pattern plotted from Wednesday’s high at $1,662.80 and Thursday’s low at $1,641.59 displays the sheer confidence of bulls.
A formation of a golden cross, represented by the 50-and 200-period Exponential Moving Averages (EMAs) at $1,656.50 is indicating more upside ahead.
Also, the Relative Strength Index (RSI) (14) is oscillating in a bullish range of 60.00-80.00, which advocates the continuation of upside momentum.
Gold hourly chart
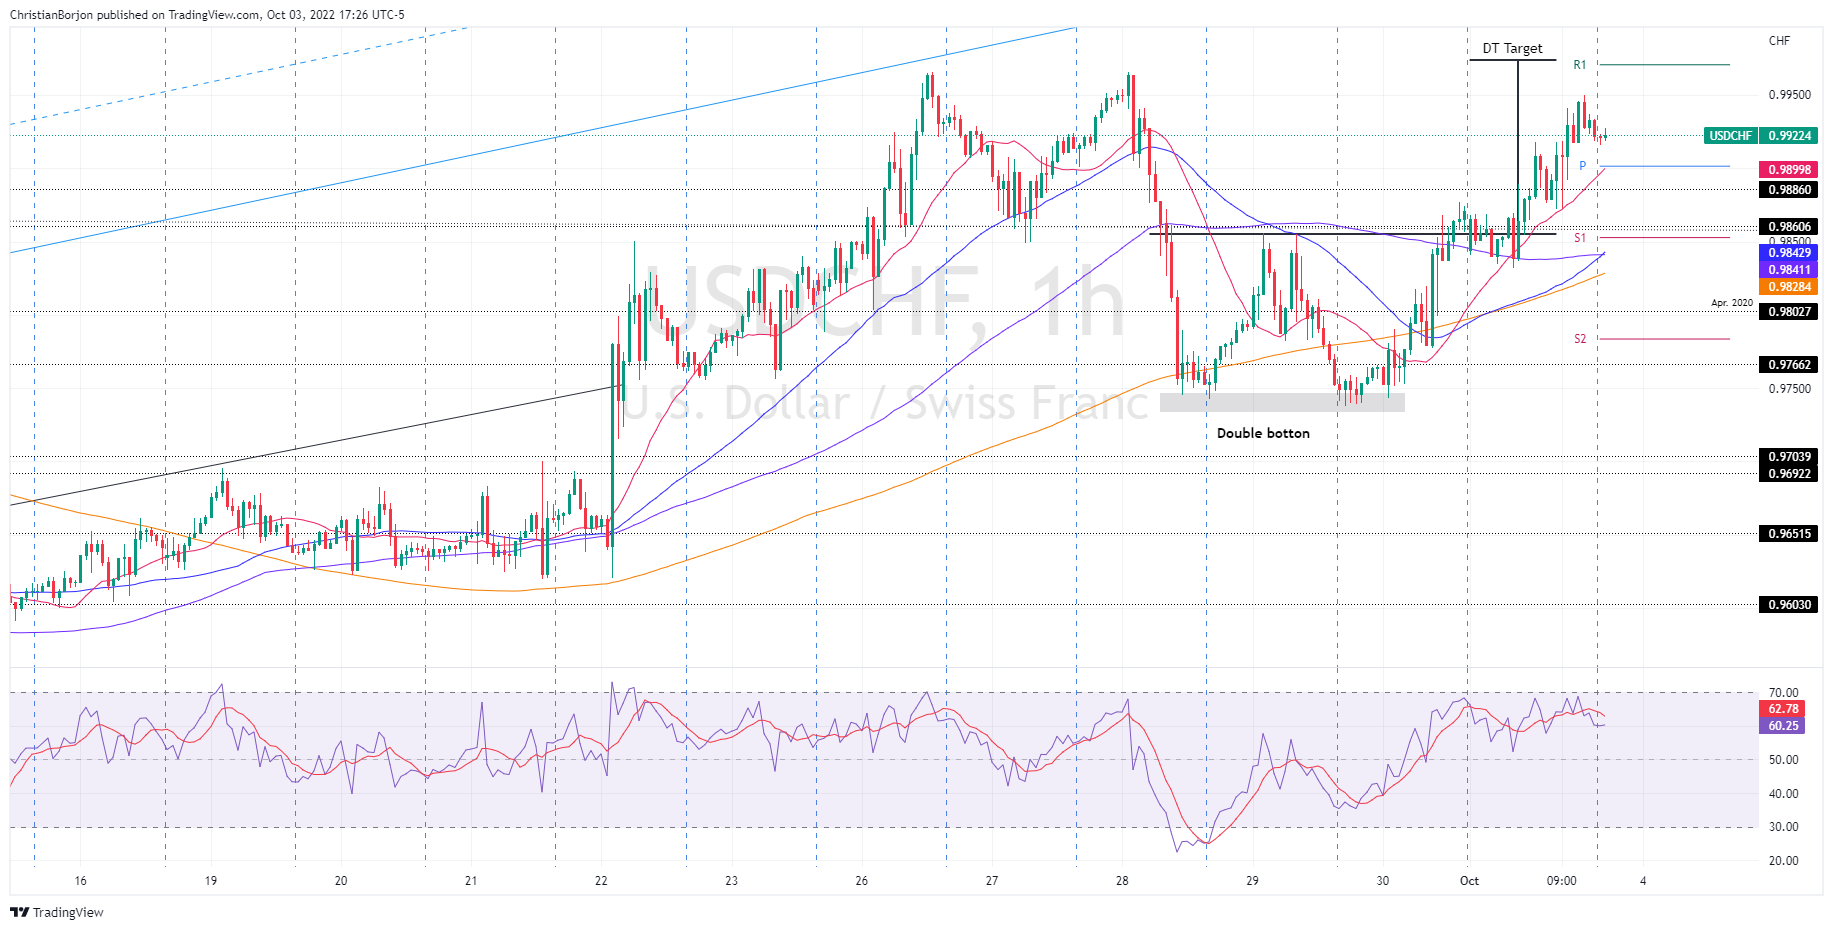
- The USD/CHF reclaims 0.9900, as a double bottom chart pattern, targets 0.9974.
- Short term, the USD/CHF is neutral-to-downward biased, but it could reach the double bottom target before retracing towards the 20-EMA at 0.9899.
The USD/CHF is slightly down as the Asian Pacific session begins, though in the week it is gaining some 0.49%, after hitting a weekly high in the mid-0.99-1.00 range, due to improvement in sentiment; however, it retraced some to the current spot prices. At the time of writing, the USD/CHF is trading at 0.9922, down 0.01%.
USD/CHF Price Analysis: Technical outlook
From a daily chart perspective, the USD/CHF remains upward biased, though it failed to break above the September monthly high of 0.9966. It should be noted that the major has printed a higher low, but to continue its uptrend, it would need to clear September’s high to open the door for a parity re-test.
Since September 28, the USD/CHF bottomed around the 0.9740 area, forming a double bottom chart pattern. During Monday’s session, the USD/CHF decisively cleared the September 29 daily high at 0.9855, validating the pattern, which targets a rally towards 0.9974.
Therefore, the USD/CHF first resistance would be the October 3 high at 0.9966. Once cleared, the next resistance would be the double bottom target, at 0.9974, followed by the parity.
USD/CHF Key Technical Levels
- EUR/USD is going through a tad wider range bound moves in a 100-pips territory ahead of US NFP data.
- A downbeat US ISM Manufacturing PMI data has weakened the DXY.
- Eurozone bulls are awaiting the release of the German Retail Sales data.
The EUR/USD pair is witnessing topsy-turvy moves in a wider range of 0.9750-0.9850 from the past two trading sessions. The asset has turned sideways as investors are preparing for the release of the mega event of US Nonfarm Payrolls (NFP) data this week. The major is displaying a balanced auction profile and is expected to convert into an imbalanced bullish move sooner.
On Monday, the US dollar index (DXY) witnessed an intense sell-off as a pullback move to near 112.50 was capitalized by the market participants as a selling opportunity. The DXY printed a fresh weekly low at 111.47 after the release of downbeat US ISM Manufacturing data.
The economic PMI data declined to 50.9 vs. the expectations of 52.2 and the prior release of 52.8. As interest rates are escalating by the Federal Reserve (Fed), the extent of manufacturing activities is declining. Also, corporate have postponed their expansion plans too. Apart from that, weaker New Orders Index data has also plunged. The economic indicator that reflects forward demand for manufacturing activities slipped to 47.1 against the projections of 49.6 and the former figure of 51.3.
Going forward, the release of the US employment data will be of utmost importance. The US NFP is seen lower at 250k vs. the prior release of 315k. While the Unemployment Rate is seen stabilizing at 3.7%.
On the Eurozone front, the Eurozone Retail Sales data will be of utmost importance. The economic data is expected to decline by 1.7% against a decline of 0.9% reported earlier. In times, when the inflation rate is mounting firmly, a decline in Retail Sales is a cause of worry.