- Phân tích
- Tin tức và các công cụ
- Tin tức thị trường
Tin tức thì trường
- EUR/USD defends the bounce off two-week low ahead of the key EU, US data/events.
- Economic fears surrounding Europe, China join mixed US data to challenge pair buyers.
- Firmer yields, equities challenge bears amid market’s indecision.
- FOMC Minutes will be eyed for clues of 0.75% rate hike in September.
EUR/USD treads water around 1.0175, keeping the previous day’s rebound in a choppy trading range during Wednesday’s Asian session, as traders await the week’s key catalysts. Also challenging the pair traders are the mixed concerns surrounding growth and central banks.
Fears of economic slowdown, mainly emanating from China and Europe, join firmer Treasury yields and positive equities to confuse the traders. It’s worth noting that the US dollar also retreated amid the market’s indecision.
With this, the US Dollar Index (DXY) refreshed its three-week high before reversing from 106.94. That said, the DXY previously benefited from the flight to safety as China’s readiness for multiple measures to tame recession woes joined Europe’s signals to renew the nuclear deal with Iran while pushing back plans for the closure of Germany’s last three nuclear power plants. On the same line was the Washington Post (WaPo) news that mentioned that Chinese authorities ordered factories to suspend production in several major manufacturing regions to preserve electricity, as the country face the worst heat wave in six decades.
Talking about the data, US Industrial Production grew 0.6% in July versus 0.3% expected and upwardly revised 0.0% prior whereas Building Permits also increased to 1.674M MoM during the stated month versus 1.656 market expectations and 1.696M previous readings. It should be noted that the Housing Starts dropped to 1.446M from 1.599M prior and 1.54M expected. Further, ZEW Sentiment data from Germany and Europe came in weaker for Economic Sentiment but improved a bit for Current Situation.
Amid these plays, Wall Street managed to close on a positive side, despite retreating by the end of the day. That said, the US 10-year Treasury yields snapped a two-day downtrend by regaining 2.80% at the latest. It should be noted that the US 10-year Treasury yields pause the previous day’s rebound while the S&P 500 Futures print mild losses at the latest.
Looking forward, EUR/USD traders will initially respond to the second readings of the Eurozone Gross Domestic Product (GDP), expected to confirm the 0.7% QoQ forecasts, ahead of preliminary readings of Eurozone Employment Change for the second quarter (Q2), expected 2.5% versus 2.9% prior. Also crucial will be the US Retail Sales for July, expected 0.1% versus 1.0% prior. Above all, the Federal Open Market Committee (FOMC) meeting minutes appear as the key event of the day, as well as for the week.
It’s worth noting that the Minutes statement will be eyed to confirm another hawkish move in September despite the latest reduction in the inflation fears.
Technical analysis
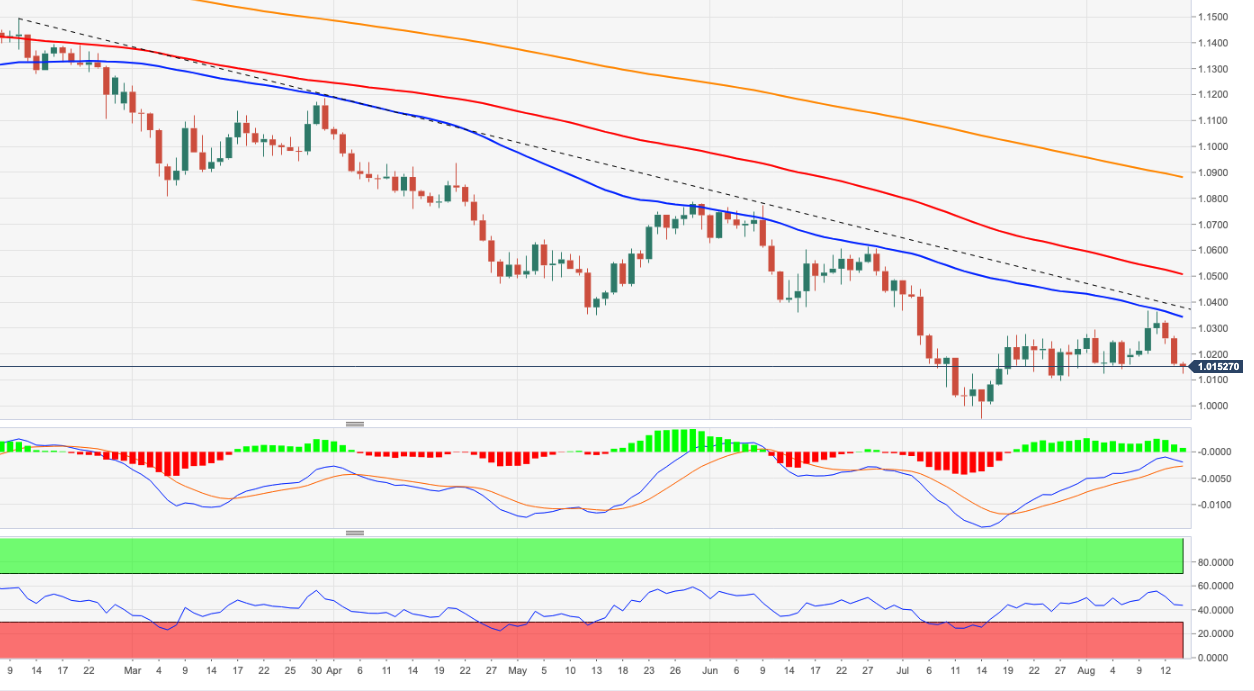
EUR/USD bounces off 23.6% Fibonacci retracement of late May to mid-July downturn, around 1.0150, with the previous support from July, at 1.0245 now, likely to restrict immediate upside.
- AUD/NZD has corrected in a 50% mean reversion ahead of key data events.
- Bears are looking for a break of the trendline support and structure at 1.0952.
AUD/NZD is flat on the day so far ahead of the release of the Monetary Policy Statement from the Reserve Bank of New Zealand today that is expected to see another 50bp lift in the OCR to 3.0%. The cross has been stalling on the bid within familiar ranges. AUD/NZD has stuck to 1.1057 and 1.1069 on the day.
''We are expecting a hawkish tone today as the RBNZ tries to reiterate the battle to bring down surging inflation is far from over. Upside surprises in domestic inflation and wage growth, along with the recent falls in domestic mortgage rates given the Monetary Policy Committee little choice but to send a clear message,'' analysts at ANZ Bank explained.
Meanwhile, the Aussie jobs data will be keenly monitored tomorrow whereby analysts at TD Securities said ''wages growth may accelerate in Q2 as firms face record labour constraints while workers may demand higher base wages with inflation at a 21-year high.'' The analysts added ''July is a seasonally strong month for job gains and we look for the unemployment rate to trend lower. Another strong labour print should give the RBA the assurance that the economy can withstand a cash rate of 3% by end-2022.''
AUD/NZD technical analysis
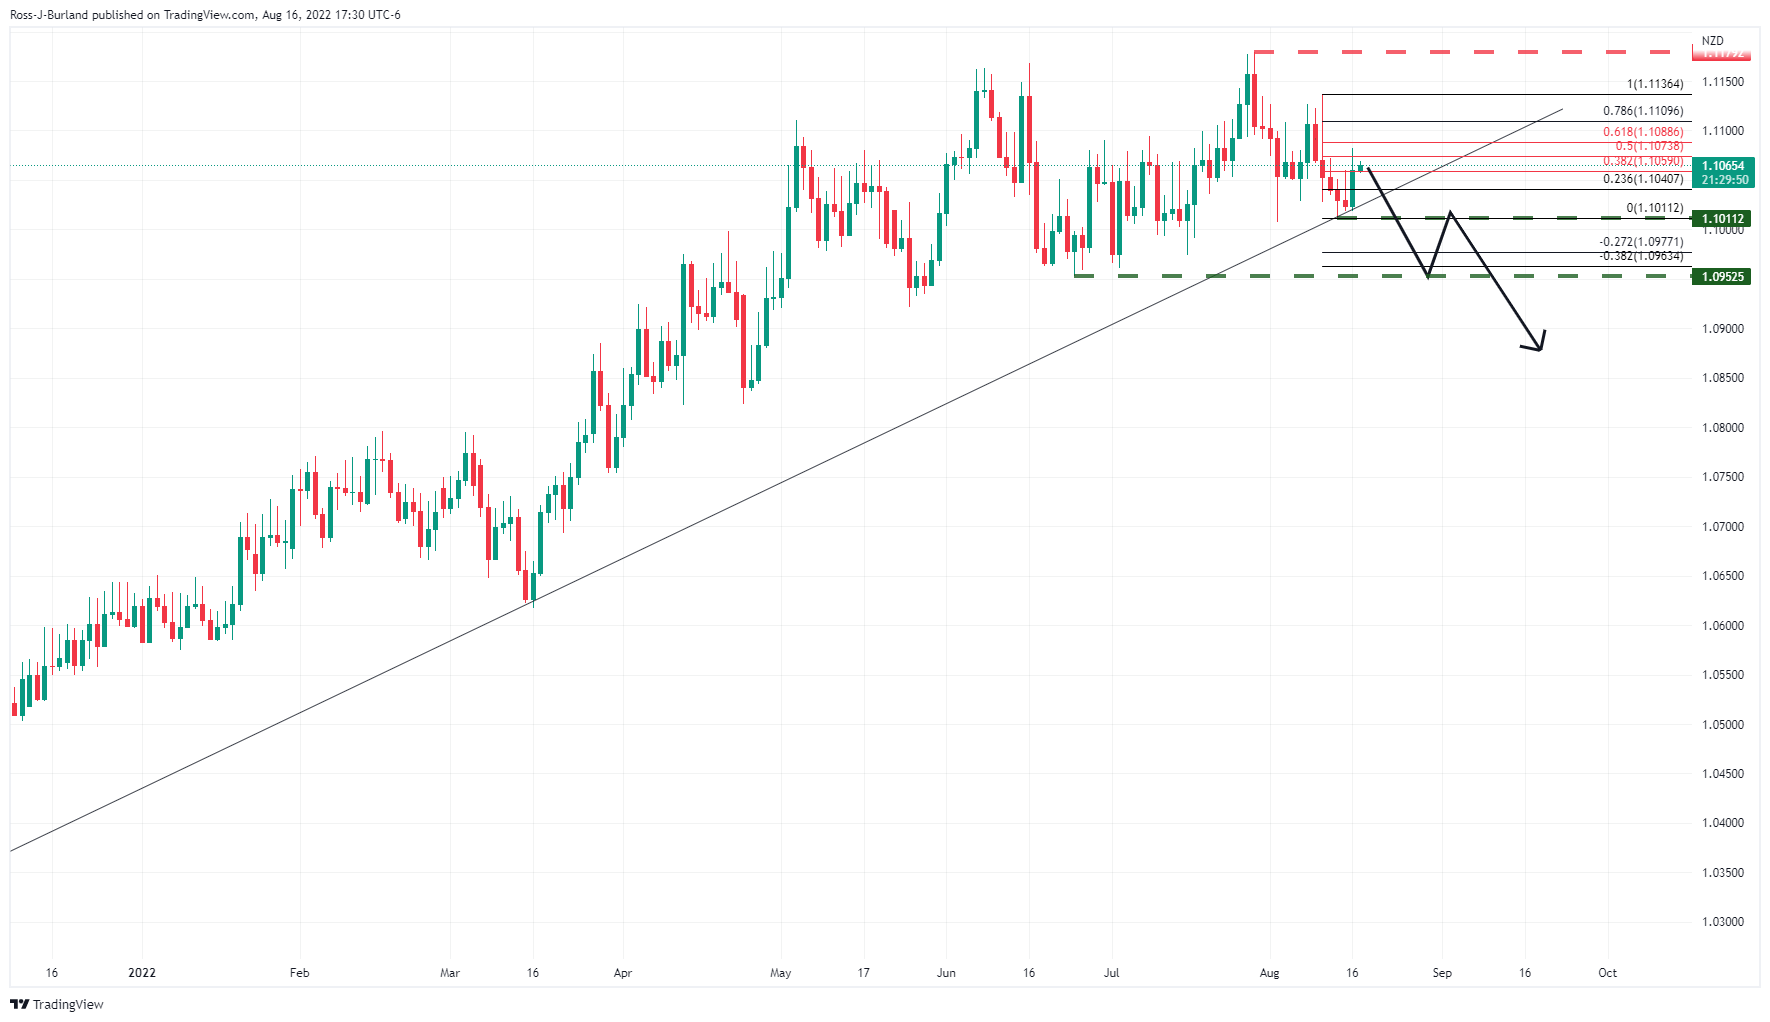
The price has corrected in a 50% mean reversion and should the bears now move in, then a break of the trendline support and structure at 1.0952 will be a significant development.
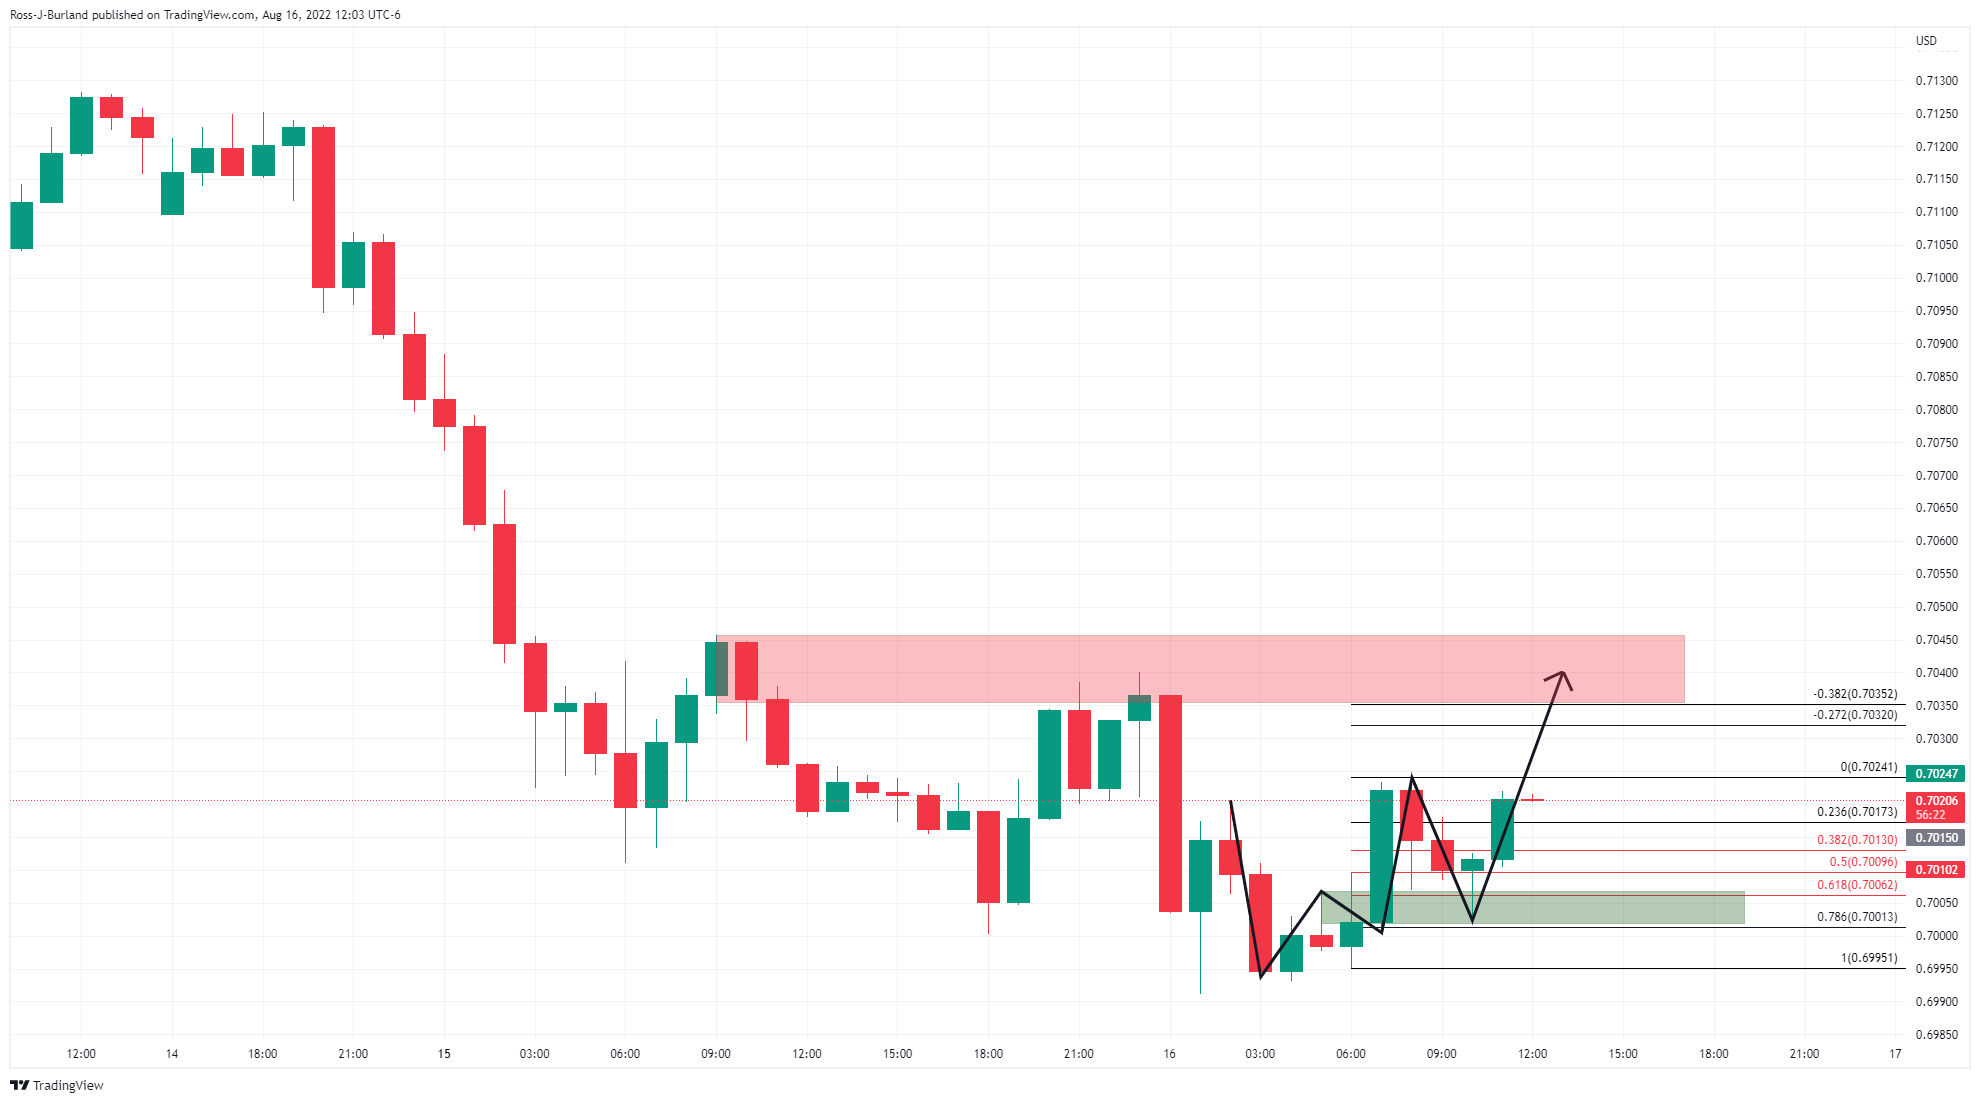
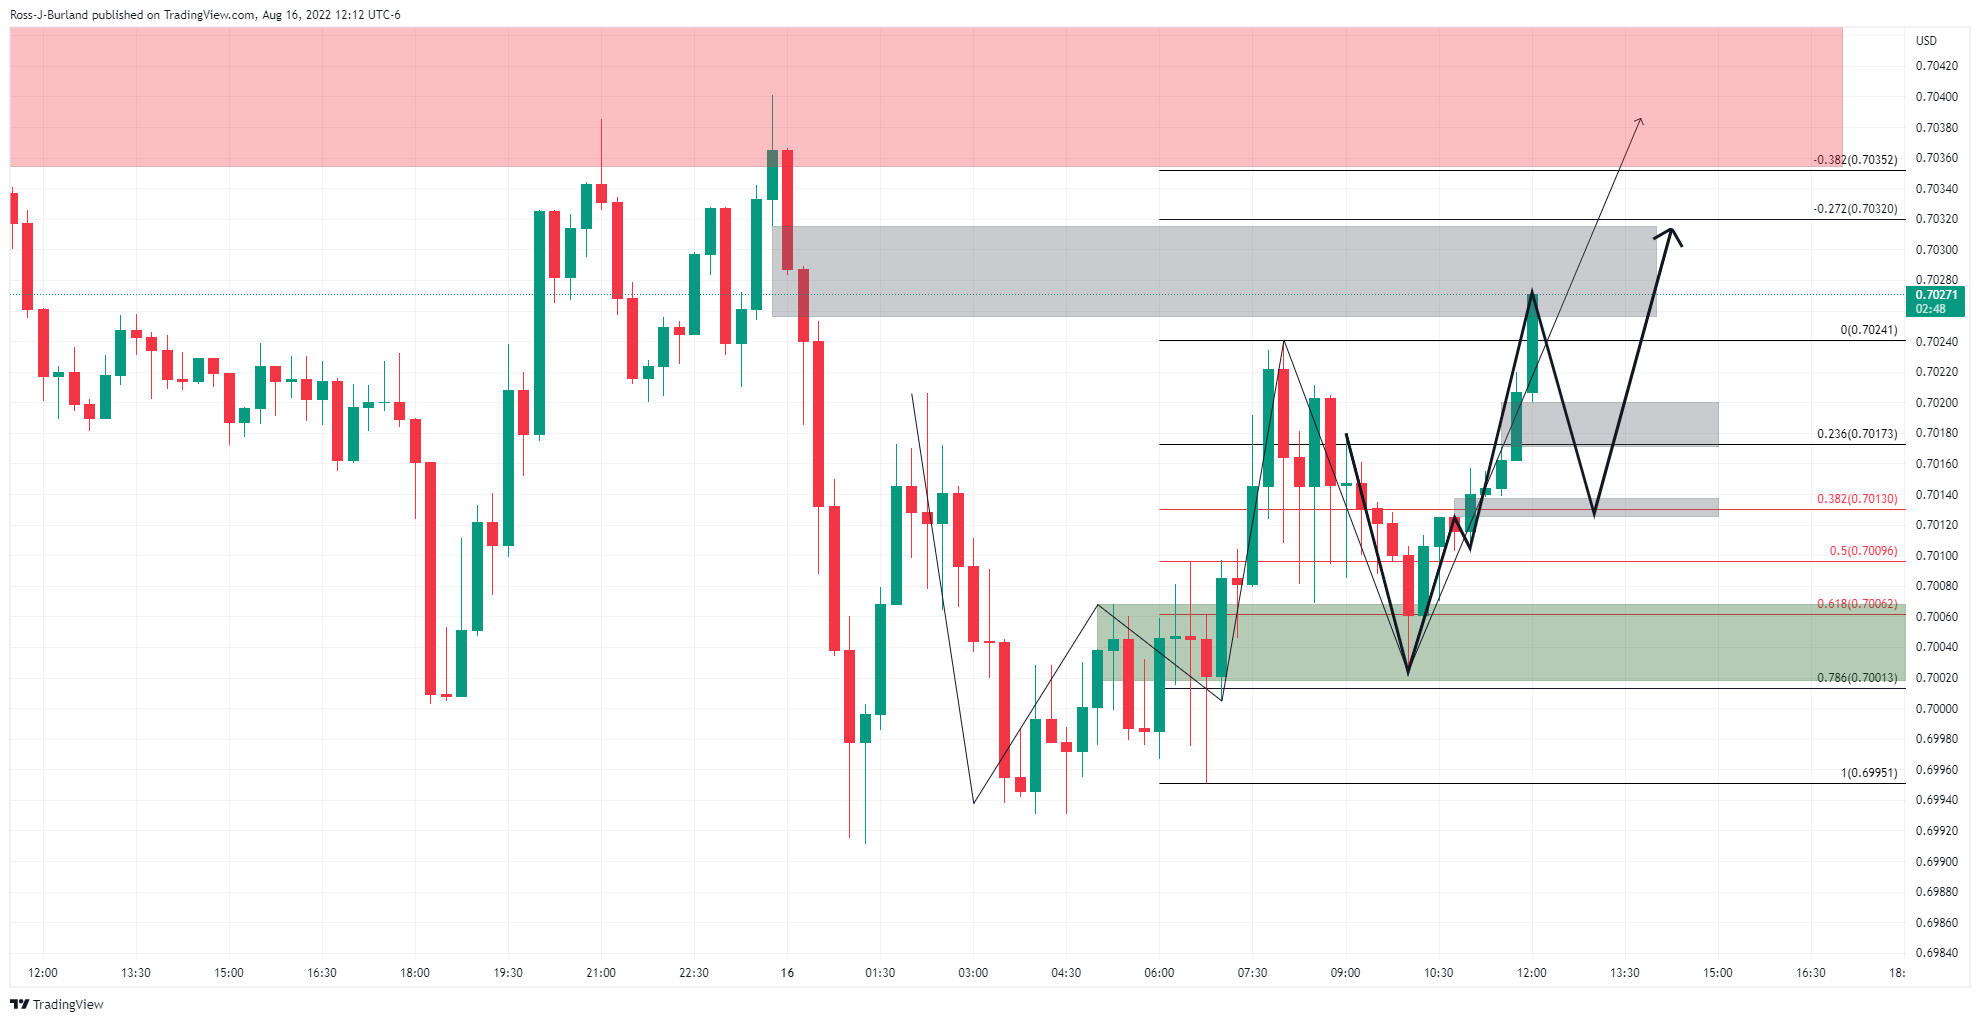
- GBP/USD keeps the previous day’s rebound, the consecutive third one from 50% Fibonacci retracement since late July.
- Steady RSI, impending bull cross on MACD teases buyers to overcome immediate hurdle.
- 100-SMA adds to the upside filters, multiple supports to challenge bears.
GBP/USD picks up bids to extend the previous day’s recovery to 1.2100 during Wednesday’s Asian session. In doing so, the Cable pair approaches a one-week-old resistance line while also portraying the third bounce off the 50% Fibonacci retracement level of July-August advances.
In addition to the sustained rebound from the key Fibonacci support, steady RSI and a looming bull cross of the MACD also keep the GBP/USD buyers hopeful of overcoming the 1.2110 immediate hurdle.
Even so, the 100-SMA level of 1.2130 acts as an extra filter to the north before giving control to the bulls.
Following that, the 1.2200 threshold may act as an intermediate halt during the run-up to the monthly high near 1.2295.
Alternatively, pullback moves may initially test the 200-SMA, around 1.2045 at the latest, before revisiting the 50% Fibonacci retracement level of 1.2030.
In a case where the GBP/USD bears keep reins past 1.2030 key support, the 61.8% Fibonacci retracement level and late July’s swing low, respectively around 1.1965 and 1.1890, will be in focus.
GBP/USD: Four-hour chart
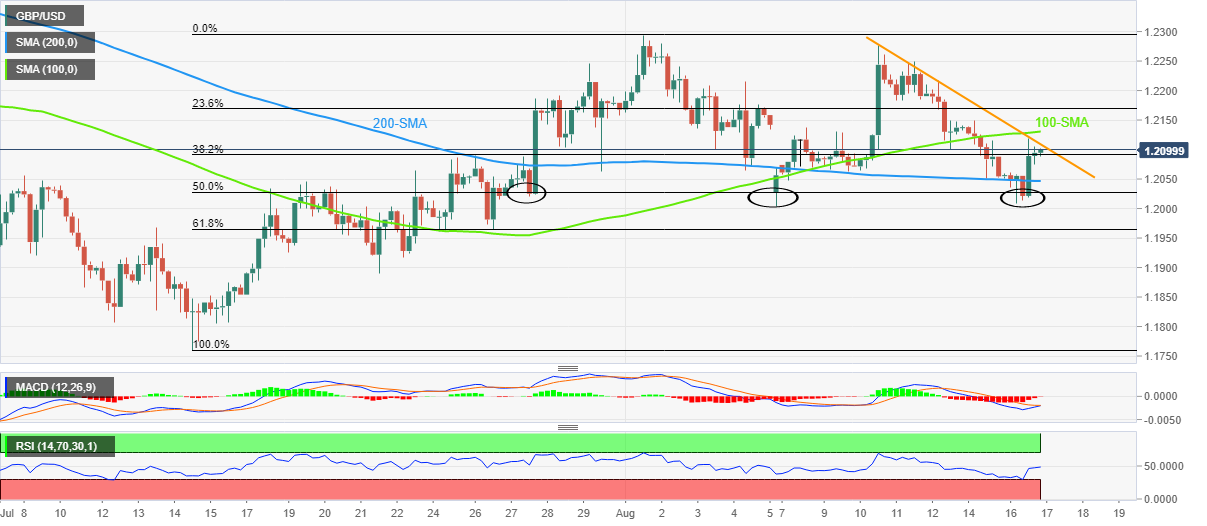
Trend: Further upside expected
- EUR/JPY bounced off weekly lows and gained almost 1% on Tuesday.
- Albeit recovering from Monday’s losses, faltering of achieving a daily close above 137.00 left the EUR/JPY vulnerable to selling pressure.
The EUR/JPY reached a new weekly low at 134.94 on Tuesday but staged a comeback and hit a daily high at 136.92 before closing at 136.50, off the day’s high. At the time of writing, the EUR/JPY is trading at 136.56, slightly up 0.02% as Wednesday’s Asian Pacific session begins.
EUR/JPY Price Analysis: Technical outlook
EUR/JPY Tuesday’s price action witnessed a shared currency recovery but faltering to close above Monday’s open at 136.89, leaving the cross vulnerable to sellers. Until Wednesday’s price action shows that the EUR/JPY trading above 137.00, the cross-currency pair is neutral-to-downward biased. Nevertheless, if the previously-mentioned scenario plays out, a rally towards the 50-day EMA at 138.00 is on the cards.
Therefore, the EUR/JPY’s first resistance would be the 20-day EMA at 137.24. Once broken, the next supply zone would be the 100-day EMA at 138.09, followed by the 50-day EMA at 139.34.
On the other hand, failure at 137.00 would open the door for further losses. The EUR/JPY first support would be 136.00. Break below will expose the weekly low at 134.94, followed by the 200-day EMA at 133.98.
EUR/JPY Key Technical Levels
- NZD/USD stays defensive at one-week low ahead of the key events.
- New Zealand PPI grew more than forecast in Q2 but came in softer-than-prior.
- Economic fears surrounding China, concerns over Fed’s September rate hike exert downside pressure.
- RBNZ is likely to announce fourth consecutive 0.50% rate increase but bulls need more to retake control.
NZD/USD struggles to defend the latest bounce off the 100-DMA as it seesaws near 0.6350 heading into the key interest rate announcement by the Reserve Bank of New Zealand (RBNZ) early Wednesday in Asia. In doing so, the Kiwi pair justifies the market’s indecision as the Fed Minutes also highlight today as the key day in the calendar.
Recession woes join mixed data and anxiety ahead of September Federal Open Market Committee (FOMC) meeting weigh on the NZD/USD prices of late. However, firmer equities and the US dollar’s pullback ahead of the Fed Minutes seem to challenge the Kiwi pair sellers. On the same line could be New Zealand’s second quarter (Q2) Producer Price Index (PPI) data.
New Zealand’s PPI-Input rose past 2.2% expected to 3.1% in Q2 but stayed below 3.6% in previous readings. In the same way, the PPI-Output also crossed the 2.1% market forecasts with 2.4% QoQ figures while easing beneath the previous 2.6% prior.
On the other hand, China’s state planner announced multiple measures to fight back the recession woes after downbeat data and the failure of the People’s Bank of China’s (PBOC) rate cut in impressing traders. Also, Washington Post (WaPo) mentioned that Chinese authorities ordered factories to suspend production in several major manufacturing regions to preserve electricity, as the country face the worst heat wave in six decades.
It should be noted that the US Dollar Index (DXY) refreshed its three-week high before reversing from 106.94. The greenback’s gauge versus six major currencies previously benefited from the flight to safety before the firmer equities and consolidation ahead of FOMC Minutes joined mixed data to weigh on the quote.
That said, US Industrial Production grew 0.6% in July versus 0.3% expected and upwardly revised 0.0% prior whereas Building Permits also increased to 1.674M MoM during the stated month versus 1.656 market expectations and 1.696M previous readings. It should be noted that the Housing Starts dropped to 1.446M from 1.599M prior and 1.54M expected.
While portraying the mood, Wall Street managed to close on the positive side, despite retreating by the end of the day. That said, the US 10-year Treasury yields snapped a two-day downtrend by regaining 2.80% at the latest.
Looking forward, NZD/USD traders will pay attention to the RBNZ’s announcement as New Zealand’s central bank is up for the seventh back-to-back increase in its benchmark interest rate, from 2.5% to 3.0%, not to forget a fourth straight 50 basis points (bps) rate hike. It’s worth noting that the 0.50% rate lift is discussed and priced in, which in turn signals the “need for more” by the pair buyers. Following that, the Fed Minutes will be eyed to confirm another hawkish move in September despite the latest reduction in the inflation fears.
Also read: Reserve Bank of New Zealand Preview: Growth fears could temper hawkish rhetoric
Technical analysis
NZD/USD recently bounced off the 100-DMA support around 0.6320 amid bullish RSI divergence. The recovery moves, however, need validation from a downward sloping resistance line from late April, close to 0.6460 by the press time
- AUD/USD fades bounce off one-week low, stays sidelined of late.
- Fears emanating from China, mixed message from RBA Minutes challenge buyers.
- US dollar pullback, firmer equities restrict immediate downside ahead of the key Aussie data.
- RBA emphasizes firmer wage growth, Fed Minutes eyed for stronger rate hikes.
AUD/USD portrays the market’s anxiety as it seesaws around 0.7020 ahead of the key Australia wage price data and the Federal Open Market Committee (FOMC) meeting minutes on early Wednesday in Asia. That said, the risk barometer pair dropped during the last two days amid recession and geopolitical fears before bouncing off a one-week low in late Tuesday.
Pessimism surrounding Australia’s major customer China and the Reserve Bank of Australia’s (RBA) cautious remarks over the next rate hike move appeared to have exerted major downside pressure on the AUD/USD prices of late.
On Tuesday, the RBA Minutes mentioned that the board expects to take further steps in the process of normalizing monetary conditions over the months ahead, but it is not on a pre-set path, per Reuters. On the other hand, China’s state planner announced multiple measures to fight back the recession woes after downbeat data and the failure of the People’s Bank of China’s (PBOC) rate cut in impressing traders. Also, Washington Post (WaPo) mentioned that Chinese authorities ordered factories to suspend production in several major manufacturing regions to preserve electricity, as the country face the worst heat wave in six decades.
Talking about data, US Industrial Production grew 0.6% in July versus 0.3% expected and upwardly revised 0.0% prior whereas Building Permits also increased to 1.674M MoM during the stated month versus 1.656 market expectations and 1.696M previous readings. It should be noted that the Housing Starts dropped to 1.446M from 1.599M prior and 1.54M expected.
Against this backdrop, Wall Street managed to close on the positive side, despite retreating by the end of the day. That said, the US 10-year Treasury yields snapped a two-day downtrend by regaining 2.80% at the latest.
Moving on, Australia’s second quarter (Q2) Wage Price Index, expected at 0.8% QoQ versus 0.7% prior, will be important for immediate AUD/USD moves as RBA emphasizes more on the wage data and inflation. Following that, the Fed Minutes will be crucial for clear directions as traders doubt a 0.75% rate hike in September after the latest easing in inflation.
Technical analysis
A four-month-old previous resistance line restricts immediate AUD/USD downside to around 0.6990. The recovery moves, however, need validation from the 200-DMA hurdle surrounding 0.7120. That said, the RSI (14) favors the quote’s further upside as the oscillator backs the higher low on prices with a higher low on the histogram.
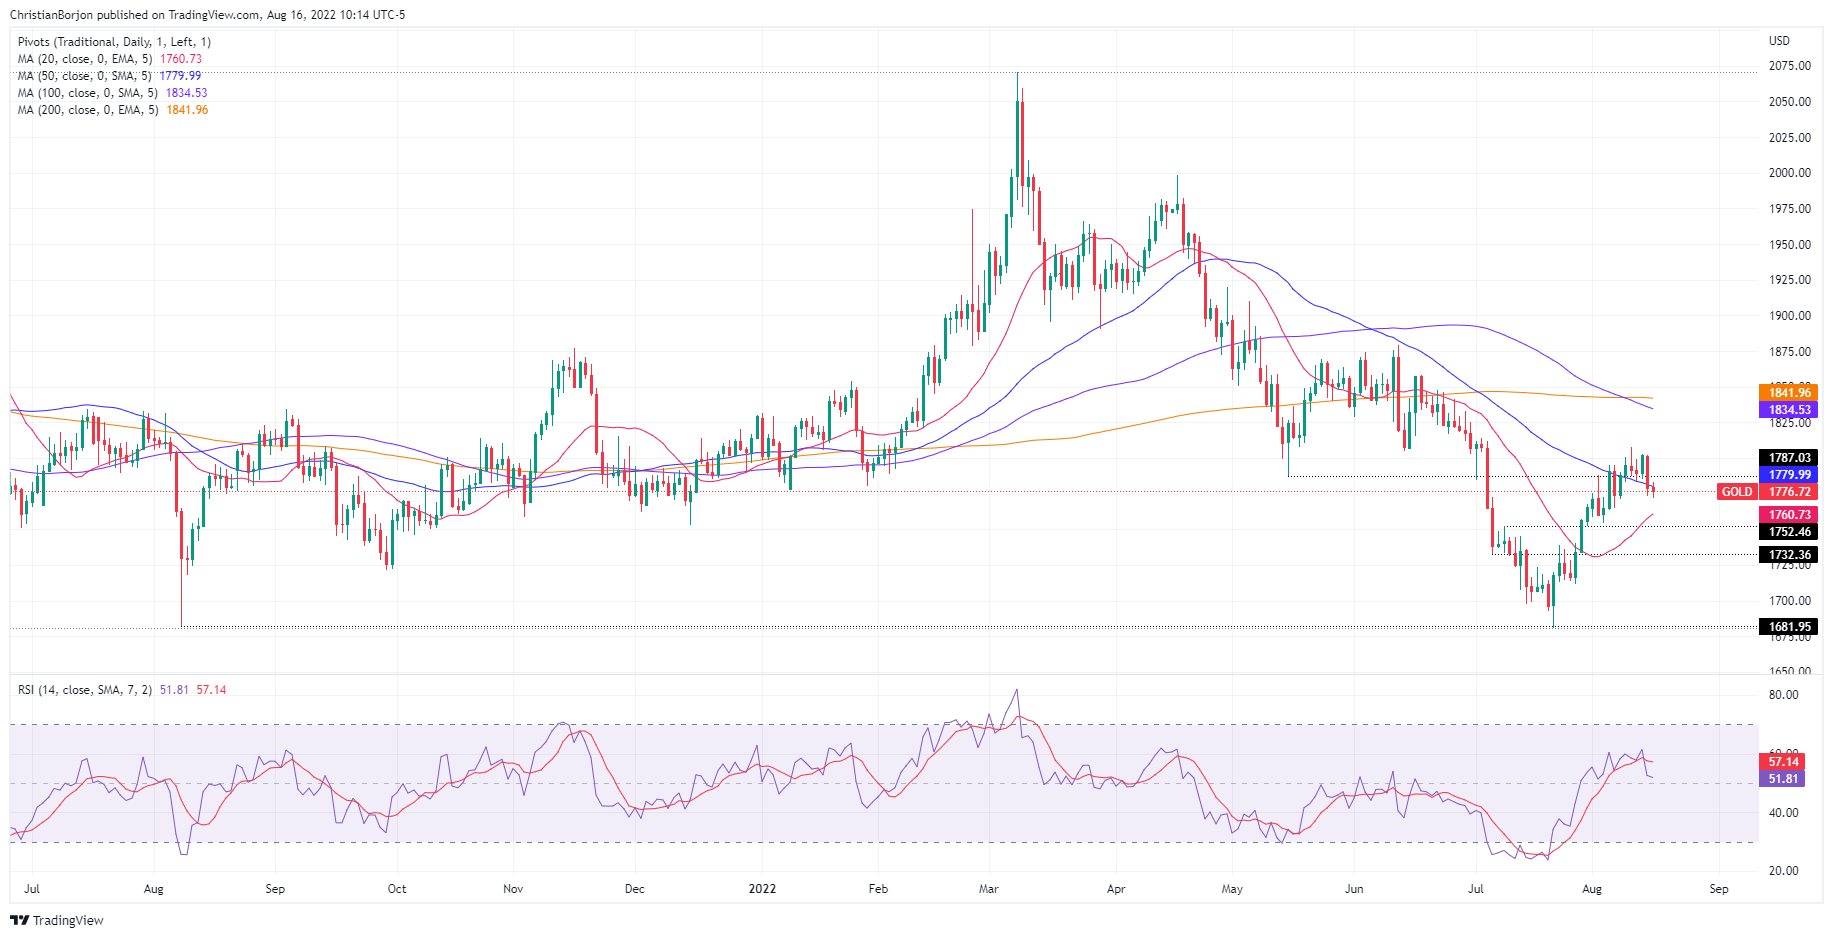
- Gold price holds lower ground near one-week low after two-day downtrend.
- Mixed sentiment, anxiety ahead of Fed Minutes kept XAU/USD on the back foot.
- Recession talks gained major attention, China, Europe in focus.
- FOMC Minutes will be eyed closely to confirm 75 bps rate hike in September.
Gold price (XAU/USD) prints a three-day downtrend as it grinds lower around $1,775 during the initial hours of Wednesday’s Asian session. In doing so, the precious metal fades the late Tuesday’s bounce off $1,772 as traders turn cautious ahead of today’s key Federal Open Market Committee (FOMC) meeting minutes.
That said, fears of economic slowdown, mainly emanating from China and Europe, join firmer Treasury yields and positive equities to confuse the traders. It’s worth noting that the US dollar also retreated amid the market’s indecision.
US Dollar Index (DXY) refreshed its three-week high before reversing from 106.94. The greenback’s gauge versus six major currencies previously benefited from the flight to safety as China’s readiness for multiple measures to tame recession woes joined Europe’s signals to renew the nuclear deal with Iran while pushing back plans for the closure of Germany’s last three nuclear power plants. On the same line was the Washington Post (WaPo) news that mentioned that Chinese authorities ordered factories to suspend production in several major manufacturing regions to preserve electricity, as the country face the worst heat wave in six decades.
Elsewhere, US Industrial Production grew 0.6% in July versus 0.3% expected and upwardly revised 0.0% prior whereas Building Permits also increased to 1.674M MoM during the stated month versus 1.656 market expectations and 1.696M previous readings. It should be noted that the Housing Starts dropped to 1.446M from 1.599M prior and 1.54M expected. On a different page, UK’s employment numbers failed to impress traders while Canada’s inflation matched consensus. Further, ZEW Sentiment data from Germany and Europe came in weaker for Economic Sentiment but improved a bit for Current Situation.
Amid these plays, Wall Street managed to close on a positive side, despite retreating by the end of the day. That said, the US 10-year Treasury yields snapped a two-day downtrend by regaining 2.80% at the latest.
Moving on, headlines surrounding China and inflation may entertain XAU/USD traders but major attention will be given to the Minute Statement wherein traders are more interested in the hints of a 75 basis point (bps) rate hike in September.
Also read: FOMC July Minutes Preview: Can it influence September Fed rate hike expectations?
Technical analysis
Gold defends the early week's downside break of the 50-day EMA amid steady RSI and receding bullish bias of the MACD, suggesting further weakness in XAU/USD prices.
That said, the 23.6% Fibonacci retracement of the April-July downtrend, near $1,755, is likely immediate support for the yellow metal.
Following that, multiple levels around $1,740 and $1,710 could entertain the commodity bears ahead of targeting the yearly low near $1,680.
Meanwhile, the 50-EMA level near $1,784 restricts the immediate upside of the gold price before the 38.2% Fibonacci retracement level near $1,803.
It’s worth noting, however, that a convergence of the 200-EMA, descending trend line from late April and a one-month-old upward sloping resistance line highlight $1,820-25 as the key hurdle for the bulls to cross to retake control.
Gold: Daily chart
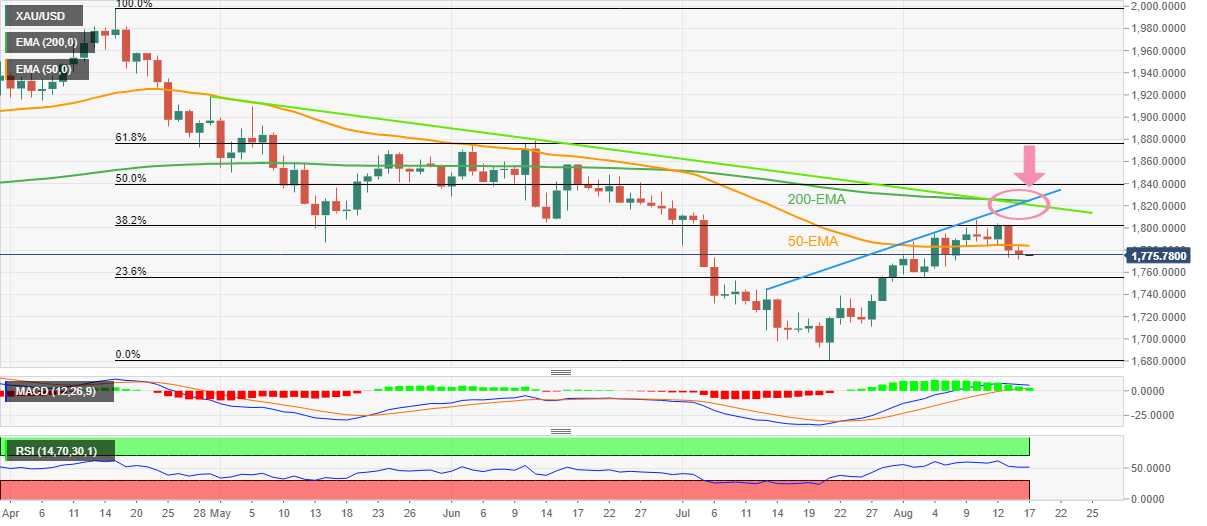
Trend: Further weakness expected
- GBP/JPY eradicates Monday’s gains and gained more than 1% on Tuesday.
- The GBP/JPY is downward biased, but Tuesday’s price action opened the door for further upside, targeting the 50-DMA at 163.86.
The GBP/JPY pares Monday’s losses and some more, forming a bullish-engulfing candle pattern, meaning buyers overcome sellers, reciaiming the 162.00 figure on its way north. However, solid resistance lies ahead of the current exchange rate, with the 20 and 100-day EMAs hovering around the 162.80-163.00 area. At the time of writing, GBP/JPY is trading at 162.39.
GBP/JPY Price Analysis: Technical outlook
The cross-currency pair is exchanging hands below the 20, 100, and 50-day EMAs, suggesting that the GBP/JPY is downward biased. Nevertheless, Tuesday’s rally towards the 162.80-163.00 area, although rejected, it opened the door for further gains. So from a technical perspective, a break above the latter will put the 50-day EMA at 163.086 in play, ahead of the July 27 high at 166.33.
On the flip side, the GBP/JPY first support will be the 162.00 mark. Once cleared, the next support will be the figure at 161.00, ahead of the August 16 low at 160.08.
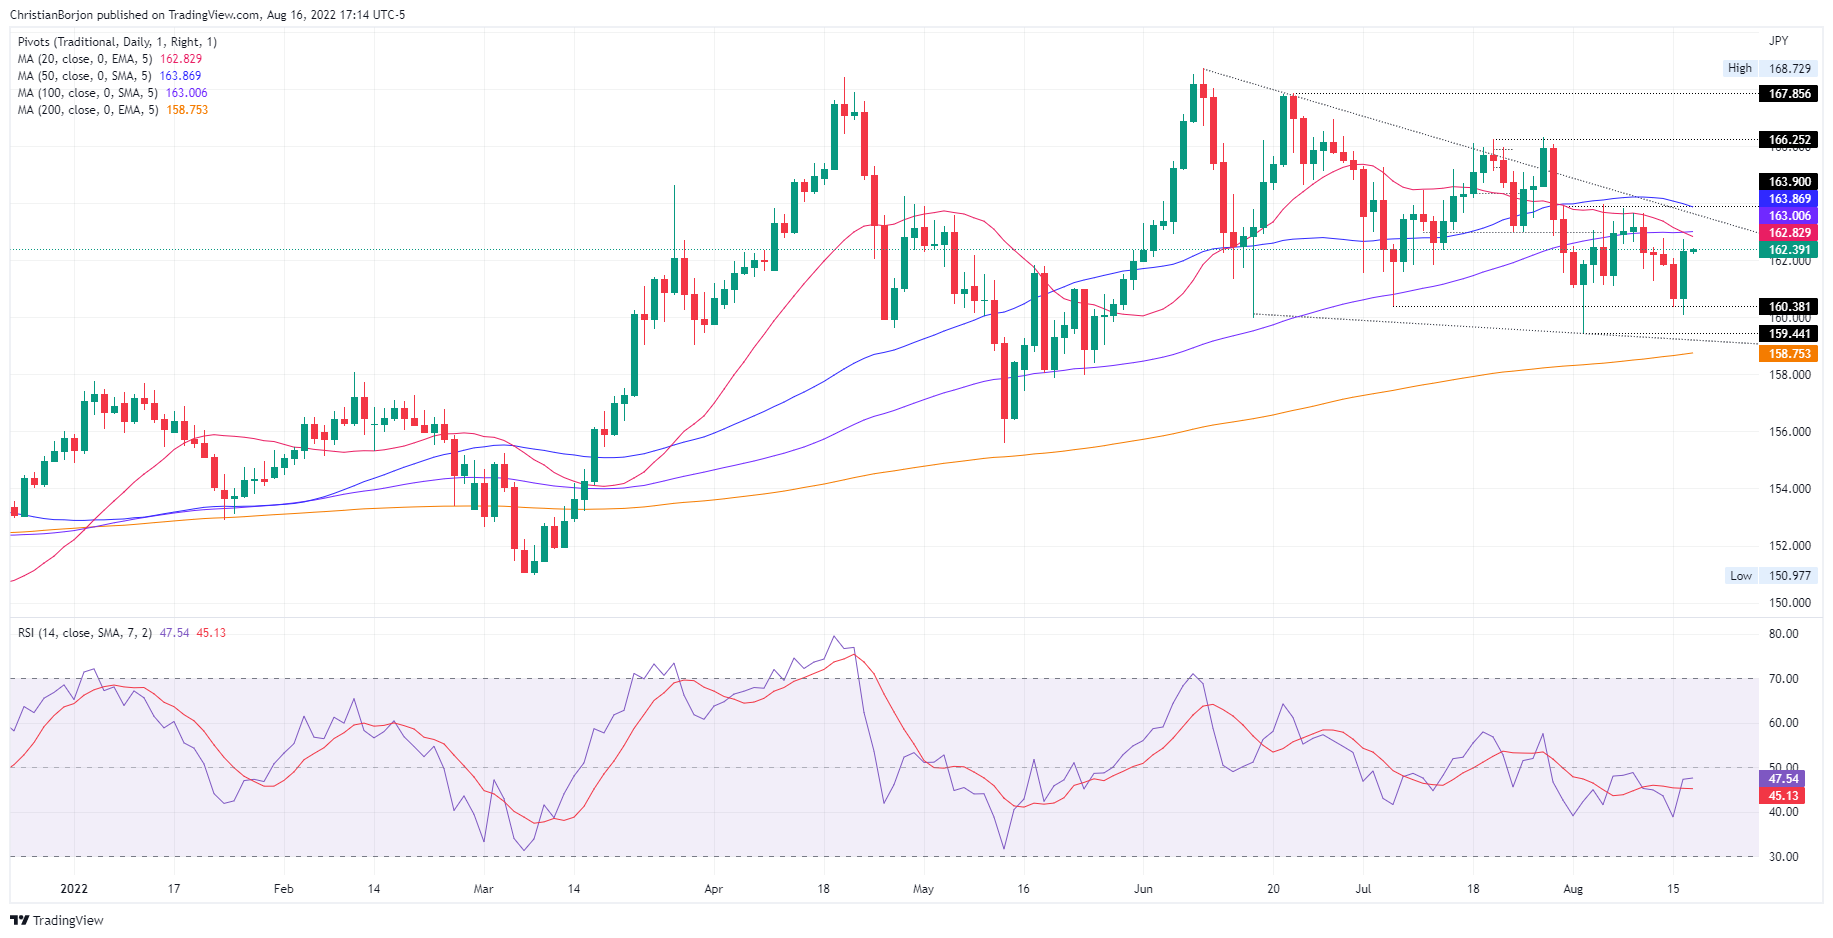
GBP/JPY Daily chart
GBP/JPY Key Technical Levels
- Western Texas Intermediate (WTI) drops almost 1%, extending its losing streak to three days.
- Mixed US data and weaker Industrial Production and Retail Sales from China keep producers uncertain of total oil requirements.
- The Iran nuclear deal agreement would free additional crude to the global market, a sign of lower energy prices.
US crude oil benchmark, known as WTI, drops to six-month lows on recession fears, alongside mounting speculation of an Iran deal, which would free more than 700K barrels per day to the battered oil market. In the meantime, Wester Texas Intermediate (WTI) exchanges hands at $87.15 PB, slightly down 0.80%.
Investors’ mood remains upbeat, with US equities posting recoveries, despite an ongoing deceleration in the US economy. Albeit US Industrial Production exceeded estimations to the upside, underpinned by motor vehicles and higher manufacturing output, US Building Permits and Housing Starts for August plunged into contractionary territory, courtesy of higher interest rate increases by the Federal Reserve.
Worth noting that the Atlanta Fed GDPNow for the third quarter (Q3) dropped from 2.5% to 1.8%, though slightly better than the Q2 advanced reading.
The factors abovementioned weighed in oil prices, with WTI further tumbling below the 200-DMA at $95.51. Additionally, Monday’s data from China revealed that Retail Sales and Industrial Production missed expectations, increasing uncertainty about oil’s demand.
Elsewhere, talks between Iran and the EU regarding the nuclear accord seem to be progressing. Sources cited by Bloomberg commented that the “potential for a deal is being priced in.” That said, volatility around the oil market should increase until a final announcement is made.
If Iran’s nuclear deal is approved, oil from Teheran would be seen as a relief to high energy prices, particularly consumers, which had been dealing with skyrocketing petrol and gasoline prices, with countries like the US battling inflation at 4-decade highs.
WTI Key Technical Levels
- EUR/USD was pressured overnight to below the trendline support.
- Bears seek a break of 1.0141 structure that would be expected to open up the downside.
EUR/USD is trading at 1.0166 after a day where the US dollar was little changed against a basket of currencies with key data events ahead including the US Retail Sales and minutes from the Federal Reserve's July meeting on Wednesday.
On the day, there was mixed economic data from the US with better than expected earnings data that led to a rally on Wall Street. US July industrial production data for the US was much stronger than expected rising 0.6% MoM – twice the expected increase. Meanwhile, US housing starts dropped 9.6% in July to 1446k indicating a sharp retrenchment in residential construction.
Investors will now be looking to the release of Federal Reserve minutes following the meeting where the centralbank hiked rates by 75bp for a second consecutive meeting in July, "expeditiously" reaching the milestone of a neutral stance. ''With that under the belt, Chair Powell made clear that the Fed will now abstain from offering forward guidance to the extent they did on their way to "neutral". However, we expect the minutes to offer further colour around the Fed's near-term plans,'' analysts at TD Securities said. Fed funds futures traders are currently pricing in a 60% chance of a 50 basis points increase and a 40% probability of a 75 basis points hike.
The greenback has bounced from a six-week low last week as investors ramp up bets that the Fed will continue to hike rates aggressively as inflation remains persistently high. DXY made a high of 106.943. In other data, US Retail Sales today will also offer new insight into the state of the consumer. It is expected to show that sales rose by 0.1% in July compared with June.
EUR/USD daily chart
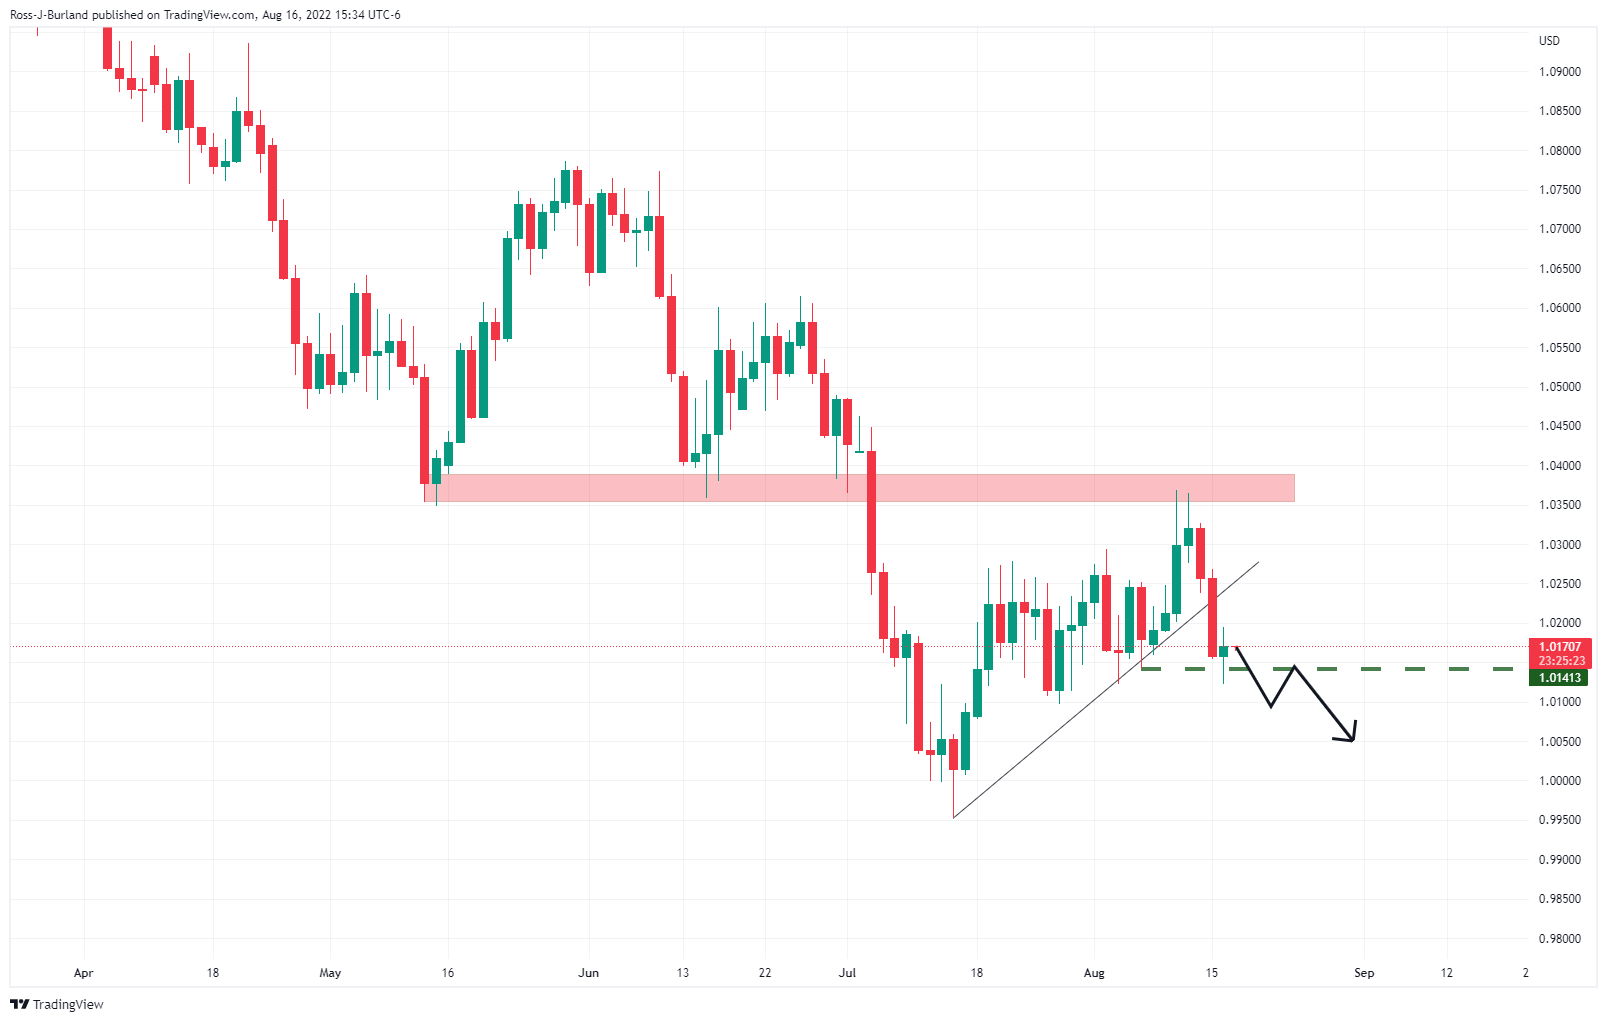
The price is being pressured below the counter trendline and a break of 1.0141 structure will be a significant development that would be expected to open up the downside.
- USD/CAD bears seek a break of the 4H 61.8% ratio to the downside.
- Bulls eye an extension towards 1.3000.
As per the prior analysis, USD/CAD Price Analysis: Bulls could be about to clean up, and USD/CAD Price Analysis: Bulls seeking a break of 1.2790/00, whereby it stated that ''a resurgence in the greenback would be expected to see USD/CAD rally in due course, the price indeed moved higher as follows:
The following is an update of the prior analysis:
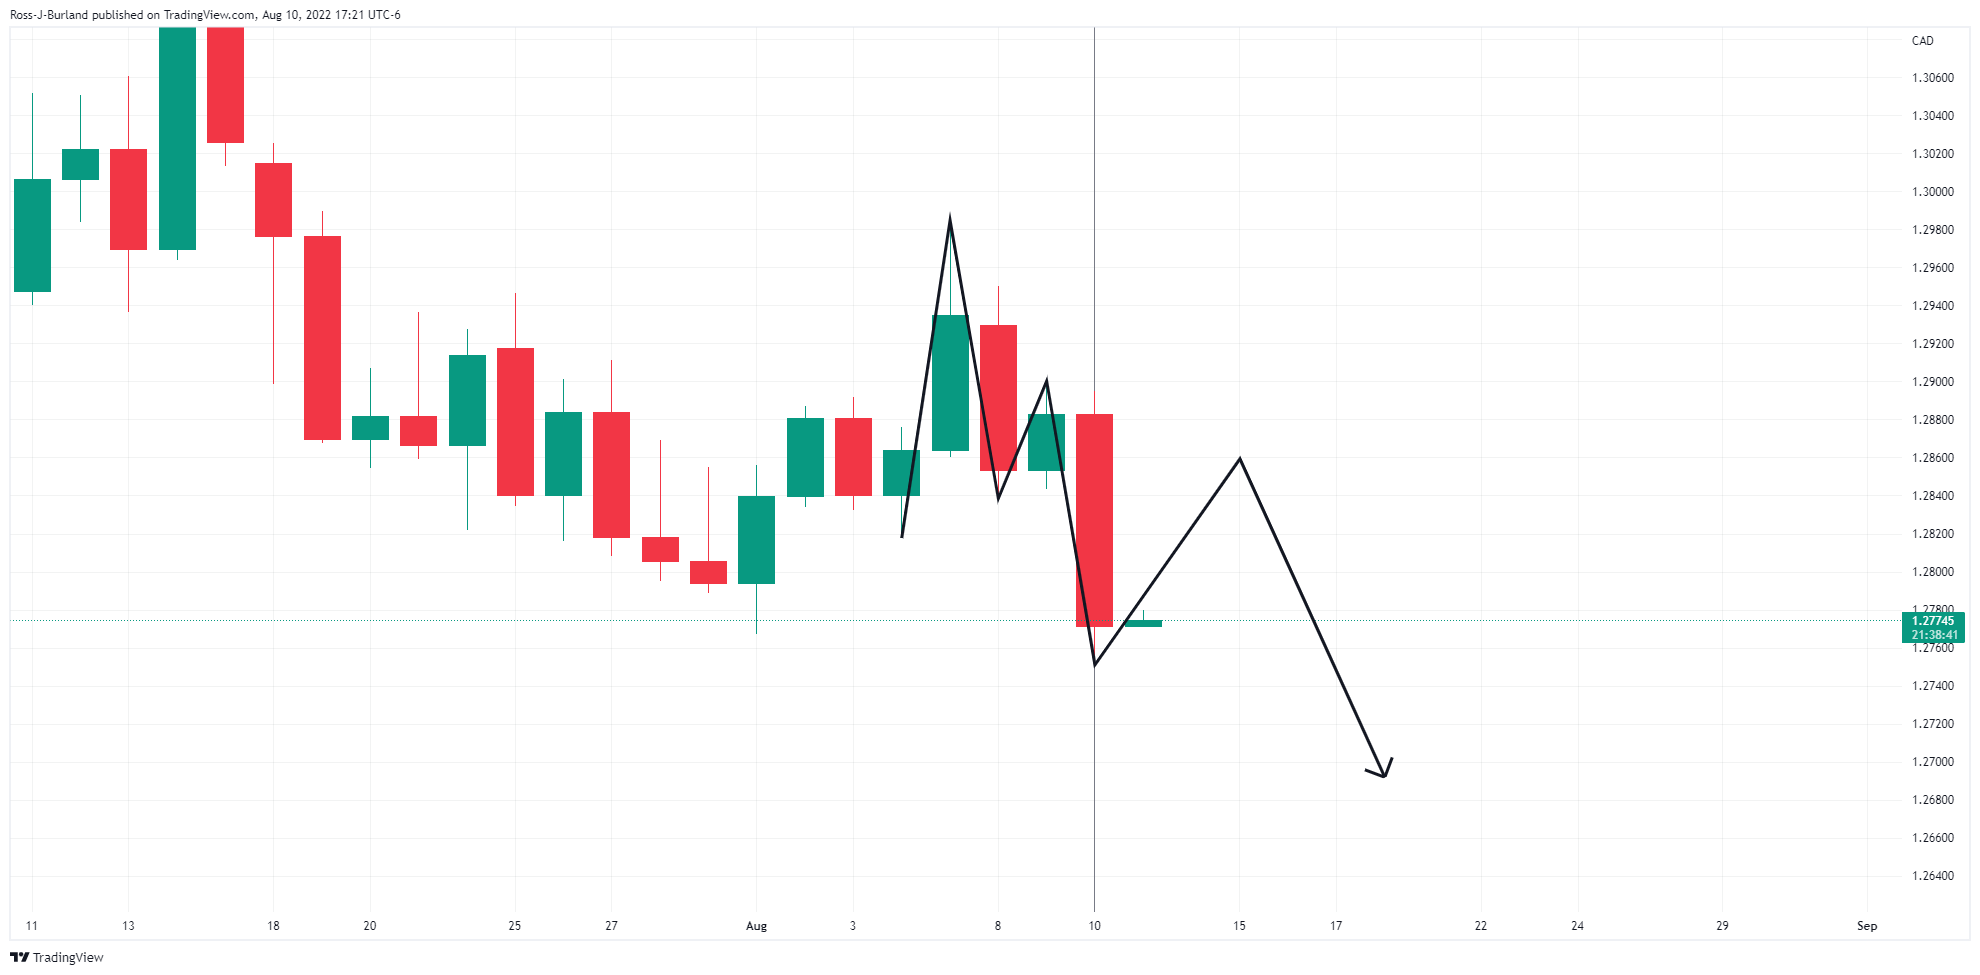
As illustrated, the price has rallied as anticipated but the bulls broke the neckline of the M-formation which sets up a bullish bias on the chart as shown above.
USD/CAD H4 chart
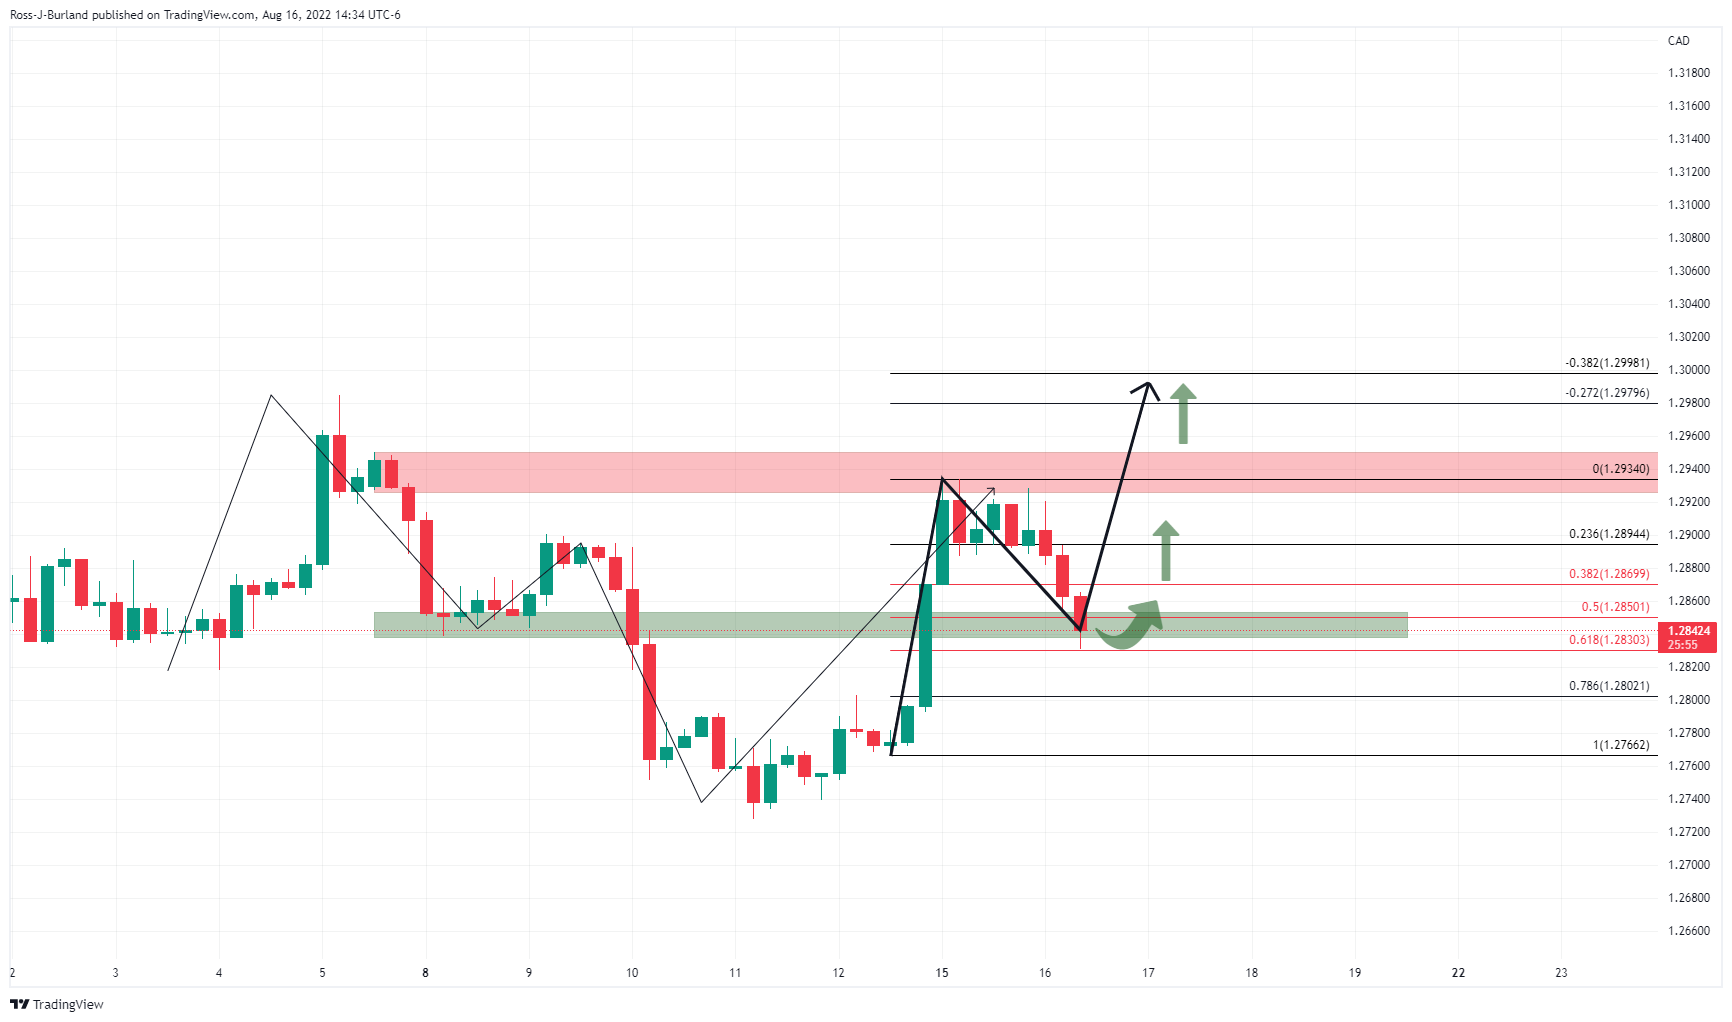
A break of the 61.8% ratio to the downside would be a significant move but while it holds, the bias is to the upside as per the chart above.
What you need to take care of on Wednesday, August 17:
Caution prevailed on Tuesday, with the focus still on a potential global recession. The dollar maintained its dominance despite a short-lived knee-jerk at the beginning of the American session.
The EUR/USD pair extended its weekly decline to 1.0121, ending the day at around 1.0160. The European energy crisis remains in the eye of the storm as the Union aims to reach a nuclear deal with Iran. Meanwhile, Germany has plans to postpone the closure of the country’s last three nuclear power plants.
GBP/USD trades around 1.2090 following the release of unimpressive UK employment data. The ILO unemployment rate held steady at 3.8% in the three months to June,
The USD/CAD pair edged lower, ending the day at 1.2840. Bank of Canada Governor Macklem said inflation may have peaked after the country released the July Consumer Price Index, which rose by less than anticipated.
AUD/USD finished the day unchanged at around 0.7020.
The greenback appreciated against safe-haven rivals, with USD/CHF trading at around 0.9500 and USD/JPY around 134.20.
Gold eased modestly, now changing hands at $1,777 a troy ounce. Crude oil prices were firmly down, and WTI trades at $86.30 a barrel.
Treasury yields advanced, and the yield curve remains inverted. The yield on the 10-year note currently stands at 2.81%.
Wall Street is mixed, with the DJIA posting substantial gains, the S&P 500 modestly up, and the Nasdaq Composite shedding some ground.
The macroeconomic calendar will turn more interesting on Wednesday, with Australian wages figures, EU GDP and US FOMC Meeting Minutes.
Top 3 Price Prediction Bitcoin, Ethereum, Ripple: No FUD, just charts
Like this article? Help us with some feedback by answering this survey:
- NZD/USD drops during the day by some 0.36% as investors prepare for the RBNZ.
- Mixed US economic data reignited recession fears in the US.
- The RBNZ is expected to hike the OCR by 50 bps to 3% on Wednesday.
The NZD/USD tumbles in the North American session, due to broad US dollar strength, despite a risk-on impulse in the financial markets, after US economic data came mixed, so recession fears reemerged. At the time of writing the NZD/USD is trading at 0.6341, down 0.35%.
US equities reflect investors’ upbeat mood, courtesy of positive US data. Industrial Production for July increased at a 0.6% MoM pace, exceeding estimations, underpinned by motor vehicle sales. Even though the news was positive, the Building Permits and Housing Starts missing estimations, recording negative prints, put a cap on higher US dollar prices.
Therefore, the NZD/USD trimmed some of its earlier losses after hitting a daily low at 0.6316. However, a monetary decision of the Reserve Bank of New Zealand (RBNZ) looming keeps NZD/USD buyers hopeful of higher prices, with expectations of a 50 bps hike fully priced in.
According to a Reuters poll, the RBNZ is expected to increase the Overnight Cash Rate (OCR) by 50 bps to 3.00%, which would be its most aggressive tightening since 1999.
Also read: RBNZ Preview: Forecasts from five major banks, all eyes on future policy path
In the meantime, five major banks, in their previews, expect that the RBNZ will hike rates by 50 bps on Wednesday, but there are some differences regarding the forward guidance the bank will use.
ANZ and Westpac expect a hawkish commentary, and the central bank would clearly communicate that the fight against inflation is well underway.
Bank of America estimates that guidance would remain hawkish, but they expect the bank to add “conditionality” on the scale of following rate hikes. Additionally, expect the bank to acknowledge that growth is softening.
TDS estimates the bank will emphasize that inflation risks are skewed to the upside and should dominate the RBNZ’s communication. Contrarily, ING estimates the bank would hike 50 bps but suggests the RBNZ “will have to revise its rate path projections lower.”
What to watch
On Wednesday, the Reserve Bank of New Zealand will unveil its monetary policy decision. On the US front, the docket will feature US Retail Sales, FOMC’s July minutes, and Fed speaking.
NZD/USD Key Technical Levels
- Gold is pressured below a key daily counter-trendline.
- The US dollar is carving out a move to the upside as recent data has reignited global recession fears.
The gold price is under pressure by some 0.15%, sliding from a high of $1,783.19 to a low of $1,771.52 on Tuesday as the safe-haven US dollar hit a one-week high after weak global economic data, particularly in China. The data has reignited global recession fears.
Figures for Industrial Production, Retail Sales and fixed asset investments, as released by the National Bureau of Statistics, came in below expectations in July. Additionally, worries about a more pronounced cooling rose from a surprising rate cut by the Chinese central bank, PBoC. The unexpected decision to cut has given the impression that the PBoC is alarmed about the extent of economic weakening as it tries to revive credit demand to support the COVID-hit economy after a string of weak economic data releases for July.
US Treasury yields rose due to the recession worries with the Federal Reserve expected to continue with steep rate hikes despite nascent signs of a slowdown in inflation. Several Fed policymakers have spoken of the need for continued rate hikes despite the lower-than-expected outcome of last week's Consumer Price Index. "Fed officials have no choice but to sound tough in the face of a very, very tight labour market and far too high inflation," Kit Juckes, the head of FX strategy at Societe Generale argued. "It's hard to build a compelling case to sell the dollar in that world."
''While Chair Powell catalyzed a Fed pivot narrative at the latest FOMC, particularly as the latest print in inflation pointed to cooling pressures, price action in Treasuries supported a rally across all assets,'' analysts at TD Securities said. The yield curve between 2-year and 10-year Treasury notes remained inverted at minus 38.60 basis points on Tuesday. This is viewed as an indicator of an impending recession. The DXY, an index that measures the greenback vs. a basket of currencies reached a peak of 106.94 in early European trading, recovering from the losses that were made on the back of lower-than-expected US inflation data. The index was last seen slightly in the green at 106.52.
Meanwhile, ''odds of a short squeeze in gold are notably declining,'' the analysts at TDS argued. ''However, our CTA positioning estimates suggest that a trend followers buying program contributed to lower rates over the past month, as algos were forced to cover shorts. While this supported higher prices in gold, the bar is razor thin for algorithmic trend followers to add to selling pressures in US10y Treasuries once more,'' the analysts said.
''This should further sap appetite to buy the yellow metal, while the bar for additional short covering rises further. Meanwhile, Shanghai traders are also likely to appear on the offer, particularly amid a weakening CNY. Gold prices are vulnerable, considering we see signs that gold sellers are lurking. Ultimately, prop traders are still holding a massive amount of complacent length, suggesting we have yet to see capitulation in gold, which argues that the pain trade remains to the downside.''
Gold technical analysis
The price of the US dollar is taking on a resistance level that guards a continuation higher on the daily chart above. Below, gold is carving out a bearish case below the counter trendline on the daily chart as follows:
- USD/JPY bounces off weekly lows around 132.50, underpinned by high US bond yields.
- The major faces solid resistance around 134.50-65; once cleared, a jump to 135.00 is on the cards.
- In the near term, a USD/JPY pullback towards the 133.50-60 area is on the cards before resuming upwards.
The USD/JPY jumps from around weekly lows to a crowded resistance area, with the 20-day EMA at 134.62, alongside a downslope resistance trendline, drawn from July tops (also the YTD highs), which passes near the 20-DMA. At the time of writing, the USD/JPY is trading at 134.27.
USD/JPY Price Analysis: Technical outlook
From a daily chart perspective, the major bias is neutral-upward biased, but a wall of resistance is emerging ahead of the 135.00 figure. However, the RSI crossing above its 7-day RSI SMA, also about to cross over the 50-midline, illustrates buying pressure is mounting on the pair. That, alongside higher US Treasury bond yields, can underpin the USD/JPY towards higher prices.
Therefore, the USD/JPY’s first resistance would be the 20-day EMA. Once broken, its next resistance would be the 135.00 figure, followed by a test of the August MTD high at 135.58.
Zooming into the one-hour scale, the USD/JPY is upward-biased, but in the last hours, the pair retraced due to RSI’s entering overbought conditions. Hence, the major might print a leg down before resuming the higher-time frame uptrend towards 135.00 and beyond.
Therefore, the USD/JPY first support would be the 50% Fibonacci retracement at 133.81. Break below will expose the confluence of the 50-day EMA and the 61.8% Fibonacci retracement at 133.50-60. After that, the USD/JPY might resume upwards, towards the August 9 daily high at 135.30.
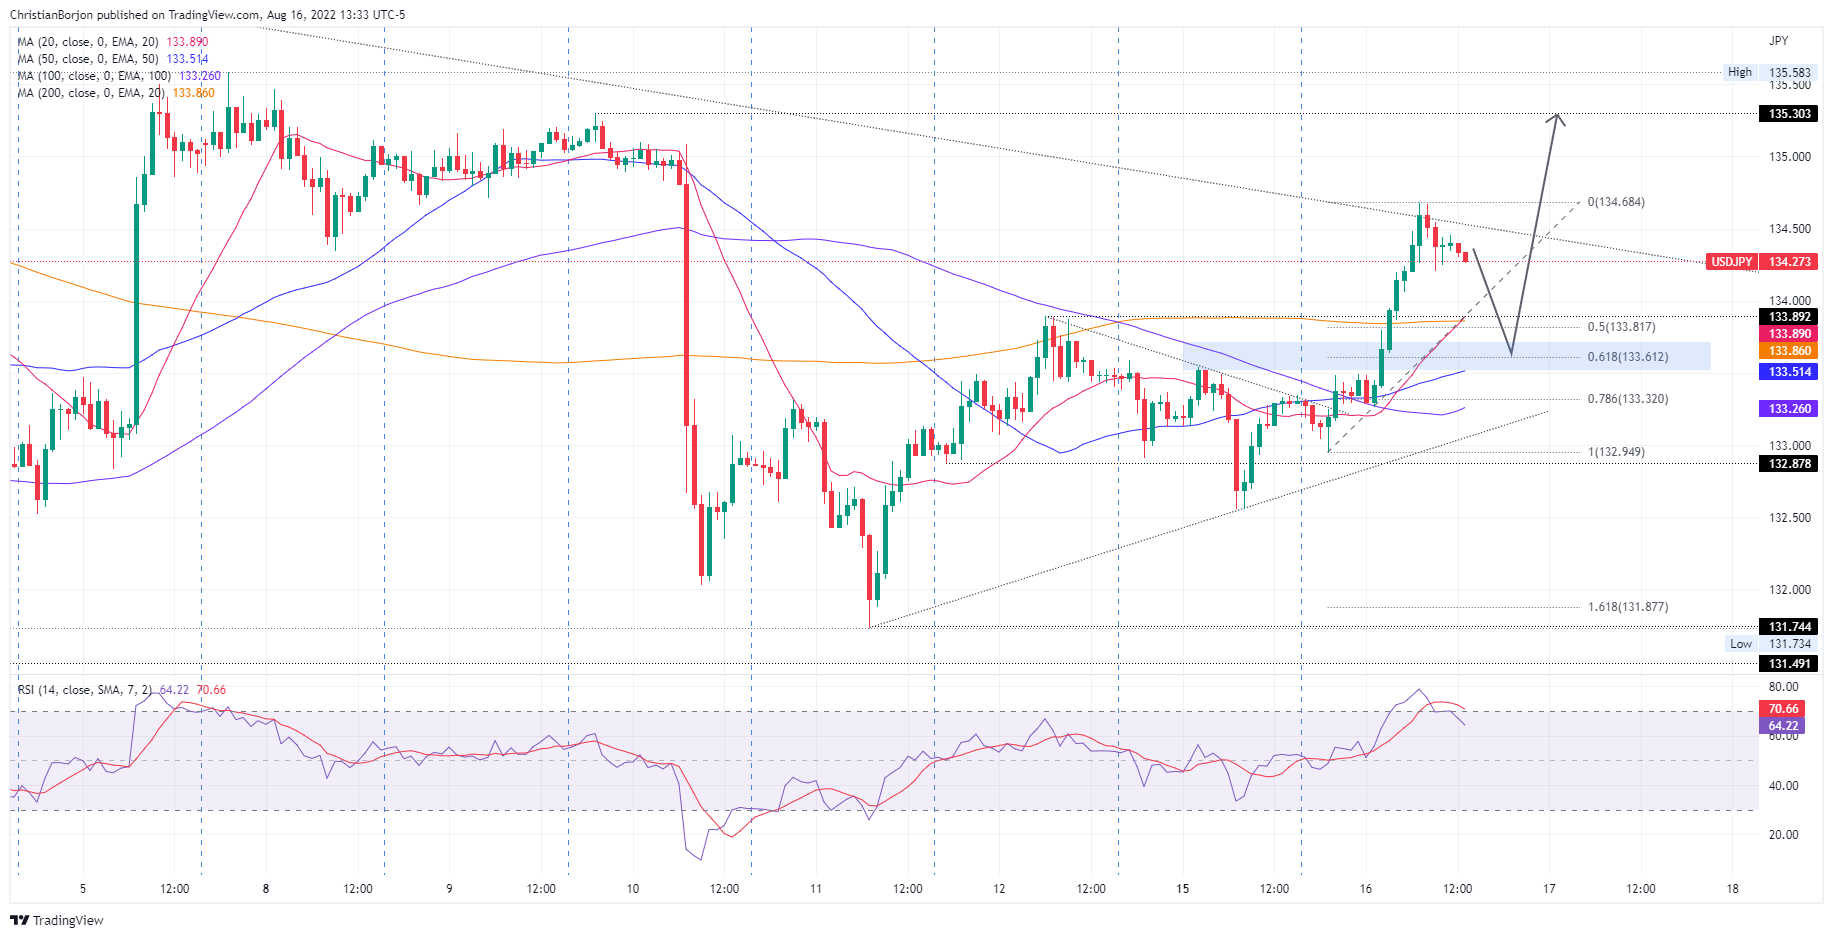
USD/JPY Hourly chart
USD/JPY Key Technical Levels
- AUD/USD bulls move in to put the Aussie into the green for the day.
- China and recession worries flared up a flight to the US dollar.
AUD/USD has been pressured on Tuesday after weak global economic data, particularly in China, reignited global recession fears. The safe-haven US dollar has benefitted in the forex space and it hit a one-week high while risk-friendly currencies such as the Australian dollar have taken the brunt. At 0.7027, AUD/USD is in the green by some 0.01%, after falling from a high of 0.7040 to mark a low of 0.6991 before recovering in midday US trade.
Fears of a significant slowdown of the Chinese economy put a dampener on the commodity markets and the Australian dollar took a knock on lower demand for iron ore and other assets from China. Figures for Industrial Production, Retail Sales and fixed asset investments, as released by the National Bureau of Statistics, came in below expectations in July. Additionally, worries about a more pronounced cooling rose from a surprising rate cut by the Chinese central bank PBoC. The unexpected move gave the impression that the PBoC is alarmed about the extent of economic weakening as it tries to revive credit demand to support the COVID-hit economy after a string of weak economic data releases for July. Australia's close trade ties with China mean traders sometimes treat its currency as a liquid proxy for China's yuan.
In the US, Treasury yields rose due to the recession worries and along with the concerns that the Federal Reserve will continue its steep interest rate hikes despite nascent signs of a slowdown in inflation. Several Fed policymakers have spoken of the need for continued rate hikes despite the lower-than-expected outcome of last week's Consumer Price Index.
Additionally, the yield curve between 2-year and 10-year Treasury notes remained inverted at minus 38.60 basis points on Tuesday. This is viewed as an indicator of an impending recession. The dollar index DXY meanwhile hit a peak of 106.94 in early European trading, recovering from the losses that were made on the back of lower-than-expected US inflation data. The index was last seen flat at 106.46.
"Fed officials have no choice but to sound tough in the face of a very, very tight labour market and far too high inflation," Kit Juckes, the head of FX strategy at Societe Generale argued. "It's hard to build a compelling case to sell the dollar in that world."
Meanwhile, the minutes from the Reserve Bank of Australia’s (RBA) August policy meeting showed that the Board of the central bank expected further rate hikes given inflation was far above target and the labour market at its tightest in decades. There will be more from the labour market this week where analysts at TD Securities said ''wages growth may accelerate in Q2 as firms face record labour constraints while workers may demand higher base wages with inflation at a 21-year high.'' The analysts added ''July is a seasonally strong month for job gains and we look for the unemployment rate to trend lower. Another strong labour print should give the RBA the assurance that the economy can withstand a cash rate of 3% by end-2022.''
AUD/USD technical analysis
The hourly chart has left behind a W-formation that pulled the price into the neckline before the bulls moved in again. The price would be expected to move higher to mitigate inefficiencies on the lower time frames before reaching the resistance for a test of the 0.7030s.
On the 15-min time frame, there are a few imbalances of price to the downside that could be mitigated prior to a test towards the resistance area. The neckline of the W-formation aligns with a price imbalance near 0.7012.
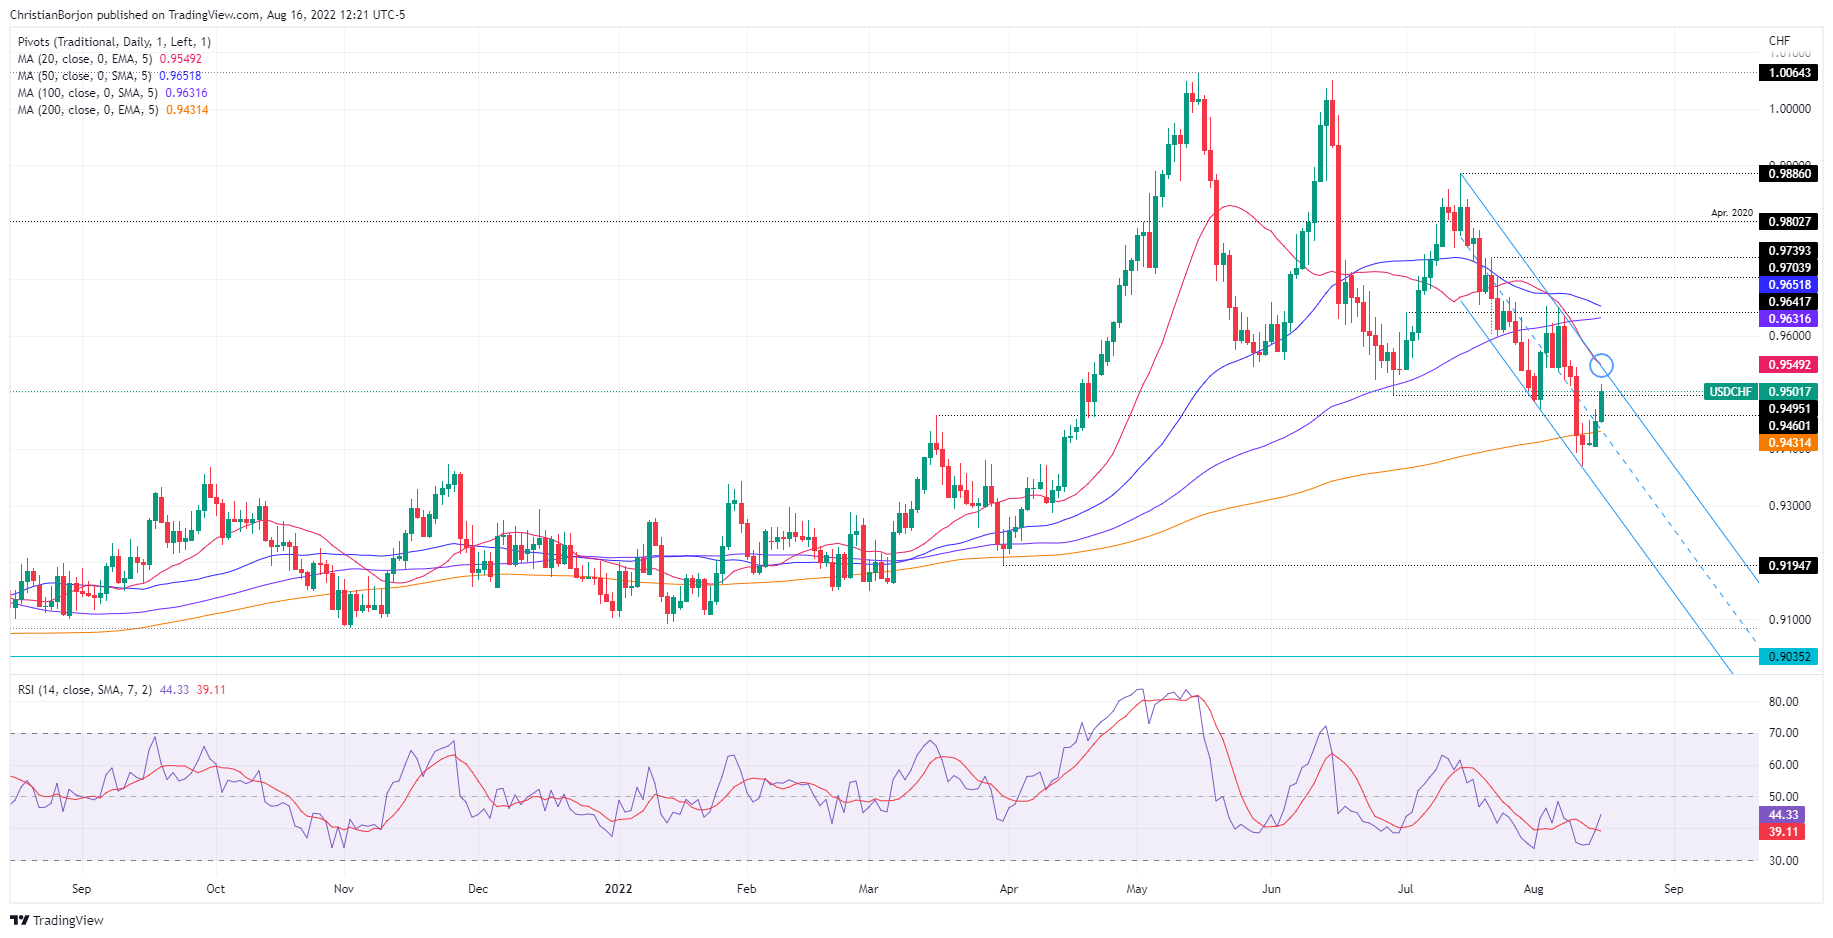
- USD/CHF extends its weekly gains and erases last week’s losses, up by 1%.
- The USD/CHF aims higher and could test the 20-day EMA; otherwise, further losses will extend towards 0.9400.
The USD/CHF climbs for the second straight day, widening the gap between the 200-day EMA and the exchange rate, courtesy of broad US dollar strength, underpinned by high US T-bond yields, in the mid-North American session. At the time of writing, the USD/CHF is trading at 0.9501, up by 0.55%.
USD/CHF Price Analysis: Technical outlook
The USD/CHF is about to test the top-trendline of a descending channel. It’s worth noting that albeit a successive series of lower highs/lows confirm the pair is in a downtrend, sellers’ failure to capture the 200-day EMA at 0.9431 exposed the pair to buying pressure. Therefore, the USD/CHF edged higher, from around multi-month lows below 0.9400, towards current price levels.
If USD/CHF buyers would like to reclaim control, they need a break above the top trendline of the channel, which also intersects with the 20-day EMA at 0.9549. Once cleared, that would pave the way towards the 100-day EMA at 0.9631, followed by the 50-day EMA at 0.9651.
On the other hand, if the major tumbles and closes below 0.9500, that could pave the way for further losses. Hence, the USD/CHF first support would be the August 16 low at 0.8445, followed by the 200-day EMA at 0.9431 and the MTD low at 0.9370.
USD/CHF Daily chart
USD/CHF Key Technical Levels
- GBP/USD marches firmly towards the confluence of the 20/50-DMA around 1.2110.
- US Industrial Production surprises to the upside, while housing data continues to worsen.
- UK employment figures were better-than-expected, further cementing the case for a 50 bps BoE rate hike.
The GBP/USD snaps three days of losses and approaches the 1.2100 figure as the greenback begins to weaken, in the middle of the North American session, courtesy of resurfacing recession fears with US data showing signs of an economic slowdown.
The GBP/USD is trading at 1.2081, after hitting a daily low at 1.2007, during the European session, but bounced back on modest UK employment figures and reclaimed the 1.2050 area.
Data-wise, the US Federal Reserve reported that Industrial Production for July rose by 0.6% MoM, underpinned by motor vehicles, propelled by easing supply chain disruptions. Before Wall Street opened, July’s Building House Permits and Housing Starts plummeted, indicating the ongoing deterioration in the housing market, spurred by higher mortgage rates.
Alongside that, Monday’s New York Fed Empire State Manufacturing Index for August dropped to the contractionary territory at -31.1 headline, less than 5 estimated.
The GBP/USD reacted to that, pushing through the 20-day EMA, extending its gains, and hitting a daily high at 1.2117.
On the UK side, employment data was better than estimated, with Claimant Count Change, falling by 10K, better than the 32K estimated, while the Unemployment Rate stood at 3.8%. Even though data shows signs of a robust labor market, the Bank of England is expected to lift rates at their next meeting by 50 bps, regardless of projecting that the UK’s economy might tap into a recession late in the year.
Elsewhere, the political spectrum has not been a driver of the British pound. However, the upcoming election in September might increase volatility in the GBP/USD, and depending on who is elected as Prime Minister; we would likely see the pair’s first reaction to that.
What to watch
On Wednesday, the UK economic calendar will feature the Retail Price Index and inflation figures in consumer and producer side sources. The US docket will reveal Retail Sales for July, alongside the FOMC’s last meeting minutes and Fed speeches.
GBP/USD Key Technical Levels
According to the Federal Reserve Bank of Atlanta's GDPNow model, the US economy is expected to grow at an annualized rate of 1.8% in the third quarter, down from 2.5% in the previous estimate.
"After recent releases from the US Department of the Treasury's Bureau of the Fiscal Service, the US Bureau of Labor Statistics, the US Census Bureau, and the Federal Reserve Board of Governors, a decrease in the nowcast of third-quarter real gross private domestic investment growth from 0.2% to -3.6% was slightly offset by an increase in the nowcast of third-quarter real government spending growth from 1.7% to 2.0%," Atlanta Fed explained in its publication.
Market reaction
The US Dollar Index largely ignored this report and was last seen posting small daily gains at 106.58.
On Wednesday, inflation data is due in the United Kingdom. Analysts at Well Fargo, expect the CPI to show an increase of 0.4% in July in line with market consensus. According to them, the British economy has not yet experienced peak inflation and they believe CPI is likely to trend closer to 10%.
Key Quotes:
“U.K. inflation is currently the highest on record, with the June CPI hitting 9.4% year-over-year. While core inflation dipped slightly in June, the core CPI is running close to 6% year-over-year, a signal of broad price pressures across the entire economy. Around the world, we have gotten preliminary evidence that inflation may be peaking; however, those dynamics may not apply to U.K. CPI. Contrary to the U.S., we believe U.K. inflation rose in July and the British economy has not yet experienced peak inflation.”
“European energy prices continue to move higher as a result of limited exports from Russia and supply shortages across the continent. As inflation rockets higher, we believe the U.K. economy will be one of the first major economies to tip into recession by the end of this year. Q2 GDP data reveal the recession may be imminent as the economy contracted in the second quarter. Bank of England policymakers also forecast a recession lasting through 2023 due to energy shortages and more aggressive tightening.”
The annual inflation rate in Canada dropped from 8.1% to 7.6% as expected. Despite the slowdown analysts at CIBC consider the Bank of Canada (BoC) is probably keeping a close eye on inflation ex food/energy these days that showed an acceleration, “not good news for the Bank, which should still be on track for a 75bps increase in rates at its next meeting.”
Key Quotes:
“Canadian inflation has taken its foot off the gas, but other elements in July’s inflation story were not as reassuring. Headline CPI inflation decelerated to 7.6% year-over-year in July on a much smaller 0.1% month-over month increase, roughly in line with consensus expectations. As expected, gasoline prices were the main driver of the slowdown. In what is bad news for consumers, food prices resumed their climb in July after taking a pause in June.”
“CPI inflation excluding food and energy spelled further trouble with an increase of 0.5% on a seasonally adjusted basis. Prices for services impacted by the pandemic, such as hotels, air transportation and restaurants all increased.”
“While inflation seems to finally have started its long descent, the acceleration in inflation excluding food and energy will be a concern for the Bank of Canada. With gasoline prices set to decline further in August, so should headline CPI, but that is not what the Bank will be watching. The focus should be on shelter prices (outside of mortgage costs), which should decelerate with the cooling housing market, and overall service inflation. For now, the Bank of Canada remains on track for a 75 bps increase at its September rate decision.
Data released on Tuesday showed Industrial Production rose 0.6% in July in the US, surpassing expectations. Analysts at Wells Fargo point out that the jump in industrial production was due largely to a surge in auto production but also came with upward revisions that lessened the June decline in manufacturing output. They consider sustained production growth will require continued demand for durable goods and improvement in supply chains; “both look iffy at the moment”.
Key Quotes:
“Industrial production notched a solid 0.6% increase in July. The non-manufacturing output measures more-or-less canceled one another out. Mining output rose 0.7% and utilities output sank 0.8%. So the headline gain is mostly a function of what happened in terms of factory output.”
“The auto industry has been particularly affected by these struggles and even as the economy cools, there is still pent-up demand for certain vehicle models.”
“Other manufacturing data point to slower activity ahead. The new orders component of the ISM manufacturing index slipped further into contraction territory in July, and this component tends to track industrial production relatively well.”
“We continue to expect manufacturing activity will hold up a bit better than other parts of the economy, but we see a slower pace of activity ahead. Thawing supply chains could help facilitate easier production, but a full normalization still looks a ways off. The dent to optimism from mounting recession fears, a pullback in consumers' demand for goods and tighter financial conditions will all also likely pressure businesses desire for capital outlays.”
Commenting on the Wall Street Journal report claiming that Germany was planning to postpone the closure of nuclear power plants, a spokesperson for the German economy ministry said that the media report was lacking a factual basis.
The German government will make a decision on whether to keep the last nuclear power plants running following the results of ongoing stress tests on electricity stability, the spokesperson further explained, as reported by Reuters.
Market reaction
These comments don't seem to be having a significant impact on the shared currency's performance against its rivals. As of writing, EUR/USD was up 0.1% on the day at 1.0170.
- US Dollar loses momentum during the American session amid risk appetite.
- EUR/USD turns positive after hitting the lowest level since August 3.
The EUR/USD rose more than 50 pips from the weekly low it reached earlier at 1.0121. The euro printed a fresh daily high at 1.0194 and then pulled back modestly. The move higher was supported by a weaker dollar amid risk appetite.
The DXY is flat after erasing gains. The Index hit two-week highs near 107.00 and then dropped back toward 106.50. In Wall Street, the Dow Jones is up by 0.73% and the S&P 500 climbs 0.28%. US yields are modestly higher, keeping the dollar’s retreat limited. Economic data from the US came in mixed. Industrial Production rose above expectations in July (0.6% vs 0.3%) while Housing Starts tumbled 9.6%.
Technical outlook
The EUR/USD found support above 1.0120/25, like last week. While above losses seem limited for the euro. The bias in the short-term still points to the downside with price under key moving averages in four hours and daily chats. The critical support level continues to be 1.0100 with a consolidation below exposing the parity.
On the upside, immediate resistance is seen at 1.0200 followed by 1.0215 (20-day Simple Moving Average) followed by 1.0270/80.
Technical levels
In a policy U-turn, the German government plans to keep the last three nuclear power plants operational, the Wall Street Journal reported on Tuesday.
After having shut down three of the six remaining power plants back in January, German economy and environment ministers reaffirmed in March that the costs and risks of keeping nuclear facilities open outweighed the limited benefits. The last three nuclear power plants were scheduled to go offline in December.
Market reaction
There was no immediate market reaction to this headline and the EUR/USD pair was last seen posting modest daily gains at 1.0175.
The United States has received, through the European Union, Iran's comments on the EU's nuclear proposal and is studying them, a spokesperson for the State Department said on Tuesday, as reported by Reuters.
Market reaction
Crude oil prices fell sharply on this development and the barrel of West Texas Intermediate was last seen losing 0.8% on the day at $87.20.
In case the US and Iran reach an agreement to revive the 2015 nuclear deal, Iranian gas and oil supply could enter the markets via the removal of sanctions.
- Gold price is falling on high US yields and a risk-on impulse.
- US housing data keeps worsening, adding to Monday’s NY Fed Manufacturing Index, which reignites recession fears.
- Investors are eyeing the last meeting FOMC minutes on Wednesday and further Fed speakers.
Gold price slides due to an uptick in US bond Treasury yields, amidst a mixed market sentiment, with EU and US equities split between gainers and losers as the North American session begins. Meanwhile, mixed US economic data keeps traders assessing the US economic outlook in the near-to-medium term. At the time of writing, XAU/USD is trading at $1776.72 a troy ounce.
XAU/USD slides on high US bond yields amidst mixed US data
Gold is pressured by a slight improvement in sentiment. In the meantime, Industrial Production in the US rose for the first time in three months, 0.6% MoM reading, underpinned by motor vehicles, which benefitted from improvements in chip supplies. Earlier, Building Permits and Housing Starts plunged, each decreasing by -1.3% MoM and -9.6% MoM, respectively, signaling that increases in the Federal funds rate (FFR) are taking their toll on the housing market.
Besides, a dismal reading in Federal Reserve’s Regional Banks, led by the NY Fed Empire State Index, paints a battered picture of an upcoming US recession.
Aside from this, US Treasury Yields, a headwind for the yellow metal price, are rising, led by the short term of the curve. The US 10-year T-bond yield is at 2.851%, up six basis points, erasing Monday’s losses.
Meanwhile, the US Dollar Index, a gauge of the greenback’s value vs. a basket of peers, is almost flat at 106.473, slightly down 0.02%,
What to watch
The US economic docket will feature the Federal Reserve Open Market Committee minutes from their last meeting and Fed speaking, led by Kansas City Fed’s Esther George and Minnesota Fed’s Neil Kashkari.
Gold Price Analysis (XAU/USD): Technical outlook
From a daily chart perspective, XAU/USD is neutral biased, clinging underneath the 50-day EMA at $1780. It’s worth noting that the RSI points downwards, closing to the 50-midline, and the 100-day EMA crossed below the 200-day EMA, which could exacerbate a lower move. Nevertheless, unless sellers reclaim the 20-day EMA at $1760.70, consolidation in the $1780-$1810 area is on the cards.
GBP/USD has staged a rebound after testing key, short-term support at 1.2005. However, economists at Scotiabank still expect cable to move downward in the weeks ahead.
Short-term trend remains bearish
“Rising rates and falling private consumption amid surging prices are boosting recession risks in the UK and will maintain broader pressure on the GBP in the weeks ahead.”
“The short-term trend remains bearish and trend momentum signals are aligned bearishly for the pound currently, putting the market at clear risk of running back to (and a bit below) the July low at 1.1763.”
Canadian inflation dropped lower in July. But not enough to derail the Bank of Canada (BoC) from its currently aggressive hiking path. USD/CAD edges lower, however, economists at TD Securities expect dips in the pair to be bought into 1.28.
Positioning for topside around the BoC meeting
“Unless the data takes a huge nosedive between now and the September meeting, a 75 bps hike seems like a prudent bet. We are generally viewing the CAD as living on borrowed time however.”
“While this number may help to introduce modest downside into USD/CAD, we expect dips to be bought into 1.28. This is because the BoC meeting next month could be construed as peak hawkishness.”
“We like the idea of legging into CAD shorts around the BoC meeting as the Bank may start to change its tune just as the impact of higher rates begins to show in the data.”
- USD/TRY adds to Monday’s gains near the 18.00 mark.
- The current consolidation remains capped by 18.00.
- The CBRT is expected to keep the current status quo.
The lira depreciates further and motivates USD/TRY to once again challenge the upper end of the current range just below the 18.00 yardstick on Tuesday.
USD/TRY now looks to the CBRT
USDS/TRY clinches the second session in a row with gains on the back of the continuation of the bid bias in the greenback, always amidst persistent risk-off tone and helped further by rising US yields.
In the meantime, the lira is expected to remain under scrutiny ahead of the interest rate decision by the Turkish central bank (CBRT) later in the week. Consensus among investors, however, sees the central bank staying on the sidelines and keeping the One-Week Repo Rate unchanged at 14.00%.
What to look for around TRY
The upside bias in USD/TRY remains unchanged and stays on course to revisit the key 18.00 zone.
In the meantime, the lira’s price action is expected to keep gyrating around the performance of energy and commodity prices - which are directly correlated to developments from the war in Ukraine - the broad risk appetite trends and the Fed’s rate path in the next months.
Extra risks facing the Turkish currency also come from the domestic backyard, as inflation gives no signs of abating (despite rising less than forecast in July), real interest rates remain entrenched in negative figures and the political pressure to keep the CBRT biased towards low interest rates remains omnipresent. In addition, there seems to be no Plan B to attract foreign currency in a context where the country’s FX reserves dwindle by the day.
Key events in Türkiye this week: Budget Balance (Monday) – CBRT Interest Rate Decision (Thursday).
Eminent issues on the back boiler: FX intervention by the CBRT. Progress (or lack of it) of the government’s new scheme oriented to support the lira via protected time deposits. Constant government pressure on the CBRT vs. bank’s credibility/independence. Bouts of geopolitical concerns. Structural reforms. Presidential/Parliamentary elections in June 23.
USD/TRY key levels
So far, the pair is gaining 0.13% at 17.9604 and faces the immediate target at 17.9874 (2022 high August 3) seconded by 18.2582 (all-time high December 20) and then 19.00 (round level). On the other hand, a breach of 17.1903 (weekly low July 15) would pave the way for 16.3438 (100-day SMA) and finally 16.0365 (monthly low June 27).
- USD/JPY gains strong positive traction on Tuesday and is supported by a combination of factors.
- Hawkish Fed expectations, rising US bond yields continue to underpin the USD and act as a tailwind.
- The Fed-BoJ policy divergence weighs on the JPY, though recession fears could limit deeper losses.
- Investors might also prefer to wait for the release of the key FOMC meeting minutes on Wednesday.
The USD/JPY pair builds on its intraday positive move and climbs to the 134.65-134.70 area, or a four-day high during the early North American session.
The US dollar is prolonging its recovery from over a one-month low touched in the aftermath of the softer US CPI report and gaining traction for the third successive day on Tuesday. The momentum pushes the buck to a fresh monthly peak and acts as a tailwind for the USD/JPY pair.
The recent hawkish remarks by several Fed officials suggest that the US central bank would stick to its policy tightening path. This, along with a pickup in the US Treasury bond yields, continues to underpin the USD and remain supportive of the USD/JPY pair's strong move up.
Apart from this, a big divergence in the Fed-Bank of Japan (BoJ) monetary policy stance is driving flows away from the Japanese yen and providing an additional lift to spot prices. It is worth recalling that the BoJ has repeatedly said that it would retain its ultra-easy policy settings.
That said, the prevalent cautious market mood - amid growing worries about a global economic downturn - extends some support to the safe-haven JPY. This might turn out to be the only factor that might hold back bulls from placing fresh bets and cap any further gains for the USD/JPY pair.
Traders might also prefer to move on the sidelines ahead of the FOMC minutes, scheduled for release on Wednesday. Investors would look for clues about the possibility of a 75 bps rate hike in September, which would influence the USD and provide a fresh directional impetus to the USD/JPY pair.
Technical levels to watch
- Industrial Production in the US rose at a stronger pace than expected in July.
- US Dollar Index clings to daily gains near 106.70 after the data.
The data published by the US Federal Reserve showed on Tuesday that Industrial Production rose by 0.6% on a monthly basis in July. This print came in better than the market expectation for an expansion of 0.3%. In the same period, Manufacturing Production increased by 0.7% after having contracted by 0.4% in each of the previous two months.
"Capacity utilization moved up 0.4 percentage point in July to 80.3%, a rate that is 0.7 percentage point above its long-run (1972–2021) average," the publication further read.
Market reaction
These figures don't seem to be having a significant impact on the dollar's performance against its rivals. As of writing, the US Dollar Index was up 0.23% on the day at 106.73.
- EUR/USD drops further and revisits the 1.0120 area.
- Extra losses should meet solid support around 1.0100.
EUR/USD challenges the August lows in the vicinity of 1.0120 on turnaround Tuesday.
While further correction appears likely in the short-term horizon, the lower end of the recent range in the 1.0100 zone should offer decent support prior to a potential challenge of the psychological parity level.
In the longer run, the pair’s bearish view is expected to prevail as long as it trades below the 200-day SMA at 1.0880.
EUR/USD daily chart
Gold sellers are lurking, according to economists at TD Securities. Therefore, the pain trade remains to the downside.
Shanghai traders are likely to appear on the offer
“The bar is razor thin for algorithmic trend followers to add to selling pressures in US 10Y Treasuries once more. This should further sap appetite to buy the yellow metal, while the bar for additional short covering rises further.”
“Shanghai traders are likely to appear on the offer, particularly amid a weakening CNY.”
“Gold prices are vulnerable, considering we see signs that gold sellers are lurking.”
- USD/CAD edges lower and refreshes daily low during the early North American session.
- The mixed Canadian/US macro data fails to provide any meaningful impetus to the pair.
- The fundamental backdrop supports prospects for the emergence of some dip-buying.
The USD/CAD pair witnessed some selling during the early North American session and refreshes it's daily low in reaction to US/Canadian macro data. The pair is currently trading with modest intraday losses, just below the 1.2900 round-figure mark.
A modest bounce in crude oil prices seems to underpin the commodity-linked loonie and act as a headwind for the USD/CAD pair. Spot prices edge lower and seem rather unaffected by Canadian consumer inflation figures. Statistics Canada reported that the Canadian CPI decelerated to the 7.6% YoY rate in July from the 8.1% in the previous month. More importantly, the Bank of Canada's Core CPI, which excludes volatile food and energy prices, unexpectedly eased to the 6.1% YoY rate from the 6.2% in June.
This, along with some follow-through US dollar buying for the third straight day, should offer some support to the USD/CAD pair. In fact, the USD climbs to a fresh monthly high and continues to draw support from expectations that the Fed would stick to its policy tightening path. Apart from this, an uptick in the US Treasury bond yields and recession fears offset mixed US housing market data and favour the USD bulls, supporting prospects for the emergence of some dip-buying around the major.
Traders, meanwhile, might refrain from placing aggressive bets ahead of the FOMC monetary policy meeting minutes, scheduled for release on Wednesday. The markets have priced in at least a 50 bps Fed rate hike at the September meeting and the minutes would be looked upon for clues about the possibility of a larger, 75 bps move. Hence, it would be prudent to wait for strong follow-through selling before confirming that the recent recovery from over a two-month low touched last week has run its course.
Technical levels to watch
- Housing Starts in the US fell sharply in July.
- US Dollar Index edged slightly lower with the initial reaction.
The monthly data published by the US Census Bureau showed on Tuesday that Housing Starts declined by 9.6% on a monthly basis in July following the 2.4% increase recorded in June. Moreover, Building Permits fell by 1.3% in the same period.
"Single‐family housing starts in July were at a rate of 916,000; this is 10.1% below the revised June figure of 1,019,000," the publication further read.
Market reaction
The US Dollar Index (DXY) retreated modestly from the 20-day high it touched at 106.95 earlier in the day with the immediate market reaction. As of writing, the DXY was up 0.3% on the day at 106.80.
- Annual CPI inflation in Canada declined to 7.6% in July as expected.
- USD/CAD continues to fluctuate at around 1.2900 after the data.
Inflation in Canada, as measured by the Consumer Price Index (CPI), declined to 7.6% on a yearly basis in July from 8.1% in June, the data published by Statistics Canada revealed on Tuesday. This print came in line with the market expectation.
The Bank of Canada's (BOC) Core CPI, which excludes volatile food and energy prices, edged lower to 6.1% from 6.2% in the same period, compared to analysts' estimate of 6.7%.
Market reaction
With the initial market reaction, the USD/CAD pair edged slightly lower before staging a rebound. As of writing, the pair was trading flat on the day at 1.2900.
Senior Economist at UOB Group Alvin Liew comments on the publication of Japanese Q2 GDP figures.
Key Takeaways
“Japan’s 2Q 2022 GDP missed market expectations, as it grew by 0.5% q/q, 2.2% q/q SAAR (versus Bloomberg est: 2.6% q/q SAAR, but in line with UOB est 2.2% q/q SAAR) while the -0.5% contraction in 1Q was revised to a surprising 0.1% expansion. It is also notable that the 2Q growth (and 1Q upward revision) finally lifted the real GDP of Japan to JPY542.1 trillion, above the pre-pandemic level of JPY 540.9tn in 4Q 2019.”
“Sequential expansion in 2Q was due to increases in private consumption, business spending, government consumption and a surprise rebound in public investment. The key drag on the economy was the 0.4ppt decline from private inventories while net external demand/net exports of goods and services did not contribute to sequential growth.”
“We expect the Japanese economy to continue its rebound although the extent could be curbed by stronger inflation impacting domestic demand. Japan remains slow to re-open borders to tourism with daily COVID-19 infections still high at 200,000. Meanwhile, weaker growth outlook in Japan’s key trading partners (especially Eurozone) will also imply weaker demand for Japan’s exports, adding further downside to growth.”
“Despite the slightly more positive growth outcome in 1H 2022, there will greater caution on the external outlook which has deteriorated materially compared to three months ago and the external risks include: 1) the on-going Russia-Ukraine conflict, 2) monetary policy tightening stance in the advanced economies, 3) geopolitical risks, and 4) COVID-19 risk of potential new variants.”
“We expect Japan to continue its growth trajectory but are mindful of the external risks. We are comfortable with our current full-year 2022 GDP growth forecast at 1.5%, a slowdown from 1.7% in 2021. We expect growth to remain at a lacklustre 1.4% for 2023, due to the uncertain external outlook. With Japan’s moderate economic recovery and the challenging external growth outlook while inflation driven by commodities, it means that the BOJ will not be tightening or signaling to do so anytime in 2022.”
- DXY extends the recovery and flirts with 107.00.
- Further up comes the weekly high around 107.40.
DXY extends the rebound from recent lows and trades closer to the key barrier at the 107.00 zone on Tuesday.
The continuation of the upside momentum could extend to the August high near the 107.00 yardstick (August 5). Once cleared, the index could attempt to confront the post-FOMC meeting high at 107.42 (July 27).
Looking at the broader scenario, the bullish view in the dollar remains in place while above the 200-day SMA at 100.16.
DXY daily chart
- Silver loses ground for the second straight day and slides to over a one-week low.
- The downfall marks a bearish breakdown below a one-week-old trading range.
- Bears still need to wait for a sustained break below $20.00 before placing fresh bets.
Silver witnesses selling for the second successive day on Tuesday and drops to over a one-week low, around the $20.00 psychological mark during the mid-European session.
The decline follows last week's failure near the 61.8% Fibonacci retracement level of the $22.52-$18.15 downfall and marks a bearish break below a one-week-old trading range. Adding to this, acceptance below the 50% Fibo. level and the 50-day SMA supports prospects for a further depreciating move for the XAG/USD.
That said, oscillators on the daily chart - though have been losing traction - are yet to confirm the negative outlook. This makes it prudent to wait for sustained weakness below the $20.00 mark before placing fresh bearish bets and positioning for a subsequent slide below the 38.2% Fibo. level, around the $19.80 region.
The next relevant support is pegged near the $19.55 area (last week's swing low), which should now act as a key pivotal point. A convincing break below would shift the bias in favour of bearish traders and expose the 23.6% Fibo. level, around the $19.20-$19.15 region. The XAG/USD could eventually drop to the $19.00 mark.
On the flip side, the 50% Fibo. level, around the $20.35 region, now seems to act as immediate strong resistance. Any subsequent move up could attract fresh selling near the $20.65 horizontal zone. This, in turn, should keep a lid on any further gains for the XAG/USD near the 61.8% Fibo. level, around the $20.85 region.
Silver daily chart
-637962486619829804.png)
Key levels to watch
The GBP/USD pair manages to defend the 1.2000 psychological mark on Tuesday. A drop under 1.1965 would set up a test of the July 14 low near 1.1760, according to economists at BBH.
UK reported labor market data
“Break below 1.1965 would set up a test of the July 14 low near 1.1760.”
“Employment rose 160K in the three months through June vs. 268K expected, while the unemployment rate remained steady at 3.8%.”
“Real wages fell by 3% during the same period, the most since the series began in 2001, as rising inflation and slowing nominal wage gains are clearly hurting household income. Expect consumption to continue weakening in the coming months.”
“Of note, job vacancies for the three months through July fell 19.8K, the first drop since August 2020 and possibly signaling weaker labor market conditions ahead.”
EUR/USD declines toward 1.0100. A drop under this level would set up a test of the July 14 cycle low near 0.9950, economists at BBH report.
German August ZEW consumer survey was weak
“A break below 1.0110 would set up a test of the July 14 cycle low near 0.9950.”
“Expectations came in at -55.3 vs. -52.7 expected and -53.8 in July, while current situation came in at -47.6 vs. -49.0 expected and -45.8 in July. ZEW noted that ‘The still high inflation rates and the expected additional costs for heating and energy lead to a decrease in profit expectations for the private consumption sector’.”
Enrico Tanuwidjaja, Economist at UOB Group, reviews the latest trade balance figures in Indonesia.
Key Takeaways
“Indonesia’s trade surplus narrowed to USD 4.2bn in Jul, a decrease from the preceding month’s USD 5.1bn, but still higher than market expectations of USD 3.9bn.”
“Exports grew 32.03% y/y, beating market expectations of 29.73% to achieve USD 25.6bn, driven by increased palm oil exports. Imports soared, growing at 39.9% y/y compared to consensus estimates of 37.3%, reaching USD 21.4bn, a sign of post-pandemic recovery.”
“We expect the overall trade surplus in 2022? to match 2021’s record of USD35.3bn, amidst soaring imports and exports as supply chains resume pre-pandemic levels of efficiency.”
- EUR/JPY trades with decent gains after two daily drops in a row.
- If the rebound gathers pace, then the cross could revisit 138.40.
EUR/JPY leaves behind two consecutive daily pullbacks and advances beyond 136.00 the figure on Tuesday.
In case the recovery becomes more serious, then the cross should meet the next barrier at the 100-day SMA at 138.08 prior to the more relevant August peak at 138.39 (August 10).
While above the 200-day SMA, today at 133.94, the prospects for the pair should remain constructive.
EUR/JPY daily chart
- AUD/USD turns lower for the second straight day and drops to a multi-day low.
- Hawkish Fed expectations continue to underpin the USD and exert pressure.
- Recession fears further benefit the USD and weigh on the risk-sensitive aussie.
The AUD/USD pair struggles to capitalize on its intraday recovery move and meets with a fresh supply near the 0.7040 region on Tuesday. Spot prices turn back lower for the second successive day and slip below the 0.7000 psychological mark, hitting a four-day low during the first half of the European session.
The US dollar catches some bids for the third straight day and climbs back closer to the monthly peak, which turns out to be a key factor exerting downward pressure on the AUD/USD pair. Despite last week's softer US CPI report, the recent hawkish comments by Fed officials suggest that the US central bank would stick to its policy tightening path. This remains supportive of elevated US Treasury bond yields and continues to offer support to the greenback.
Apart from this, growing worries about a global economic downturn tempers investors' appetite for perceived riskier assets. The anti-risk mood is evident from a generally softer tone around the equity markets, which further underpins the safe-haven buck and contributes to driving flows away from the risk-sensitive aussie. This, along with weaker commodity prices, exerts additional downward pressure on the resources-linked Australian dollar and the AUD/USD pair.
Bulls seem unimpressed by the Reserve Bank of Australia’s (RBA) August meeting minutes, showing that board members agreed it was appropriate to continue to process of normalizing monetary conditions. Furthermore, weakness below the 0.7000 mark could be seen as a fresh trigger for bearish traders and supports prospects for further losses. The fundamental/technical backdrop suggests that the path of least resistance for the AUD/USD pair is to the downside.
Market participants now look forward to the US economic docket, featuring housing market data and Industrial Production figures, for some impetus later during the early North American session. Traders will further take cues from the US bond yields, which should influence the USD price dynamics. This, along with the broader market risk sentiment should allow traders to grab short-term opportunities around the AUD/USD pair.
Technical levels to watch
Economist at UOB Group Ho Woei Chen, CFA, comments on the recent releases in the Chinese calendar and the rate cut by the PBoC.
Key Takeaways
“Broad economic weakness resurfaced in Jul as China’s data including the industrial production (IP), retail sales and fixed asset investment (FAI) missed expectations.”
“The national surveyed jobless rate has continued to ease but concerns for the job market have centred on providing employment for new graduates as the youth unemployment rate rose further to a fresh record high of 19.9% in Jul.”
“The People’s Bank of China (PBoC) unexpectedly cut its 1Y medium-term lending facility (MLF) rate by 10 bps to 2.75% … The 7-day reverse repo rate was also cut to 2.00% from 2.10%. However, the central bank withdrew liquidity as expected, by rolling over CNY400 bn out of CNY600 bn of MLF that are maturing this week.”
“This is the first cut since Jan when the 1Y MLF was also reduced by 10 bps, leading to a corresponding 10 bps drop in the 1Y loan prime rate (LPR) subsequently. This time, we are also expecting the 1Y LPR to be fixed lower by 10 bps to 3.60% on 22 Aug while the 5Y LPR may also move lower in addition to the 15 bps reduction in May (current rate at 4.45%). We are retaining our end-3Q22 forecast for the 1Y LPR at 3.55% and then expect the rate to stay on hold through to 1Q23. Further rate reductions in China will be limited as domestic inflation rises while there are also increasing concerns over excessive liquidity in the banking system as credit demand has stayed weak due to the economic uncertainties.”
- Gold witnesses selling for the second straight day on Tuesday amid modest USD strength.
- Hawkish Fed expectations and elevated US bond yields continue to underpin the greenback.
- Recession fears could limit losses for the safe-haven XAU/USD ahead of the FOMC minutes.
Gold attracts fresh selling near the $1,783 region on Tuesday and turns lower for the second successive day. The XAU/USD drops back closer to a one-week low touched the previous day, around the $1,774 area during the first half of the European session and now seems vulnerable to slide further.
Following a brief consolidation through the early part of trading on Tuesday, the US dollar gains some positive traction for the third straight day and exerts some pressure on the dollar-denominated gold. Despite last week's softer US CPI report, Fed officials stressed that it is too soon to declare a victory on inflation and have maintained a hawkish tone. This, in turn, suggests that the Fed would stick to its policy tightening path and continues to underpin the greenback.
In fact, the markets are currently pricing in a greater chance of at least a 50 bps rate hike at the next FOMC policy meeting in September. This remains supportive of elevated US Treasury bond yields, which turns out to be another factor driving flows away from the non-yielding yellow metal. The downside, however, seems cushioned, at least for the time being, as investors might now prefer to move on the sidelines ahead of the FOMC meeting minutes, scheduled for release on Wednesday.
Investors would look for clues about the possibility of a larger 75 bps rate hike move in September. This would play a key role in influencing the near-term USD price dynamics and help determine the next leg of a directional move for gold. In the meantime, growing worries about a global economic downturn could lend some support to the safe-haven precious metal. Traders now look forward to the housing market data and Industrial Production figures from the US for some impetus on Tuesday.
Technical levels to watch
Economist at UOB Group Enrico Tanuwidjaja reviews the latest GDP figures in Thailand.
Key Takeaways
“Thai GDP expanded by 2.5% y/y in 2Q22, faster compared to 2.3% in 1Q22 as household consumption continue to improve as the economy reopens more sustainably.”
“We are much more sanguine for growth momentum in the second half of the year (3Q and 4Q will likely grow circa the 4% region).”
“We keep our 2022 GDP forecast unchanged at 3.2% and to accelerate further to 3.7% next year.”
- Economic sentiment continued to deteriorate in the euro area and in Germany.
- EUR/USD stays under bearish pressure, declines toward 1.0100.
The Economic Sentiment Index component of the ZEW Survey for Germany declined to -55.3 in August from -53.8 in July. This reading came in worse than the market expectation of -53.8. Furthermore, the Current Situation Index declined to -47.6 from -45.8. Finally, the Economic Sentiment Index for the eurozone slumped to -54.9 from -51.5, missing analysts' estimate of -42.5 by a wide margin.
Key takeaways
"Financial market experts expect a further decline in the already weak economic growth in Germany."
"Still high inflation rates and the expected additional costs for heating and energy lead to a decrease in profit expectations for the private consumption sector."
"In contrast, the expectations for the financial sector are improving due to the supposed further increase in short-term interest rates."
Market reaction
The shared currency stays on the backfoot after this report and EUR/USD was last seen losing 0.3% on the day at 1.0128.
- GBP/USD remains depressed for the fourth straight session and drops closer to the monthly low.
- The BoE's gloomy economic outlook continues to undermine sterling amid sustained USD buying.
- The mixed UK employment data fail to impress bullish traders or provide any impetus to the pair.
The GBP/USD pair manages to defend the 1.2000 psychological mark on Tuesday and stages a modest bounce from the vicinity of the monthly low. The attempted recovery, however, lacks follow-through and the pair remains on the defensive, below the 1.2050 area through the early part of the European session.
The UK Office for National Statistics reported that the number of people claiming unemployment-related benefits fell by 10.5K in July against the 32K fall anticipated. The UK unemployment rate, meanwhile, was unchanged at 3.8% during the three months to June. This, to a larger extent, offset stronger wage growth data. The rather unimpressive data comes on the back of the Bank of England's warnings that the economy is likely to slip into recession later this year and acts as a headwind for the British pound.
The US dollar, on the other hand, gains traction for the third successive day and climbs back closer to the monthly peak amid hawkish Fed expectations. This turns out to be another factor exerting some downward pressure on the GBP/USD pair. Despite last week's softer US CPI report, Fed officials stressed that it is too soon to declare a victory on inflation and have maintained a hawkish tone. This, in turn, suggests that the Fed would stick to its policy tightening path and underpins the greenback.
Apart from this, worries about a global economic downturn offer additional support to the safe-haven buck and support prospects for a further depreciating move for the GBP/USD pair. That said, traders might refrain from placing aggressive bets and prefer to move on the sidelines ahead of the FOMC monetary policy meeting minutes, scheduled for release on Wednesday. This makes it prudent to wait for sustained weakness below the 1.2000 mark before positioning for any further near-term losses.
In the meantime, traders on Tuesday might take cues from the US economic docket - featuring the release of housing market data and Industrial Production figures. This, along with the broader market risk sentiment, might influence the USD price dynamics and produce short-term trading opportunities around the GBP/USD pair.
Technical levels to watch
The Monetary Authority of Singapore (MAS) delivered a surprising aggressive policy tightening. Subsequently, economists at ING expect the Singapore dollar to strengthen over the coming months.
MAS carries out off-cycle tightening
“Accelerating inflation prompted the Monetary Authority of Singapore to carry out an off-cycle tightening move, re-centring the mid-point of the policy band to prevailing levels.”
“The SGD steadied after the unscheduled tightening by the MAS and could appreciate further in the coming months as the string of tightening pulls SGD stronger.”
USD/MXN has dropped below the 20 level. In the opinion of analysts at ING, the pair could test 19.50 in the not too distant future.
Peso remains a good candidate for the carry trade
“MXN implied yields through the 3m forwards are near 10% and with Banxico targeting a stable currency – by keeping a 625 bps rate spread over the Fed – the peso should see good demand now. USD/MXN could briefly see 19.50.”
“Expect Banxico to match the next Fed increase (50 bps or 75 bps) in September. Access to US gas prices is an advantage for Mexico.”
- EUR/USD drops and rebounds from the 1.0130 region.
- Germany, EMU ZEW Economic Sentiment in due next.
- Housing Starts, Building Permits, Industrial Production next on tap later.
The European currency remains under scrutiny in the first half of the week and motivates EUR/USD to hover around the 1.0150 region on Tuesday.
EUR/USD focuses on dollar, ZEW survey
EUR/USD loses ground fort the third session in a row and navigates multi-day lows around 1.0150 on the back of the continuation of the bid bias around the greenback and lack of traction in yields on both sides of the Atlantic.
Indeed, the pair comes under further downside pressure following the stronger dollar and investors’ preference for safer assets, which forced the pair to give away more than two cents since last week’s tops near 1.0370 (August 10).
In the domestic calendar, the Economic Sentiment tracked by the ZEW survey is due in both Germany and the broader Euroland. Across the pond, the housing sector will take centre stage along with Industrial/Manufacturing Production results.
What to look for around EUR
EUR/USD’s upside momentum met a decent hurdle around 1.0360/70, an area coincident with the 55-day SMA and the 6-month resistance line so far.
Price action around the European currency, in the meantime, is expected to closely follow dollar dynamics, geopolitical concerns, fragmentation worries and the Fed-ECB divergence.
On the negatives for the single currency emerge the so far increasing speculation of a potential recession in the region, which looks propped up by dwindling sentiment gauges and the incipient slowdown in some fundamentals.
Key events in the euro area this week: EMU, Germany ZEW Economic Sentiment, EMU Balance of Trade (Tuesday), EMU GDP Growth Rate (Wednesday) – EMU Final Inflation Rate (Thursday).
Eminent issues on the back boiler: Continuation of the ECB hiking cycle. Italian elections in late September. Fragmentation risks amidst the ECB’s normalization of its monetary conditions. Impact of the war in Ukraine on the region’s growth prospects and inflation.
EUR/USD levels to watch
So far, spot is losing 0.20% at 1.0137 and a break below 1.0096 (weekly low July 27) would target 1.0000 (psychological level) en route to 0.9952 (2022 low July 14). On the other hand, the next up barrier comes at 1.0368 (monthly high August 10) seconded by 1.0505 (100-day SMA) and finally 1.0615 (weekly high June 27).
The Polish zloty looks unlikely to hold recent gains. Economists at ING expect to see another wave of PLN selling in late August/early September.
NBP to reluctantly continue its hiking cycle
“The fundamentals are unchanged, ie, a high risk of a recession in Europe and significantly softened NBP rhetoric. This may trigger another wave of PLN selling in late August/early September.”
“Longer term prospects of the zloty largely hinge on general CEE sentiment and the dollar (negative correlation of CEE FX and USD has been particularly strong this year).”
“We expect the NBP to reluctantly continue its hiking cycle, offering some support for the zloty, particularly when key central banks end their cycles.”
Falling crude oil prices weighed heavily on the loonie on Monday and USD/CAD climbed above 1.2900. Unless oil suffers another big correction, the pair could drop below 1.25 by the end of 2022.
Waiting for some carry effect
“The Bank of Canada hiked by 100 bps at the last meeting, but we expect a more moderate pace of tightening from now on. Our base-case is a 50 bps hike in September (markets currently pricing in 58 bps).”
“The BoC frontloaded tightening should leave the loonie with some decent carry advantage, but we still expect such advantage to fully materialise beyond the short term once market sentiment has stabilised.”
“Barring another big correction in oil prices, a move below 1.25 by year-end in USD/CAD still looks on the cards.”
EUR/USD has declined to its lowest level in nearly two weeks below 1.0140 but managed to stage a rebound. Additional losses are likely if 1.0150 is confirmed as resistance, FXStreet’s Eren Sengezer reports.
EUR/USD could suffer further losses in case 1.0150 support fails
“Later in the session, ZEW Survey for the euro area and Germany will be looked upon for fresh impetus. In case these figures fall short of market expectation, EUR/USD is likely to stay under bearish pressure with investors refraining from betting on a potential euro recovery.”
“1.0150 (Fibonacci 23.6% retracement of the latest downtrend) aligns as first support. In case the pair falls below that level and starts using it as resistance, it could continue to fall toward 1.0100 (static level, psychological level) and 1.0050 (static level).”
“On the upside, 1.0200/1.0210 (200-period SMA, 100-period SMA) forms the first resistance area before 1.0230 (Fibonacci 38.2% retracement) and 1.0300 (Fibonacci 50% retracement).”
- USD/JPY regains some positive traction on Tuesday amid some follow-through USD buying.
- Hawkish Fed expectations, elevated US bond yields push the USD closer to the monthly high.
- The Fed-BoJ policy divergence favour bullish traders, though recession fears might cap gains.
The USD/JPY pair attracts some dip-buying near the 132.95 area on Tuesday and climbs to a fresh daily high during the early European session. The pair is currently placed around the 133.70 region and is looking to build on its recent bounce from the 131.75-131.70 region touched last Thursday in the aftermath of the softer US CPI report.
The US dollar gains traction for the third straight day and climbs back closer to the monthly peak, which turns out to be a key factor acting as a tailwind for the USD/JPY pair. Despite last week's softer US CPI report, Fed officials stressed that it is too soon to declare a victory on inflation and have maintained a hawkish tone. This, in turn, suggested that the Fed would stick to its policy tightening path and remain supportive of elevated US Treasury bond yields, offering support to the buck.
In contrast, the Bank of Japan has repeatedly said that it would retain its ultra-easy policy settings and remains committed to keeping the 10-year Japanese government bond yield around 0%. This marks a big divergence in comparison to a more hawkish stance adopted by the US central bank, which underpins the Japanese yen and provides an additional lift to the USD/JPY pair. That said, recession fears continue to weigh on investors' sentiment and extend some support to the safe-haven JPY, which could cap the USD/JPY pair.
Traders now look forward to Tuesday's US economic docket, featuring housing market data and Industrial Production figures, which might influence the USD and provide some impetus to the USD/JPY pair. The focus, however, would remain on the US monthly Retail Sales and the FOMC monetary policy meeting minutes, both scheduled for release on Wednesday. In the meantime, traders might refrain from placing aggressive bets and prefer to move on the sidelines. This might also contribute to keeping a lid on any meaningful gains for the USD/JPY pair.
Technical levels to watch
FX Strategists at UOB Group Lee Sue Ann and Quek Ser Leang note USD/CNH could edge further up in the short term.
Key Quotes
24-hour view: “We did not expect the sudden lift-off in USD that sent it rocketing by +1.16% (NY close of 6.8135), its largest 1-day advance since Mar 2020. The outsized advance appears to be overdone and USD is unlikely to strengthen much further. For today, USD is more likely to consolidate and trade between 6.7850 and 6.8250.”
Next 1-3 weeks: “We noted yesterday (15 Aug, spot at 6.7400) that downward momentum has waned and the chance for USD to weaken has diminished. We did not expect sudden surge that sent USD soaring to a high of 6.8200. While the rapid rise appears to be running ahead of itself, there is room for USD to move above to the year-to-date high near 6.8400. However, it is left to be seen if USD can maintain a foothold above this major resistance level. In order to maintain the strong build-up in momentum, USD should hold above 6.7700 within these few days.”
Danmarks Nationalbank (DN) is set to mirror the European Central Bank (ECB). Therefore, the EUR/DKK pair is expected to hover around the 7.44 mark into the new year, economists at ING report.
DN set to keep following the ECB
“For now, we see no reasons to doubt that the DN will continue to hike perfectly in line with the ECB.”
“We forecast EUR/DKK to stay at 7.44 into the new year, but a return to 7.45-7.46 looks more than possible next year.”
The Indonesian rupiah was on the defensive again early but depreciation pressure was capped by the end of July. Economists at ING think that the IDR can enjoy gains once Bank Indonesia (BI) hikes at the end of the third quarter.
IDR will likely move sideways
“The IDR will likely move sideways as depreciation pressure is offset to some extent by their substantial trade surplus.”
“IDR can enjoy a rally once BI finally decides to hike policy rates at the end of Q3.”
- The index gathers extra steam and trades in multi-session highs.
- The risk-off mood keeps bolstering the demand for the dollar.
- Housing data, Industrial Production due next in the US docket.
The greenback rises further and motivates the US Dollar Index (DXY) to trade in multi-session peaks near 106.80 on turnaround Tuesday.
US Dollar Index up on risk-off mood, looks to data
The index advances for the third session in a row and extend further the rebound from last week’s 5-week lows near 104.60, always on the back of the intense offered stance in the risk complex.
The extra improvement in the buck comes despite the muted performance of US yields, which keep hovering around Monday’s closing levels.
In the US data universe, Housing Starts and Building Permits are due later seconded by Industrial Production and the weekly report on US crude oil inventories by the API.
What to look for around USD
The strong rebound in the dollar comes in response to some worsening conditions in the risk complex, which motivates DXY to now shift its attention to the 107.00 neighbourhood.
The dollar, in the meantime, is poised to suffer some extra volatility amidst investors’ repricing of the next move by the Federal Reserve, namely a 50 bps or 75 bps hike in September.
Looking at the macro scenario, the dollar appears propped up by the Fed’s divergence vs. most of its G10 peers (especially the ECB) in combination with bouts of geopolitical effervescence and occasional re-emergence of risk aversion.
Key events in the US this week: Building Permits, Housing Starts, Industrial Production (Tuesday) – MBA Mortgage Applications, Retail Sales, Business Inventories, FOMC Minutes (Wednesday) – Initial Claims, Philly Fed Manufacturing Index, CB Leading Index, Existing Home Sales (Thursday).
Eminent issues on the back boiler: Hard/soft/softish? landing of the US economy. Escalating geopolitical effervescence vs. Russia and China. Fed’s more aggressive rate path this year and 2023. US-China trade conflict.
US Dollar Index relevant levels
Now, the index is gaining 0.07% at 106.55 and a breakout of 107.42 (weekly high post-FOMC July 27) would expose 109.29 (2022 high July 15) and then 109.77 (monthly high September 2002). On the other hand, immediate support comes at 104.63 (monthly low August 10) seconded by 103.80 (100-day SMA) and finally 103.67 (weekly low June 27).
The South African rand has done much better over the last month than analysts at ING expected. But now, they think that ZAR is set to move back lower.
ZAR remains a very high beta currency
“The scope for a stronger dollar into year-end and further growth challenges in Europe (and maybe China too) makes up sceptical of chasing ZAR higher.”
“Last month the SARB sped up the pace of hikes to 75 bps – taking the policy rate to 5.50%. That is still below headline inflation above 7% and does not offer too much protection to the ZAR. The projected 2% of GDP current account surplus is not large.”
“ZAR remains a very high beta currency and unless one expects current benign conditions to stay all year, ZAR should turn lower.”
USD/RUB ended July in the 64.50-65.00 range before dropping to 60.00-60.50 in August. Economists at ING expect the pair to trade at 60 by the end of the third quarter.
Weaker trade balance needed to assure RUB depreciation
“Current account surplus remained at a colossal $28bn in July despite some recovery of imports from China, as the effect of lower Urals prices in July has yet to show itself in August trade figures.”
“The balance of payments continues to favour rouble appreciation in the medium-term, forcing us to expect 60 at the end of 3Q22. However, the EU embargo, which kicks in later this year, should bring the rouble back on a depreciation track in 4Q22.”
AUD/USD lost nearly 100 pips on Monday and failed to stage a rebound. Economists at ING believe that any rebound to the 0.72/73 area will not be seen until the fourth quarter.
Still not breaking free
“While the RBA may prove a relatively neutral factor for AUD for the time being, there are lingering downside risks stemming from potential fresh instability in the global risk environment and more grim data coming from China.”
“We suspect that any sustained recovery to the 0.72-0.73 region in AUD/USD would need to wait until Q4.”
So far in Q3, the Canadian dollar is the fourth worst and in August it is the second worst performing in G10. Economists at MUFG Bank believe that the outlook for the loonie is darkening.
The housing market in Canada remains a key risk
“Given the reversal in oil prices, the signs of a loss of momentum for the Canadian economy (May GDP flat, June expected 0.1%), and more specifically the housing market slowdown, we are turning less favourable on CAD than before.”
“Our sense is that we could see a more pronounced CAD selloff on a weaker CPI print today than CAD strength on a stronger CPI.”
“The 100 bps hike by the BoC leaves them better placed to slow the pace to 50 bps given the global backdrop, some signs of slowing inflation and the downside risks to growth.”
- NZD/USD witnessed some follow-through selling for the second successive day on Tuesday.
- Hawkish Fed expectations push the USD back closer to the monthly top and exert pressure.
- Recession fears further benefit the safe-haven greenback and weigh on the risk-sensitive kiwi.
The NZD/USD pair adds to the previous day's heavy losses and witnesses some follow-through selling for the second successive day on Tuesday. The pair extends its descent through the early European session and drops to a four-day low, around the 0.6325 region in the last hour.
Following a brief consolidation, the US dollar regains positive traction for the third straight day and climbs back closer to the monthly peak. This turns out to be a key factor exerting downward pressure on the NZD/USD pair and supports prospects for a further near-term depreciating move.
The USD continues to draw support from expectations that the US central bank would stick to its policy tightening path, bolstered by the recent hawkish comments by several Fed officials. Apart from this, recession fears underpin the safe-haven buck and weigh on the risk-sensitive kiwi.
The disappointing Chinese economic data released on Monday added to growing market worries about a global economic downturn and tempered investors' appetite for riskier assets. This is evident from a weaker tone around the equity markets, which tends to benefit traditional safe-haven assets.
The aforementioned factors favour the USD bulls, suggesting that the path of least resistance for the NZD/USD pair is to the downside. That said, traders might refrain from placing aggressive bets ahead of this week's important release of the latest FOMC monetary policy meeting minutes.
The markets are currently pricing in a greater chance of at least a 50 bps Fed rate hike in September. Hence, the minutes would be looked upon for clues about the possibility for a 75 bps move, which would influence the USD and provide a fresh directional impetus to the NZD/USD pair.
Investors would further take cues from the US monthly Retail Sales data, also scheduled on Wednesday. In the meantime, Tuesday's US economic docket, featuring housing market and Industrial Production data, might produce some trading opportunities later during the early North American session.
Technical levels to watch
The Reserve Bank of New Zealand (RBNZ) will announce its monetary policy decision on Wednesday, August 17 at 02:00 GMT and as we get closer to the release time, here are the expectations as forecast by the economists and researchers of five major banks.
The RBNZ is seen raising the Official Cash Rate (OCR) by 50 basis points (bps), lifting it from 2.5% to 3.0%. The policy announcement will be accompanied by the updated projections and followed by Governor Adrian Orr’s press conference.
ANZ
“We expect the RBNZ will raise the OCR 50 bps to 3.00%. We expect the Committee to strike a hawkish tone in its choice of words and its OCR track. Recent starting point surprises on domestic inflation and wage growth, as well as recent falls in domestic mortgage rates, give the Committee little choice but to send a clear message.”
Westpac
“We expect the RBNZ to raise the OCR by another 50 bps to 3%. The RBNZ is likely to maintain a similar path for its OCR projections, in contrast to financial markets which have moved to price in a lower peak for this cycle and an earlier start to interest rate cuts. Continuing to tighten monetary policy ‘at pace’ would send a message that while the fight against inflation is well underway, a declaration of victory is a long way off.”
BofA
“We expect the RBNZ to deliver another 50 bps hike to lift the OCR to 3%. While policy guidance should remain hawkish in light of price pressures, there is risk the Bank may introduce more conditionality on the scale of subsequent policy front-loading. The quarterly Monetary Policy Statement should reflect both modest changes to the OCR track, and unveil softer growth and labour market forecasts. But signs of an inflation peak are not yet in sight.”
TDS
“We expect RBNZ to lift the OCR to 3%. Recent data suggest that the RBNZ's job is not done and near-term risks to inflation should dominate the Bank’s thinking. Updated economic forecasts and the new OCR path will garner market attention.”
ING
“We see some non-negligible risk that the RBNZ will have to revise its rate path projections lower. Even if the RBNZ hikes by 50 bps (as per our base case scenario and market expectations) the downside risks from a dovish repricing are quite material for the kiwi.”
In the view of analysts at ING, the British pound remains vulnerable on recession fears. Beyond some substantial fiscal stimulus, GBP’s best hope is that the Bank of England (BoE) delivers on most of the aggressive tightening currently priced into markets.
Growth sensitive pound to struggle
“GBP/USD remains vulnerable on the back of continuing dollar strength and the UK economy trapped by slowing growth and a hawkish BoE.”
“A tricky environment for risk assets in 2H22 – slowing growth, tighter monetary conditions – suggests the growth sensitive pound will struggle.”
“The only thing helping it should be the BoE remaining hawkish all year – lifting rates 50 bp to 2.25% in September – and at least making sterling an expensive sell.”
Rate spreads and the energy income shock make it a very tough environment for the euro. EUR/USD should therefore drift near parity for much of the second half of the year, strategists at ING report.
Late cycle economies will keep the dollar bid
“It looks pretty clear that the US is a late-cycle economy with high inflation and low growth. This stage of the cycle is synonymous with inverted yield curves. The dollar typically stays bid in this part of the cycle until convictions grow that the Fed will ease, and US 2-year yields start dropping. That is probably a story for 1Q23 and not today.”
“We look for another 125 bps of Fed hikes this year and just 50 bps from the ECB (in Sep.). Risks look skewed to even higher US rates.”
“With Europe entering recession on the back of a looming energy crisis this winter, EUR/USD can stay near the lows for 2H22.”
After the Swiss National Bank’s (SNB) 50 bps hike in June, EUR/CHF has seen an orderly decline. Economists at ING expect the pair to grind towards 0.95.
Italian elections should also contribute to the EUR/CHF decline
“Remember this is a brave new world, where the SNB wants Swiss franc appreciation to keep the real exchange rate stable”
“Look for EUR/CHF to grind towards 0.95, with expectations that the SNB match the expected 50 bps hike from the ECB in Sep.”
“Italian elections on September 25th should also contribute to the EUR/CHF decline. Italian BTP-German Bund spreads could easily widen to 240 bps again and keep the CHF in demand.”
The Swedish krona rally may have gone a bit too far. Analysts at ING expect the EUR/SEK pair to advance towards the 10.50 zone over the coming weeks.
Riksbank-ECB rate differential still points to some weakness in EUR/SEK
“The big rebound in the SEK may have come too early, as its exposure to a worsening economic outlook in the eurozone and high beta to risk sentiment suggest some room for a correction now.”
“We see scope for some rebound in EUR/SEK to the 10.50 area (driven by a SEK correction) over the coming weeks. Later on, the Riksbank-ECB rate differential still points at some weakness in the pair, but a return to sub-10.00 levels may need to wait for some improvement in EU sentiment in 2023.”
The dollar stays relatively quiet early Tuesday. Economists at ING see three factors that can keep the dollar strong near term and probably send it a little stronger.
Continued dollar strength
“Ongoing energy shock primarily is being felt through natural gas prices. These prices continue to rise as importers compete for cargoes ahead of the northern hemisphere winter and the very uncertain supply situation. The energy independence of the US leaves the dollar relatively insulated on this score.”
“The People's Bank of China (PBoC) overnight fixed USD/CNY in line with model-based estimates. USD/CNH is now trading through 6.80 and a move through 6.82/84 will certainly raise speculation of something larger afoot akin to the April/May 6% renminbi devaluation. That period saw the DXY dollar index up around 6% too.”
“Today sees the release of July industrial production and tomorrow the release of retail sales. We see better figures for both. The figures should temporarily allay US recession fears and prepare the markets for what could be a hawkish set of FOMC minutes tomorrow night. The Fed probably wants tighter financial conditions now – which implicitly include a firmer dollar.”
EUR/USD stays quiet near 1.0150 early Tuesday. Economists at ING believe that the world’s most popular currency pair could test parity again.
1.0200 should prove short-term resistance
“The trade-weighted euro is a whisker away from the lows of the year and a slightly stronger dollar over the next 48 hours could easily see EUR/USD retesting parity.”
“1.0200 should now prove short-term resistance.”
The recovery in risk sentiment has fuelled a substantial rebound in the Norwegian krone over the past month. Economists at ING expect the EUR/NOK to remain above the 10 level over the coming month.
A pause for NOK?
“We are currently calling for 25 bps hikes at each of the remaining four meetings of the year by Norges Bank, but the August meeting will be a tight one with risk of 50 bps.”
“Despite the worsening outlook in Europe, high energy prices are set to keep shielding the Norwegian economy.”
“More risk sentiment instability over the short term may keep EUR/NOK above 10.00 into the end of September, before a more stable downward trend starting from 4Q.”
- USD/CAD is seen consolidating in a range just below a one-week high touched on Monday.
- A modest uptick in crude oil prices underpins the loonie and acts as a headwind for the pair.
- Recession fears, hawkish Fed expectations offer support to the USD and limit the downside.
- Investors eye the Canadian CPI report and US economic data for short-term trading impetus.
The USD/CAD pair struggles to capitalize on the overnight strong rally to a one-week high and witnesses subdued/range-bound price action on Tuesday. The pair remains confined in a narrow trading band through the early European session and is currently placed around the 1.2900 round-figure mark.
A modest uptick in crude oil prices offers some support to the commodity-linked loonie. The US dollar, on the other hand, is seen consolidating its strong gains recorded over the past two trading sessions. The combination of factors acts as a headwind for the USD/CAD pair, though the fundamental backdrop still seems tilted in favour of bullish traders.
The disappointing Chinese economic data released on Monday added to market worries about a global economic downturn, which could hit fuel demand and cap oil prices. Recession fears, along with hawkish Fed expectations, should continue to underpin the safe-haven USD and further contribute to limiting the downside for the USD/CAD pair, at least for the time being.
Despite last week's softer US CPI report, Fed officials stressed that it is too soon to declare a victory on inflation and have maintained a hawkish tone. This, in turn, suggested that the Fed would stick to its policy tightening path and remained supportive of elevated US Treasury bond yields, offering support to the buck ahead of the FOMC minutes on Wednesday.
The markets are currently pricing in a greater chance of at least a 50 bps rate hike at the September FOMC meeting. Hence, the minutes would be looked upon for clues about the possibility for a larger 75 bps move. This would play a key role in influencing the near-term USD price dynamics and help determine the next leg of a directional move for the USD/CAD pair.
In the meantime, traders on Tuesday would take cues from the release of the latest Canadian consumer inflation report. The US economic docket, meanwhile, features housing market data and Industrial Production figures. This could drive the USD, which, along with the sentiment surrounding oil prices, would provide a fresh impetus to the USD/CAD pair.
Technical levels to watch
Here is what you need to know on Tuesday, August 16:
The dollar stays relatively quiet early Tuesday as markets await the next significant catalyst. The US Dollar Index gained more than 1% in the two-day recovery that started on Friday and was last seen moving sideways near 106.50. The European economic docket will feature the ZEW Survey results for the euro area and Germany. In the second half of the day, the US Census Bureau will publish the Housing Starts and Building Permits data for July. Meanwhile, markets remain cautious in the European morning with US stock index futures losing between 0.06% and 0.16%. Finally, the benchmark 10-year US Treasury bond yield stays flat below 2.8%.
Although safe-haven flows dominated the financial markets for the majority of the day on Monday, Wall Street's main indexes managed to close the day modestly higher. China’s state planner National Development and Reform Commission (NDRC) announced multiple measures to avoid recession fears as it said, “We pledge to keep the economy within reasonable bounds.” According to Reuters, the NDRC approved 65 fixed-asset investment projects worth a total of 1.028 trillion yuan from January to July and approved 8 fixed-asset investment projects worth a total of 236.8 billion yuan in July. Nevertheless, the Shanghai Composite Index was flat on the day at the time of press.
AUD/USD lost nearly 100 pips on Monday and failed to stage a rebound. During the Asian session, the Reserve Bank of Australia's (RBA) monetary policy meeting minutes showed that policymakers were ready to take further tightening steps. The RBA, however, reiterated that they were not on a pre-set path. As of writing, the pair was down 0.15% at 0.7015 on the day.
Falling crude oil prices weighed heavily on the loonie on Monday and USD/CAD climbed above 1.2900. Pressured by the worsening demand outlook and prospects of Iranian oil entering the market, the barrel of West Texas Intermediate fell more than 4% on Monday before recovering toward $88.50 on Tuesday. Later in the session, Statistics Canada will release the Consumer Price Index data for July.
Following Monday's steep decline, EUR/USD stays quiet near 1.0150 early Tuesday.
GBP/USD dropped to its weakest level in more than a week at 1.2035 during the Asian trading hours on Tuesday. Although the pair managed to recover to 1.2050, it's struggling to gather recovery momentum.
USD/JPY fluctuated in a relatively wide range on Monday but closed the day virtually unchanged near 133.50. The pair is having a hard time making a decisive move in either direction early Tuesday.
Gold suffered heavy losses and dropped toward $1,770 on Monday. With the 10-year US T-bond yield edging lower during the American trading hours, XAU/USD edged slightly higher and steadied near $1,780.
Bitcoin struggled to build on the previous week's gains on Monday and seems to have gone into a consolidation phase at around $24,000 on Tuesday. After having failed to break above $2,000 Ethereum edged lower and was last seen losing 1% on the day at $1,880.
In the view of economists at ING, the EUR/GBP could move back lower to the 0.8400/0.8390 area while the GBP/USD has a chance to drop under 1.20 again.
EUR/GBP can soften a little
“News that Germany will impose a gas levy – confirming that the government cannot fully shield households from the spike in gas prices – leaves the UK less of an outlier in Europe. This will be one of the factors helping to limit EUR/GBP gains and could actually favour a drift back to the 0.8390/8400 area.”
“EUR/GBP can soften a little, but a stronger dollar means that cable can go sub 1.20 again.”
NZD/USD extends pullback ahead of the Reserve Bank of New Zealand (RBNZ) meeting. Economists at ING expect the pair to return to 0.64 by the end of the year.
Watch for a dovish tilt by the RBNZ
“We see some non-negligible risk that the RBNZ will have to revise its rate path projections lower. Even if the RBNZ hikes by 50 bps (as per our base case scenario and market expectations) the downside risks from a dovish repricing are quite material for the New Zealand dollar.”
“We suspect NZD/USD will struggle to hold onto recent gains over 0.64 over coming weeks.”
“Our base case is a return to 0.64 by year-end in NZD/USD, largely due to some potential USD weakness much later in the year.”
The Reserve Bank of Australia’s (RBA) August meeting minutes provided colour around the third consecutive 50 bps hike and risks to the outlook. AUD/USD consolidates daily losses above 0.70 but the pair is set to slide below this level, according to economists at Commerzbank.
Meeting minutes confirm cautious stance of RBA
“The minutes of the RBA meeting reiterates that the RBA sees downside risks to the economy and will therefore act in a more data-dependent manner going forward. Due to high inflation and the tight labor market, it sees the need for further interest rate hikes. However, there is no predefined path for this, it said. With this rather cautious stance, the RBA offers no reason for higher levels in AUD/USD.”
“If China's economic outlook deteriorates further, this would not be good news for the Australian economy either. The move above 0.70 in AUD/USD could therefore prove to be unsustainable.”
Having corrected 3% lower, some are asking whether the dollar has peaked. Economists at ING argue that the dollar is more likely to retest its highs than correct much lower.
Curb your peak dollar enthusiasm
“Many trading partners would hope that to be the case, but the reality is that the Fed is likely to stay on track with its tightening. We think the dollar is more likely to retest its highs than correct much lower.”
“Driving our view has been consistent rhetoric from the Fed that it will not be blown off target by some softer activity or price data.”
“It now looks like US activity is accelerating again as lower gasoline prices leave more dollars in the pockets of US consumers. The 2023 US recession narrative looks a tough one to sell near term.”
See: USD strength to persist as Fed’s dovish pivot still sits further in the future – HSBC
The Washington Post (WaPo) carried a story on Tuesday, citing that Chinese authorities ordered factories to suspend production in several major manufacturing regions to preserve electricity, as the country face the worst heat wave in six decades.
Key details
“Sichuan province, home to more than 80 million people, announced Monday that factories in 19 cities and prefectures would halt operations until Saturday to preserve electricity for "use by the people."
“Other areas across China's south have also ordered electricity to be prioritized to run air-conditioners.”
Jin Xiandong, a spokesman for the National Development and Reform Commission (NDRC), said on Tuesday that China was having to rely more on coal for power, as the heat wave and drought were significantly reducing hydropower output.
Market reaction
AUD/USD extends the retreat from daily highs of 0.7040 on the above report, losing 0.06% on the day to 0.7017, at the press time.
As the Bank of England (BoE) is probably acting too cautiously and the election of the new prime minister could cause a bit more nervousness in the markets, the British pound is set to remain under pressure, economists at Commerzbank report.
Election likely to weigh on the pound
“The concerns about the economy – after all, the BoE expects a recession next year – seem to prevent the BoE from implementing a truly active monetary policy to fight inflation. This should make the pound unattractive from an investor's point of view.”
“The pound could remain under depreciation pressure as long as the prospects for Truss to win the election remain favorable.”
The market’s reaction to the July FOMC and Consumer Price Index (CPI)I release shows a premature eagerness to price in a Fed “pivot”. Economists at HSBC believe the Fed’s tightening path and associated USD strength are likely to persist until there is more evidence of slowing US core inflation.
It seems premature for market to price in a Fed dovish pivot
“Until there are further clear and sustained signs that US core inflation is destined to return to target, the Fed’s tightening path and associated USD strength are likely to persist.”
“We suspect the FX market continues to underplay the importance of the global economic slowdown underway. The risk-averse implications of this slowdown will continue to support the USD, given its ‘safe haven’ status.”
The kiwi is lower this morning. Economists at ANZ expect the NZD/USD pair to react positively to a hawkish Reserve Bank of New Zealand (RBNZ) but the impact could be short-lived.
A hawkish RBNZ
“It’s too soon to say if it’s a factor, but we may just be in the early stages of the USD coming back into favour for safe-haven reasons amid concerns around global growth.”
“We still think the NZD will probably reward RBNZ hawkishness tomorrow, but there are a lot of other balls in the air, and the local impact may well be short-lived.”
“Support 0.6060/0.6290 Resistance 0.6575/0.6660”
With its decision on June 16, the Swiss National Bank (SNB) performed a U-turn. Against the euro, the Swiss franc has since gained a good 6%. And that must be exactly the goal if the SNB wants to fight inflation by means of CHF strength, in the view of economists at Commerzbank.
Can "leaning against the wind" be successful?
“The SNB's new intervention policy is currently preventing any significant EUR/CHF recovery phase. Because an exchange rate that cannot rise significantly is likely to fall with increasing speed, increasing Swiss franc appreciation speed is likely.”
“Although the SNB also threatens to intervene in the event of excessive CHF appreciation, these are unlikely to prevent significant CHF appreciation in the medium-term if they are interpreted by the market as ‘leaning against the wind’.”
Bets for USD/JPY to slip back to the 131.65 level now appear diminished, suggested FX Strategists at UOB Group Lee Sue Ann and Quek Ser Leang.
Key Quotes
24-hour view: “We held the view yesterday that USD ‘is likely to edge lower but is unlikely to threaten the support at 132.40’. Our view was not wrong as USD dropped to 132.54 before rebounding. Downward momentum has eased and USD is likely to consolidate for today, expected to be within a range of 132.60/133.70.”
Next 1-3 weeks: “Our latest narrative was from last Thursday (11 Aug, spot at 132.85) where USD could consolidate for a couple of days first before declining to 131.65. Since then, USD has not been able to make much headway on the downside. Downward momentum is beginning to wane and the odds for USD to decline to 131.65 have diminished. However, only a break of 134.00 (‘strong resistance’ level was at 134.40 yesterday) would indicate that the downside risk has dissipated.”
Economists at Commerzbank expect a recession in the US next year. Nevertheless, as the picture of an overall still robust US economy remains intact, so is the dollar.
USD remains in demand
“It is true that we expect a recession in the US early next year. But the point at which the US Federal Reserve will have to worry seriously about the economy is still some way off. And uncertainty about the extent to which the US economy will weaken at all is still high. It therefore still seems too early to price a recession into US exchange rates.”
“The retail sales data due tomorrow should confirm the picture of a robust US economy for the time being. So as long as there are no clear signs of an economic slowdown yet, the active course of the Fed should support the USD.”
Gold stalled its intraday decline just ahead of the $1,770 area and edged higher during the Asian session on Tuesday. Any meaningful upside, however, seems elusive ahead of the FOMC minutes on Wednesday, FXStreet’s Haresh Menghani reports.
Limited upside potential for XAU/USD ahead of FOMC minutes
“The markets are currently pricing in a greater chance of at least a 50 bps rate hike at the September FOMC meeting. Hence, the minutes would be looked upon for clues about the possibility for a larger 75 bps move. This would play a key role in influencing the near-term USD price dynamics and provide a fresh directional impetus to the non-yielding gold.”
“Repeated failures to find acceptance above the $1,800 mark warrants some caution for bullish traders. Any further move up, however, might now confront resistance near the $1,788-$1,789 region. This is followed by the aforementioned handle and last week's swing high, around the $1,808 area. Some follow-through buying would mark a breakout and lift gold towards the next relevant hurdle near the $1,824-$1,825 region.”
“The overnight swing low, around the $1,772 area now seems to protect the immediate downside. Sustained weakness below would expose the $1,754-$1,752 strong resistance breakpoint, now turned support. A convincing breakthrough the latter would shift the bias in favour of bearish traders and drag gold towards the $1,728 intermediate support en route to the $1,715 zone.”
FX option expiries for August 16 NY cut at 10:00 Eastern Time, via DTCC, can be found below.
- EUR/USD: EUR amounts
- 1.0100 278m
- 1.0125 246m
- 1.0145-55 1.15b
- 1.0160-65 469m
- 1.0170-75 842m
- 1.0185-90 365m
- 1.0250 805m
- USD/JPY: USD amounts
- 133.00 390m
- USD/CHF: USD amounts
- 0.9640 500m
- AUD/USD: AUD amounts
- 0.7000 490m
- 0.7300 640m
- USD/CAD: USD amounts
- 1.2650 282m
- 1.2800 308m
- 1.2900 290m
According to preliminary readings from CME Group for natural gas futures markets, open interest rose for the third consecutive session on Monday, now by just 230 contracts. Volume followed suit and went up by around 4.5K contracts.
Natural Gas: Upside limited by $9.00
Prices of natural gas charted an inconclusive session at the beginning of the week against the backdrop of rising open interest and volume. That said, the commodity faces prospects for further consolidation ahead of the $9.00 mark per MMBtu. Further upside should put a test of the 2022 high at $9.75 (July 26) back on the radar sooner rather than later.
Economists at Westpac expect that safe-haven demand will give way to a period of US dollar weakness over the year ahead, with a related rise in the New Zealand dollar and other commodity currencies. However, the potential for gains relative to the Australian dollar looks limited, with the NZD/AUD set to hold around current levels.
US dollar to trend down over the coming year
“We expect that the recent period of safe-haven demand will give way to US dollar weakness, with a sharp slowdown in US consumption and investment spending expected over 2023. Consistent with that, we expect to see the US dollar trending down over the coming year.”
“Underpinned by weakness in the US dollar, we expect the New Zealand dollar will rise to 66 cents by year’s end, with a further lift on the cards through 2023.”
“We expect the AUD/NZD pair will remain around the 0.90 level through 2023, with limited scope for a break to the upside despite the prospect of a sharper deceleration in growth for Australia.”
NZD/USD is now expected to navigate within the 0.6300-0.6435 range in the next few weeks, note FX Strategists at UOB Group Lee Sue Ann and Quek Ser Leang.
Key Quotes
24-hour view: “We expected NZD to ‘trade within a range of 0.6430/0.6475’ yesterday. We did not anticipate the sharp sell-off that sent NZD plunging by a whopping 1.46% (NY close of 0.6362). Not surprisingly, conditions are oversold but there is room for the weakness in NZD to extend to 0.6330 first before stabilization is likely. Resistance is at 0.6385 followed by 0.6405.”
Next 1-3 weeks: “The surprisingly sharp sell-off that took out our ‘strong support’ level at 0.6370 indicates that the NZD strength that started late last week (see annotations in the chart below) has ended. While shorter-term downward momentum has improved somewhat, the current movement is likely part of a consolidation phase. From here, NZD is likely to trade within a range of 0.6300/0.6435.”
- GBP/USD pays little heed to mixed jobs report from the UK.
- UK Claimant Count Change improved in July, Unemployment Rate steadies for three months to June.
- Risk-aversion underpins US dollar rebound but sluggish yields restrict moves ahead of FOMC Minutes.
- Second-tier US data, slowdown chatters will offer additional details for clear directions.
GBP/USD treads water around 1.2050 as the UK employment data fails to impress traders during the initial London open on Tuesday. Also challenging the Cable pair traders is the inaction at the bond markets ahead of Wednesday’s release of the Fed Minutes, not to forget mixed concerns surrounding recession.
As per the latest UK jobs report from the National Statistics, the headline Claimant Count Change improved to -10.533K in July versus -32K expected and -20K prior. Further, the ILO Unemployment Rate matched 3.8% expected and previous readings for three months to June.
Also read: UK ILO Unemployment Rate steadies at 3.8% in June, meets estimates
It should be observed that the Bank of England’s (BOE) push for higher wages seems satisfied with the latest data, suggesting aggressive rate hikes from the “Old Lady”. However, the BOE is already alleged to be slow and hence the GBP/USD buyers couldn’t cheer the data.
Other than the mixed UK data, sluggish yields also challenge GBP/USD traders of late. However, economic slowdown fears join hopes of Fed’s aggression, despite softer US inflation, appear to underpin the US dollar’s safe-haven demand, which in turn keeps the Cable buyers hopeful.
Elsewhere, the British political system appears to be volatile of late as the contenders to the Prime Minister’s (PM) post fail to convince voters that they can freeze energy bills. The same helped Labour Party Leader Keir Starmer to pledge that families would not “pay a penny more” on energy bills this winter after unveiling a £29bn plan, per The Guardian. The political uncertainty also joins the Brexit woes, amid a lack of progress on the Northern Ireland (NI) deal, to keep the GBP/USD buyers in check.
Having witnessed the initial reaction to the UK’s latest employment report, the GBP/USD pair traders should concentrate on the risk catalysts surrounding recession and the UK politics. Also important will be the US Building Permits, Housing Starts and Industrial Production numbers for July.
Technical analysis
A clear downside break of the convergence of the 21-DMA and an upward sloping trend line from mid-July, around 1.2100-2110, keep GBP/USD sellers hopeful. Also suggesting the pair’s further downside is the descending RSI (14), not oversold, as well as a looming bear cross on the MACD.
That said, the pair is likely declining towards the horizontal area comprising multiple levels marked since June, around 1.1930. However, the 1.2000 psychological magnet may offer an intermediate halt during the anticipated fall.
Considering advanced prints from CME Group for crude oil futures markets, traders scaled back their open interest positions by mor than 8K contracts on Monday, following two daily builds in a row. On the other hand, volume partially reversed the previous pullback and went up by around 16.3K contracts.
WTI remains under pressure in the sub-$90.00 area
Prices of the barrel of the WTI extended the leg lower on Monday amidst declining open interest. That said, a deeper pullback appears unlikely in the very near term, while bullish attempts look capped by the 200-day SMA around $95.50 for the time being.
- The Unemployment Rate in the UK steadied at 3.8% in May.
- UK Claimant Count Change arrived at -10.533K in July.
- The UK wages excluding bonuses rose by 4.7% YoY in June vs. 4.5% expected.
The Office for National Statistics (ONS) showed on Tuesday, the UK’s official jobless rate stood unchanged at 3.8% in June vs. 3.8% expected while the claimant count change showed a less than expected drop last month.
The number of people claiming jobless benefits dropped by 10.533K in July when compared to -20K booked previously and -32K expectations.
The UK’s average weekly earnings, excluding bonuses, arrived at +4.7% 3Mo/YoY in June versus +4.3% last and +4.5% expected while the gauge including bonuses came in at +5.1% 3Mo/YoY in June versus +6.2% previous and +4.5% expected.
GBP/USD reaction
GBP/USD shrugs off the mixed UK employment data, as it holds steady at 1.2050, as of writing.
About UK jobs
The UK Average Earnings released by the Office for National Statistics (ONS) is a key short-term indicator of how levels of pay are changing within the UK economy. Generally speaking, the positive earnings growth anticipates positive (or bullish) for the GBP, whereas a low reading is seen as negative (or bearish).
In Australia, growth is likely to hold up better than in several other major economies into 2023. Therefore, economists at Rabobank maintain their forecast of a move to AUD/USD 0.74 on a 12-minth view
Relatively better?
“Australia is facing slowing economic growth into next year. However, even with aggressive interest rate hikes from the RBA this year, the 2023 outlook appears more buoyant than in many other major economies including the US, Eurozone and the UK. This bodes well for the medium-term AUD outlook vs. a basket of other G10 currencies.”
“Although we see risk that another bout of safe haven USD buying could push AUD/USD lower on a one to three-month view, we favour buying the currency pair on dips and expect a move to 0.74 on a 12-month view.”
- Steel price grinds higher around six-week top amid China’s attempt to tame economic slowdown fears.
- China’s state planner braced for more measures to keep the economy afloat as PBOC rate cut fails to impress optimists.
- An increase in Chinese steel output also challenges metal buyers amid fears of hawkish Fed, sluggish yields.
Steel price remains mildly bid as traders take China’s efforts to revive economic optimism with a pinch of salt during early Tuesday in Europe. Also exerting downside pressure on the industrial metal is the recent increase in China’s output and inactive bond markets amid hopes of aggressive rate hikes from the Fed, despite the latest weakness in the US data.
That said, Steel Rebar Futures on the Shanghai Futures Exchange (SFE) gained 0.3% around 4,170 yuan per metric tonne. However, Shanghai hot-rolled coil slipped 0.3% intraday whereas stainless steel dropped 0.4% on a day at the latest.
“Chinese regulators have instructed state-owned China Bond Insurance Co. Ltd. to provide guarantees for onshore bond issuance by a few private property developers, Reuters reported on Monday,” said Reuters.
It’s worth noting that China’s state planner National Development and Reform Commission (NDRC) announced multiple measures to avoid recession fears as it said, “We pledge to keep the economy within reasonable bounds.” The NDRC approved 65 fixed-asset investment projects worth a total of 1.028 trillion yuan in Jan July, per Reuters. The news also mentioned that the NDRC approved 8 fixed-asset investment projects worth a total of 236.8 billion yuan in July.
On the different page, Reuters conveyed data showing an increase in China’s steel output, which in turn challenges the metal buyers amid hopes of more supply, in contrast to the economic slowdown fears. “Average daily crude steel output among member mills of China Iron & Steel Association during the first 10 days of August rose 2.8%, or 53,100 tonnes, to 1.94 million tonnes from late July, consultancy and data provider Mysteel reported,” per Reuters.
Looking forward, steel traders should expect further grinding of the metal prices towards the north amid efforts from the major customer to renew demand concerns. However, a looming recession could challenge the upside momentum. Also important to watch will be the Fed Minutes amid indecision over the US central bank’s next move.
In the opinion of FX Strategists at UOB Group Lee Sue Ann and Quek Ser Leang, GBP/USD could accelerate losses on a breach of the 1.2000 support in the short term.
Key Quotes
24-hour view: “We expected GBP to weaken yesterday but we were of the view that ‘the major support at 1.2050 is not expected to come under threat’. GBP subsequently weakened more than expected as it dropped to 1.2051 before closing at 1.2053 (-0.68%). Despite the decline, downward momentum has not improved by all that much. That said, the risk is still on the downside but a clear break of the next major support at 1.2000 is unlikely. Resistance is at 1.2080 followed by 1.2110.”
Next 1-3 weeks: “We noted yesterday (15 Aug, spot at 1.2135) that upward momentum has dissipated and we expected GBP to trade within a range of 1.2050/1.2245. We did not expect the rapid manner by which GBP approaches the bottom of the expected range (low of 1.2051 in NY). Downward momentum is beginning to build but GBP has to break the major support at 1.2000 before a sustained weakness is likely. On the upside, a breach of 1.2150 would indicate that the build-up in downward momentum has dissipated. Looking ahead, the next support below 1.2000 is at 1.1920.”
Gold closed the fourth straight week in positive territory. Next direction depends on September Federal Reserve hike bets, FXSTreet’s Eren Sengezer reports.
Markets look for fresh clues regarding the size of the Fed’s next rate increase
“On Tuesday, Building Permits and Housing Starts data for July will be featured in the US economic docket. A sharp decline in Housing Starts could trigger a flight to safety and help the dollar gather strength.”
“On Wednesday, the FOMC will publish the minutes of its July policy meeting. If the minutes show that the Fed sees a heightened risk of recession, the greenback could lose interest and open the door for a leg higher in gold. On the other hand, investors could reassess the Fed’s rate outlook in case they are convinced that the Fed will stay on an aggressive tightening path until they see consecutive drops in inflation figures.”
“In short, XAU/USD is likely to remain inversely correlated with the US T-bond yields mid-week.”
Open interest in gold futures markets reversed three consecutive daily builds and shrank by around 3.5K contracts at the beginning of the week, as per flash data from CME Group. Volume, instead, went up by nearly 18K contracts after two daily drops in a row.
Gold: Rebound now targets $1,800
Gold started the week on the back foot, coming all the way down from the area just above the key $1,800 mark. The noticeable downtick was accompanied by shrinking open interest, which removes strength from further retracements and exposes a probable bounce in the very near term. Against that, the immediate hurdle for the precious metal emerges at the $1,800 mark per ounce troy.
According to FX Strategists at UOB Group Lee Sue Ann and Quek Ser Leang, EUR/USD could slip bck below the 1.0100 level in the next weeks.
Key Quotes
24-hour view: “Our view for EUR to range-trade yesterday was incorrect as it dropped sharply to 1.0153 before closing on a weak note at 1.0160 (0.96%). Strong downward momentum suggests EUR could weaken further but a sustained decline below the early Aug low near 1.0120 is unlikely. On the upside, a breach of 1.0205 (minor resistance is at 1.0185) would indicate that the current weakness has stabilized.”
Next 1-3 weeks: “Yesterday (15 Aug, spot at 1.0260), we highlighted that ‘conditions remain overbought and this coupled with waning momentum suggests the odds for EUR to advance to 1.0400 have diminished’. However, we did not expect the sharp sell-off as EUR cracked our ‘strong support’ level at 1.0230 and plummeted to 1.0153 before closing on a weak note at 1.0160 (-0.96%). The rapid improvement in downward momentum suggests EUR could weaken further to 1.0120, as low as 1.0095. Overall, only a breach of 1.0250 (‘strong resistance’ level) would indicate that the current weakness is unlikely to extend lower.”
- AUD/USD struggling to extend recovery amid calmer risk tones.
- US dollar clings to Monday’s gains while RBA minutes fail to impress.
- Bulls cross on the 1D chart could help the aussie stay afloat.
AUD/USD is fluctuating between gains and losses while trading above 0.7000, as the bull-bear tug-of-war extends into European trading.
After Monday’s risk-aversion-driven broader market sell-off, in the face of poor Chinese activity numbers, the aussie sees calmer tones this Tuesday.
The major consolidates the rebound, with the latest upside fuelled by the RBA minutes, even though the board said that the central bank is not on a pre-set tightening path.
The Asian markets have also staged a tepid recovery amid expectations of more stimulus from Chinese authorities to revive the economic recovery. The risk reset has paused the dollar rally, for now, helping the aussie stay afloat above 0.7000.
From a short-term technical perspective, the pair continue to find demand at lower levels, as the 21 DMA has crossed the 100 DMA for the upside on a daily closing basis, confirming a bull cross.
Therefore, it could be safe to say that the sell-off triggered following a rejection at a critical horizontal 200-Daily Moving Average (DMA) at 0.7120 may be facing exhaustion.
The 14-day Relative Strength Index (RSI) has turned flat while above the midline, supporting the view of the ‘buy the dips’ trade.
Buyers need to crack the daily high of 0.7070, above which is the 0.7100 round figure.
On the flip side, the immediate downside cap aligns at 0.7000, below which sellers will look to challenge the 0.6970 demand area, where the 21 and 100 DMAs hang around.
AUD/USD: Daily chart
AUD/USD: Additional levels to consider
- USD/JPY picks bids to pare recent losses inside a short-term triangle.
- Multiple key hurdles to the north, sluggish oscillators suggest further grinding.
- Bears need validation from 132.30 to retake control.
USD/JPY regains upside momentum, after snapping two-day advances the previous day, even as the yen pair seesaws inside a short-term triangle around 133.50 heading into Tuesday’s European session.
In addition to the three-week-long symmetrical triangle, sluggish MACD and RSI (14) also suggest further hardships for the latest USD/JPY run-up.
That said, the 100-SMA adds strength to the stated triangle’s resistance line and challenges bulls around 134.25.
Following that, the 200-SMA level near 135.60 will be a crucial hurdle to cross for the USD/JPY buyers before targeting the mid-July swing high surrounding 139.40 and the 140.00 psychological magnet.
Alternatively, the pullback move remains elusive until the quote stays beyond the stated triangle’s support line, at 133.00 by the press time.
It’s worth noting, however, that multiple swing lows around 132.30 could act as extra filters to the south to watch for USD/JPY bears.
Overall, USD/JPY is likely to keep the latest range-bound moves unless crossing the 200-SMA hurdle. Also likely to limit the yen pair’s action are the sluggish yields.
USD/JPY: Four-hour chart
Trend: Further downside expected
- Gold price consolidates the biggest daily fall in a month amid market’s inaction.
- Economic slowdown fears surrounding the US, Europe and China challenge buyers.
- Sluggish yields, lack of market activity ahead of the key Fed Minutes restrict XAU/USD moves.
Gold price (XAU/USD) pares the recent losses at around $1,780 as a sluggish session allows sellers to consolidate downside moves during Tuesday morning in Europe. Even so, market’s fears relating to the economic conditions in the US, Europe and China seem to keep the commodity buyers hopeful.
Softer prints of the US and China data, as well as downbeat Treasury yields, also portray the economic fears, not to forget the Sino-American tussles. On the same line was the German economic crisis. Europe works on a nuclear deal with Iran to battle the energy crisis at home. However, Tehran’s response appears not so positive as Tehran's "additional views and considerations" to the EU text would be conveyed later, per Reuters. It’s worth noting that German Economy Minister Robert Habeck said on Monday, as reported by Reuters, “Germany's Russia-dependent energy model has failed and isn't coming back."
On the same line could be the geopolitical tussles relating to China. Xinhua reported that China imposes sanctions on a number of Taiwan separatists. Previously, the visit of multiple US lawmakers to Taiwan irritated Beijing, which in turn led to fierce military drills near the Taiwan border and an escalation of the geopolitical risks.
Elsewhere, US NY Empire State Manufacturing Index for August dropped to -31.3 from 11.1 in July and 8.5 in market forecasts. Further, the US August NAHB homebuilder confidence index also fell to 49 versus 55, its lowest level since the initial months of 2020. On the other hand, China released downbeat Retail Sales and Industrial Production data for July while also conveying a rate cut from the People’s Bank of China (PBOC). However, market chatters that China’s efforts aren’t enough to restore the market’s sentiment appear to exert additional downside pressure on the XAU/USD prices.
Against this backdrop, the US 10-year Treasury yields snap a two-day downtrend around 2.78% but stays sluggish of late. Further, the S&P 500 Futures decline 0.10% intraday at the latest.
Looking forward, today’s German ZEW Economic Sentiment data for August will precede the US Building Permits, Housing Starts and Industrial Production numbers for July for fresh impulse. Above all, Fed Minutes will be crucial amid indecision over the US central bank’s next move.
Technical analysis
Gold price portrays a corrective pullback from the 61.8% Fibonacci retracement (Fibo.) of August 03-10 upside amid recently firmer MACD.
However, the recovery moves need validation from the previous support line from August 09 and the 200-HMA, respectively around $1,783 and $1,785, to recall XAU/USD bulls.
Even so, the $1,800 threshold and the monthly peak surrounding $1,808 could challenge the metal’s further upside.
Alternatively, a downside break of the 61.8% Fibo. level of $1,775 cold quickly fetches the quote towards the monthly low near $1,754.
It’s worth noting, however, that there are multiple supports to challenge gold bears around $1,740 and the $1,700 round figure to watch past $1,754.
Gold: Hourly chart
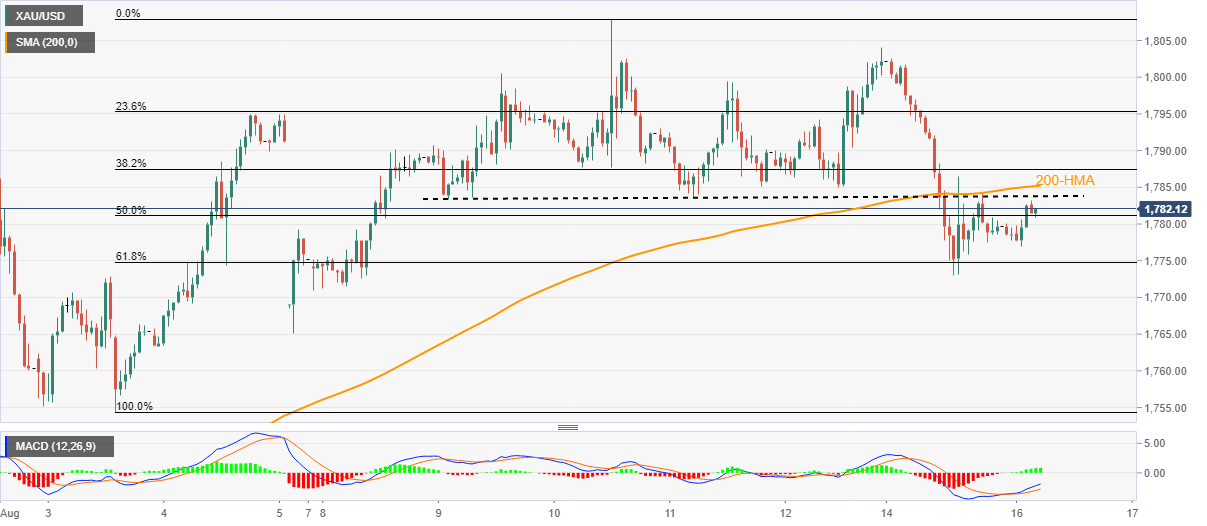
Trend: Further weakness expected
- EUR/USD retreats from intraday high during a sluggish session.
- Growth concerns underpin US dollar demand even as downbeat data challenges the pair bears.
- German energy crisis emphasizes ZEW data for fresh impulse.
- Second-tier US economics could also entertain traders ahead of the key Wednesday.
EUR/USD licks its wounds around 1.0160, after a brief corrective pullback, as fears surrounding economic slowdown join pre-data anxiety. With this, the major currency also justifies the bearish technical formation during early Tuesday morning in Europe.
Europe works on a nuclear deal with Iran to battle the energy crisis at home. However, Tehran’s response appears not so positive as Tehran's "additional views and considerations" to the EU text would be conveyed later, per Reuters. It’s worth noting that German Economy Minister Robert Habeck said on Monday, as reported by Reuters, “Germany's Russia-dependent energy model has failed and isn't coming back."
On the other hand, softer prints of the US and China data and downbeat Treasury yields also portray the economic fears, not to forget the Sino-American tussles. On Monday, US NY Empire State Manufacturing Index for August dropped to -31.3 from 11.1 in July and 8.5 in market forecasts. Further, the US August NAHB homebuilder confidence index also fell to 49 versus 55, its lowest level since the initial months of 2020. On the other hand, China released downbeat Retail Sales and Industrial Production data for July while also conveying a rate cut from the People’s Bank of China (PBOC).
Even so, market chatters that China’s efforts aren’t enough to restore the market’s sentiment appear to exert additional downside pressure on the EUR/USD prices.
Furthermore, the fears about the US-China tussles grow and weigh on the EUR/USD prices as Xinhua reported that China imposes sanctions on a number of Taiwan separatists. Previously, the visit of multiple US lawmakers to Taiwan irritated Beijing, which in turn led to fierce military drills near the Taiwan border and an escalation of the geopolitical risks.
Amid these plays, the US 10-year Treasury yields snap a two-day downtrend around 2.78% while the S&P 500 Futures decline 0.10% intraday at the latest.
Given the German crisis, today’s ZEW Economic Sentiment data for August will be crucial to gauge the economic health of the European powerhouse. That said, firmer data could help EUR/USD bears to take a breather ahead of the US session’s scheduled release of the US Building Permits, Housing Starts and Industrial Production numbers for July for fresh impulse. Above all, Fed Minutes will be crucial amid indecision over the US central bank’s next move.
Technical analysis
In addition to the clear downside break of the 21-DMA and monthly ascending trend line, descending RSI (14) and receding bullish bias of the MACD also keep the EUR/USD bears hopeful. With this, the EUR/USD pair becomes vulnerable to visiting the one-month-old horizontal support around 1.0100.
Also read: EUR/USD Price Analysis: Sellers keep control below 1.0200 support-turned-resistance
- USD/INR struggles to extend recent pullback amid off in Indian currency, bond markets.
- Growth fears surrounding China, US keep buyers hopeful amid a sluggish session.
- Hawkish hopes from Fed minutes put a floor under the prices.
- Second-tier US data, risk catalysts can entertain intraday traders.
USD/INR picks up bids to pare recent losses around 79.58 during the mid-Asian session on Tuesday. In doing so, the Indian rupee (INR) pair justifies the market’s risk-off mood amid sluggish trading hours, while also respecting the bullish chart pattern.
That said, economic slowdown fears concerning China and the US appear to be the major challenge for the USD/INR bears. Also putting a floor under the USD/INR prices is the market’s anxiety ahead of Federal Open Market Committee (FOMC) meeting minutes.
The growth fears recently gained momentum after China released downbeat Retail Sales and Industrial Production data for July on Monday. On the same were data suggesting a lack of credit demand for China’s easy loan funds and the surprise rate cut from the People’s Bank of China (PBOC).
The pessimism also escalated as stronger as China President Xi Jinping showed readiness to take more measures after the previous day’s downbeat statistics. Xinhua News Agency quoted China President Xi saying that they will “use new development ideas in economic growth”. The comments rolled out after downbeat prints of Retail Sales, Industrial Production and Loan Growth for July.
It should be noted, though, that the fears about the US-China tussles grow and challenges the USD/INR sellers as Xinhua reported that China imposes sanctions on a number of Taiwan separatists. Previously, the visit of multiple US lawmakers to Taiwan irritated Beijing, which in turn led to fierce military drills near the Taiwan border and an escalation of the geopolitical risks.
On Monday, US NY Empire State Manufacturing Index for August dropped to -31.3 from 11.1 in July and 8.5 in market forecasts. Further, the US August NAHB homebuilder confidence index also fell to 49 versus 55, its lowest level since the initial months of 2020. Although the recent US data joins the previous week’s softer inflation figures, the Fed policymakers remain hawkish, which in turn keeps the USD/CNH buyers hopeful.
Against this backdrop, the US 10-year Treasury yields snap a two-day downtrend around 2.79% while the S&P 500 Futures decline 0.10% intraday at the latest.
Given the off in Indian currency and bond markets, USD/INR pair traders will keep their eyes on the US Building Permits, Housing Starts and Industrial Production numbers for July for fresh impulse. However, Fed Minutes will be crucial amid indecision over the US central bank’s next move.
Technical analysis
USD/INR keeps the previous day’s bounce off the 200-SMA after posting a two-day downtrend. The recovery moves also gain support from the firmer RSI (14) line and an impending “golden cross”.
That said, a sustained piercing of the 50-SMA to the 200-SMA appears necessary to confirm the bullish moving average crossover.
In that case, a run-up towards the monthly resistance line near 79.90 becomes imminent. Following that, the 80.00 threshold and the recent record top near 80.20 will be in focus.
Alternatively, a downside break of the two-week-old support line, at 79.40 by the press time, could defy the bullish hopes by directing the USD/INR bears towards the 79.00 round figure.
USD/INR: Four-hour chart
Trend: Further upside expected
The Securities Times carried a story on Tuesday, noting that the People’s Bank of China’s (PBOC) surprise rate cut announced on Monday may be the first in a series of policies to stabilize growth in the second half of the year.
Additional takeaways
“Besides monetary policies, China should also use more fiscal stimulus to boost domestic demand.”
“In addition, more industrial policies and local property market measures are crucial to drive the recovery in production and consumption.”
“Chinese banks are expected to cut the loan prime rates this month following the PBOC’s move on Monday.”
Market reaction
USD/CNY keeps its retracement intact from three-month highs of 6.7942 reached in opening trades. The spot is currently trading at 6.7846, still up 0.16% on the day.
- GBP/USD recovers losses to trade back above 1.2050 amid risk reset.
- The US dollar eases while the US Treasury yields remain sluggish.
- Critical UK economic data are awaited ahead of the Fed minutes.
GBP/USD has paused its three-day sell-off near mid-1.2000s, as bears take breather ahead of the UK employment data release. The UK ILO Unemployment Rate is seen steady at 3.8% in June while the average hourly earnings ex-bonus are likely to tick higher from 4.3% to 4.5% in June.
The last jobs report came in strong and therefore lifted odds for a 50 bps BOE rate hike in September. Ever since, the energy crisis in the UK and Europe has worsened while the global economic outlook has turned dour. Besides, the UK jobs data, Wednesday’s inflation data will hold the key for the BOE’s next rate hike trajectory.
On the USD side of the equation, markets are seeing a bit of a risk recovery amid chatters over potential stimulus from China after the country reported dismal activity numbers a day ago. Although escalating China-Taiwan tensions keep investors unnerved, especially after Beijing sanctioned Taiwanese officials on Tuesday for supporting Taiwan's independence. Democratically self-ruled Taiwan continues to reject China's claim of sovereignty.
The cautious optimism is capping the recent upside in the US dollar against its major peers, with the US dollar index losing 0.07% on the day to trade at 106.48, as of writing. On Wednesday, the US Retail Sales and the Fed minutes will also grab attention, with a 50 bps September Fed rate hike seen as the best bet so far.
GBP/USD: Technical levels to consider
| Raw materials | Closed | Change, % |
|---|---|---|
| Silver | 20.258 | -2.64 |
| Gold | 1778.74 | -1.26 |
| Palladium | 2150.87 | -2.87 |
The National Development and Reform Commission, the country’s state planner, reiterated on Tuesday, “we pledge to keep the economy within reasonable bounds.”
Additional comments
Macro policies should be strong, reasonable and moderate in expanding demand actively.
Approved 65 fixed-asset investment projects worth a total of 1.028 trillion yuan in Jan July.
Approved 8 fixed-asset investment projects worth a total of 236.8 billion yuan in July.
Separately a PBOC-backed financial news reported earlier on, “China requires additional policy stimuli to boost economic growth.”
- USD/CNH retreats from three-month high as traders seek fresh clues.
- A jump in Chinese Means of Production Prices also likely to have favored sellers.
- Fears surrounding China’s economic growth, tussles over Taiwan restrict the immediate downside.
- Mixed US data, Fedspeak also keep traders on the edge ahead of Wednesday’s Fed Minutes.
USD/CNH extends pullback from a three-month high to 6.8020 while consolidating the biggest daily jump since March 2020 during Tuesday’s Asian session. In doing so, the offshore Chinese yuan (CNH) pair fails to justify the recent risk-off mood. The reason could be linked to the market’s reassessment of fears that the world’s second-largest economy is on the way to recession despite the policymakers’ hard efforts.
The latest weakness could also be attributed to the second-tier data from China as Xinhua News Agency quotes the National Bureau of Statistics (NBS) while mentioning, “Of the 50 major goods monitored by the government, which include seamless steel tubes, gasoline, coal, fertilizer and some agricultural products mainly used for processing, 27 saw their prices increase, while 20 posted lower prices.”
However, the growth fears seem stronger as China President Xi Jinping showed readiness to take more measures after the previous day’s downbeat statistics.
Xinhua News Agency quoted China President Xi saying that they will “use new development ideas in economic growth”. The comments rolled out after downbeat prints of Retail Sales, Industrial Production and Loan Growth for July.
It should be noted, though, that the fears about the US-China tussles grow and challenges the USD/CNH sellers as Xinhua reported that China imposes sanctions on a number of Taiwan separatists.
Previously, the visit of multiple US lawmakers to Taiwan irritated Beijing, which in turn led to fierce military drills near the Taiwan border and an escalation of the geopolitical risks.
On the same line were the latest comments from China’s State Planner suggesting, “Macro policies should be strong, reasonable and moderate in expanding demand actively,” per Reuters.
On Monday, US NY Empire State Manufacturing Index for August dropped to 31.3 in August from 11.1 in July and 8.5 in market forecasts. Further, the US August NAHB homebuilder confidence index also fell to 49 versus 55, its lowest level since the initial months of 2020. Although the recent US data joins the previous week’s softer inflation figures, the Fed policymakers remain hawkish, which in turn keeps the USD/CNH buyers hopeful.
Amid these plays, the US 10-year Treasury yields snap a two-day downtrend around 2.79% while the S&P 500 Futures decline 0.10% intraday at the latest.
Moving on, US Building Permits, Housing Starts and Industrial Production numbers for July should direct intraday moves of the USD/CNH pair ahead of Wednesday’s Federal Open Market Committee (FOMC) meeting minutes.
Technical analysis
USD/CNH holds onto the previous day’s upside break of an ascending resistance line from late May, now support around 6.7980, despite the latest pullback. The bullish bias targeting the yearly high near 6.8385 also takes clues from MACD and RSI.
- AUD/JPY extends rebound from 50% Fibonacci retracement level on RBA Minutes.
- RBA policymakers hint at further rate hikes but signal uncertainty ahead, per the minutes.
- RSI recovery from oversold territory also favors buyers to aim for the previous support line.
- Two-week-old horizontal support zone could test bears past 93.10.
AUD/JPY picks up bids to consolidate intraday losses around 93.60 during Tuesday’s Asian session. In doing so, the cross-currency pair tries to cheer cautiously optimistic statements from the Reserve Bank of Australia’s (RBA) Minutes of the latest monetary policy meeting.
RBA Minutes mentioned that the board expects to take further steps in the process of normalizing monetary conditions over the months ahead, but it is not on a pre-set path, per Reuters.
Technically, AUD/JPY rebounds from the 50% Fibonacci retracement level of July 27 to August 02 downturn. The recovery moves also gain support from the RSI (14) as it recovers from the oversold territory.
However, the 200-HMA level surrounding 93.85 restricts the immediate upside of the AUD/JPY pair ahead of the previous support line from August 05, close to the 95.00 threshold at the latest.
On the contrary, a downside break of the 50% Fibonacci retracement level of 93.10 could quickly fetch the AUD/JPY prices toward the fortnight-long horizontal support area near 93.20-30.
AUD/JPY: Hourly chart
Trend: Limited upside expected
- Gold price is looking to extend the previous sell-off as the King dollar remains strong.
- Treasury yields bear the brunt of risk-aversion but fail to offer support to buyers.
- XAU/USD’s path of least resistance appears down ahead of Fed minutes.
Gold price remains vulnerable ahead of the Fed minutes, having failed to find acceptance above the $1,800 mark on several occasions. Risk-off flows dominate amid recessionary fears amplified by the Chinese activity data, keeping the sentiment around the safe-haven US dollar broadly underpinned. Despite mounting growth concerns, the Fed is widely expected to hike rates by 50 bps next month, which also continues to hurt the non-interest-bearing bullion. At the moment, However, the weakness in the US Treasury, in the wake of the flight to safety in the American government bonds, could offer temporary comfort to gold bulls. At the moment, the odds of a 50 bps September rate lift-off stand at 62%.
Also read: Gold Price Forecast: Buying intensity eases amid growth concerns
Gold Price: Key levels to watch
The Technical Confluence Detector shows that the gold price is gathering steam to test the previous day’s low of $1,773, below which the previous week’s low of $1,771 will be targeted.
The next downside cap is placed at $1,767, the pivot point one-day S1. The last line of defense for gold bulls is aligned at the Fibonacci 61.8% one-month at $1,764.
more to come ....
Here is how it looks on the tool
About Technical Confluences Detector
The TCD (Technical Confluences Detector) is a tool to locate and point out those price levels where there is a congestion of indicators, moving averages, Fibonacci levels, Pivot Points, etc. If you are a short-term trader, you will find entry points for counter-trend strategies and hunt a few points at a time. If you are a medium-to-long-term trader, this tool will allow you to know in advance the price levels where a medium-to-long-term trend may stop and rest, where to unwind positions, or where to increase your position size.
- AUD/USD portrays corrective pullback from intraday low after mixed RBA Minutes.
- RBA Minutes suggests the policymakers’ acceptance of higher rates but not ignoring the incoming data.
- Economics fears surrounding China, the US exert additional downside pressure.
- US housing, activity data can entertain traders, risk catalysts are the key.
AUD/USD pares intraday losses around 0.7020 after the Reserve Bank of Australia’s (RBA) Minutes of the latest monetary policy meeting. In doing so, the Aussie pair struggles to justify its risk-off mood amid firmer signals from the Minute statement.
RBA Minutes mentioned that the board expects to take further steps in the process of normalizing monetary conditions over the months ahead, but it is not on a pre-set path, per Reuters.
Also read: RBA Minutes: Ready to take further tightening steps but not on a pre-set path
Contrary to the RBA Meeting Minutes, sour sentiment also weighs on the AUD/USD prices due to the pair’s risk-barometer status.
Concerns surrounding the economic health of Australia’s largest trading partner China join the fears of the US recession to act as the key negative for the market’s mood.
The growth fears recently gained momentum after China released downbeat Retail Sales and Industrial Production data for July on Monday. On the same were data suggesting a lack of credit demand for China’s easy loan funds and the surprise rate cut from the People’s Bank of China (PBOC).
On the other hand, US NY Empire State Manufacturing Index for August dropped to 31.3 in August from 11.1 in July and 8.5 market forecasts. Further, the US August NAHB homebuilder confidence index also fell to 49 versus 55, its lowest level since the initial months of 2020.
It’s worth noting that the recently downbeat inflation data from the US contrasts the Fed policymakers’ hawkish bias, as well as the latest weakness in the statistics, to keep AUD/USD bears hopeful.
Against this backdrop, the US 10-year Treasury yields snaps a two-day downtrend around 2.79% while the S&P 500 Futures decline 0.25% intraday at the latest.
To sum up, AUD/USD remains on the bear’s radar, despite the latest rebound, as traders await Wednesday’s Federal Open Market Committee (FOMC) meeting minutes. For today, US Building Permits, Housing Starts and Industrial Production numbers for July should direct intraday moves.
Technical analysis
AUD/USD rebound remains elusive unless crossing the 200-DMA resistance near 0.7120.
Reserve Bank of Australia’s (RBA) August monetary policy meeting’s minutes showed that the “board expects to take further steps in the process of normalizing monetary conditions over the months ahead, but it is not on a pre-set path.”
Additional takeaways
Members noted that inflation was expected to peak later in 2022.
It is seeking to do this in a way that keeps the economy on an even keel.
Inflation will then decline back to the top of the 2 to 3 percent target range by the end of 2024.
Members agreed it was appropriate to continue the process of normalising monetary conditions.
Resilience of the economy continued to be most evident in the labor market.
Members also considered the risks to the global outlook, which were skewed to the downside.
Behaviour of household spending continued to present a key source of uncertainty for the outlook.
Members will be paying close attention to how the balance of various factors affects the outlook for spending.
Increase in interest rates over recent months has been required to bring inflation back to target.
Market reaction
The AUD/USD rebound fizzles out at 0.7025 on the RBA Minutes release. The Minutes offers no new surprise and could be read dovish.
The pair was last trading modestly flat on the day at 0.7017.
- USD/CHF bulls jostle with short-term key resistance line.
- Bullish MACD signals, firmer RSI favor buyers to extend the bounce off four-month low.
- Monthly resistance line, 200-SMA adds to the upside filters.
USD/CHF grinds higher around 0.9460 as buyers attack a seven-week-old previous support line during Tuesday’s Asian session.
In doing so, the Swiss currency (CHF) pair extends the previous week’s rebound from the lowest levels since mid-April. Also keeping the buyers hopeful is the RSI (14) line, as well as the bullish MACD signals.
That said, a clear upside break of the 0.9470 hurdle appears necessary for the USD/CHF bulls to approach a downward sloping resistance line from July, close to 0.9560 at the latest.
Following that, the 200-SMA hurdle near 0.9630 will be an important challenge for the pair’s further upside past 0.9560.
Alternatively, pullback moves may aim for the three-day-old support line, close to 0.9430, but remain unconvincing beyond the monthly low of 0.9370.
Even if the quote drops below 0.9370, January’s peak around 0.9345 may act as the last defense for USD/CHF bulls before giving control to the bears. In that case, March’s low of 0.9195 will be in focus.
Overall, USD/CHF pares recent losses but has miles to go before luring buyers.
USD/CHF: Four-hour chart
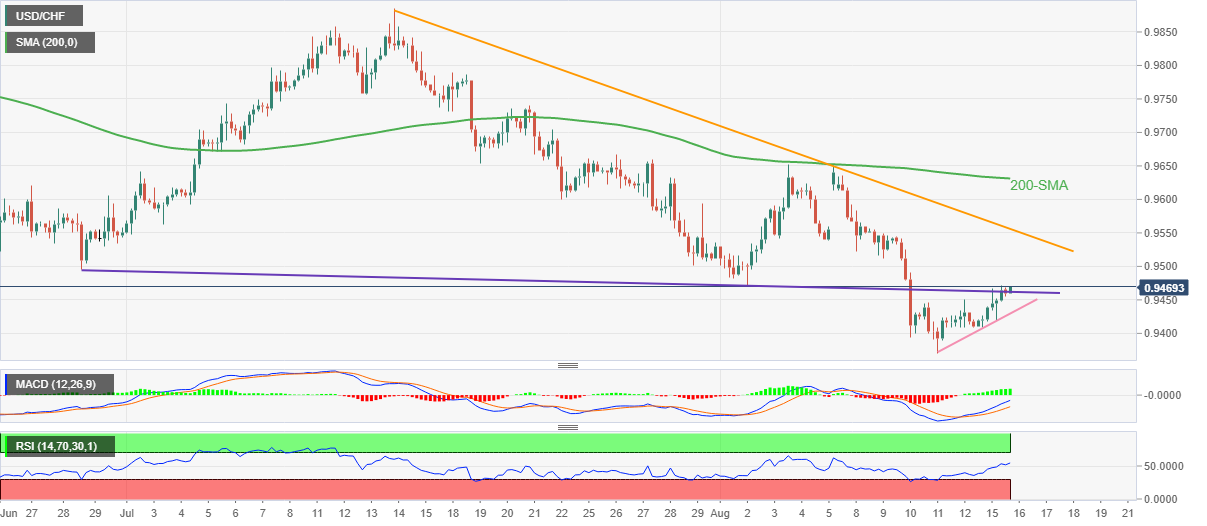
Trend: Further upside expected
The People’s Bank of China (PBOC) set the USD/CNY reference rate at 6.7730 on Tuesday when compared to the previous fix and the previous close at 6.7410 and 6.7750 respectively.
China’s central bank injected 2 billion yuan via 7-day reverse repos at 2.00% vs prior 2.00%.
- US Dollar Index steadies around weekly top, prints three-day uptrend.
- Growth concerns, Fedspeak challenge market sentiment amid a sluggish session.
- Second-tier US data, risk catalysts to entertain traders ahead of Wednesday’s FOMC Minutes.
US Dollar Index (DXY) rises for the third consecutive day while picking bids to 106.58 during Tuesday’s Asian session. In doing so, the greenback’s gauge portrays the market’s rush for risk safety amid economic fears surrounding the US and China, as well as geopolitical woes surrounding Russia, China and the Middle East. It’s worth noting that the softer US data and hawkish Fedspeak magnify the market’s indecision and favor the DXY bulls.
That said, the downbeat statistics from China and the US gain major attention from the DXY bulls, especially amid the recession fears.
US NY Empire State Manufacturing Index for August dropped to 31.3 in August from 11.1 in July and 8.5 market forecasts. Further, the US August NAHB homebuilder confidence index also fell to 49 versus 55, its lowest level since the initial months of 2020.
Elsewhere, China’s Retail Sales eased to 2.7% YoY in July versus 5.0% expected and 3.1% prior whereas Industrial Production (IP) edged lower to 3.8% during the stated month, from 3.9% prior and 4.6% market forecasts. Additionally, the People’s Bank of China (PBOC) surprised markets on Monday by cutting the one-year medium-term lending facility (MLF) rates by 10 basis points (bps) and trying to push back the bears.
It should be noted that headlines suggesting improved coronavirus conditions in China's financial hub Shanghai and the resumption of the Russian bonds’ trading on Wall Street failed to improve the risk appetite. Furthermore, hopes of a probable meeting between US President Joe Biden and his Chinese counterpart Xi Jinping, as signaled by the Wall Street Journal (WSJ), could favor the risk-on mood. On the same line were comments from China’s President Xi suggesting more efforts to revive the world’s second-largest economy.
Elsewhere, Reuters reported that the United States, South Korea and Japan participated in a missile warning and ballistic missile search and tracking exercise off Hawaii's coast last week, the Pentagon said on Monday. It was also revealed afterward that the US and South Korea will hold joint military drills from August 22 and September 01. The geopolitical fears are an extra burden on the market sentiment and propel the DXY.
Amid these plays, the US 10-year Treasury yields print a three-day downtrend around 2.775% while the S&P 500 Futures decline 0.13% intraday at the latest.
Moving on, today’s second-tier US housing and activity data might entertain the DXY traders ahead of Wednesday’s FOMC Minutes. Should the US data continue to arrive as softer, the greenback’s gauge could remain on the bear’s radar.
Technical analysis
A sustained upside break of the three-week-old resistance line, now support around 106.35, directs DXY bulls towards the monthly peak surrounding 107.00. However, the bulls need validation from late July’s peak near 107.45 to approach the yearly top marked in July around 109.30.
- EUR/USD is extending the previous sell-off, 1.0100 appears at risk.
- US dollar holds higher ground amid a cautious mood, despite weaker yields.
- Daily technical setup suggests more pain for the pair, eyes on German ZEW.
EUR/USD is looking to extend the two-day bearish momentum this Tuesday, as bears aim for the 1.0100 demand area amid a risk-averse market condition.
Despite the Wall Street advance on preference for growth stocks, the Asian markets appear in a cautious mood, as the recent Chinese data inflicted pain and alarmed recessionary fears worldwide.
The reduced appetite for riskier assets keeps the buoyant tone intact around the safe-haven US dollar, despite the ongoing weakness in the Treasury yields. The US dollar index holds steady at around 106.55, at the time of writing, while the benchmark 10-year rates are down about 0.50% to trade at 2.775%.
The market’s attention has now shifted to lingering recession fears, as they also remain worried about the size of the upcoming Fed rate hikes following the softer US inflation data. The minutes of the Fed July meeting will be closely followed to get hints on the central bank’s next policy move.
Ahead of that, the ZEW survey from the Eurozone and Germany will be eyed, as it may confirm a recession in the old continent amid the deepening energy and supply-side crisis. The drying up of the Rhine River has exacerbated the pain in the euro.
The German headline Economic Sentiment is seen improving slightly to -52.7 in August vs. -53.8 previous while that of the Eurozone is expected at -42.5 vs. -51.1 prior. Meanwhile, investors will also look forward to the US housing data for fresh dollar valuations.
EUR/USD: Technical outlook
Technically, EUR/USD closed Monday below the critical short-term 21-Daily Moving Average (DMA) at 1.0210, opening floors for further downside. The 14-day Relative Strength Index (RSI) hovers below the midline, justifying the bearish potential. Sellers are likely to test the August 3 low of 1.0122 en route to the 1.0100 mark.
EUR/USD: Additional technical levels to watch
- NZD/USD extends pullback from a four-month-old resistance line.
- RSI’s retreat, softer MACD signals also keep sellers hopeful.
- Monthly support line, 50-DMA can challenge bears below 100-DMA.
NZD/USD takes offers to refresh intraday low around 0.6350 as it extends the previous day’s pullback towards the 100-DMA during Tuesday’s Asian session.
In addition to the Kiwi pair’s U-turn from the downward sloping resistance line from late April, around 0.6455 by the press time, recently easing RSI (14) and receding bullish bias of the MACD also favor the latest south-run.
It’s worth noting, however, that the NZD/USD weakness past the 100-DMA support of 0.6320 appears difficult as an upward sloping support line from mid-July, near 0.6260, will precede the 50-DMA level of 0.6244 to challenge the bears.
If at all, the NZD/USD prices remain weak past 0.6244, May’s low around 0.6175 and multiple levels marked near the 0.6100 threshold please the sellers.
On the contrary, recovery remains elusive beneath the aforementioned resistance line, close to 0.6455 at the latest.
Even so, the monthly high near 0.6470 and a horizontal area including highs marked since May, surrounding 0.6570-75, will be crucial to watch for the NZD/USD bulls.
NZD/USD: Daily chart
-16082022-637962075856426060.png)
Trend: Further weakness expected
| Index | Change, points | Closed | Change, % |
|---|---|---|---|
| NIKKEI 225 | 324.8 | 28871.78 | 1.14 |
| Hang Seng | -134.76 | 20040.86 | -0.67 |
| ASX 200 | 31.8 | 7064.3 | 0.45 |
| FTSE 100 | 8.25 | 7509.15 | 0.11 |
| DAX | 20.76 | 13816.61 | 0.15 |
| CAC 40 | 16.09 | 6569.95 | 0.25 |
| Dow Jones | 151.39 | 33912.44 | 0.45 |
| S&P 500 | 16.99 | 4297.14 | 0.4 |
| NASDAQ Composite | 80.86 | 13128.05 | 0.62 |
- USD/JPY takes offers to refresh intraday low, down for the second consecutive day.
- Yields remain pressured for third consecutive day amid recession fears, indecision over Fed’s next move.
- Geopolitical woes can fuel prices as the US, South Korea and Japan held joint military exercises near Hawaii's coast.
- Second-tier US data, risk catalysts are important for fresh impulse.
USD/JPY refreshes intraday low near 133.00 during Tuesday’s initial Tokyo session. In doing so, the yen pair tracks downbeat US Treasury yields, as well as recession fears, during a sluggish session.
Despite the latest rebound, the USD/JPY prices remain weak for the second consecutive day as fears surrounding the economic conditions in China and the US challenge the pair buyers. Also exerting downside pressure on the yen pair is the cautious mood ahead of this week’s Federal Open Market Committee (FOMC) meeting minutes.
China’s Retail Sales eased to 2.7% YoY in July versus 5.0% expected and 3.1% prior whereas Industrial Production (IP) edged lower to 3.8% during the stated month, from 3.9% prior and 4.6% market forecasts. Additionally, the People’s Bank of China (PBOC) surprised markets on Monday by cutting the one-year medium-term lending facility (MLF) rates by 10 basis points (bps) and trying to push back the bears.
On the other hand, the US NY Empire State Manufacturing Index for August dropped to 31.3 in August from 11.1 in July and 8.5 market forecasts. Further, the US August NAHB homebuilder confidence index also fell to 49 versus 55, its lowest level since the initial months of 2020.
Given the downbeat data from the world’s top-two economies, fears of recession regain attention after the brief absence during the last week, mainly due to the softer US inflation data.
On a different page, headlines suggesting improved coronavirus conditions in China's financial hub Shanghai and the resumption of the Russian bonds’ trading on Wall Street failed to improve the risk appetite. Furthermore, hopes of a probable meeting between US President Joe Biden and his Chinese counterpart Xi Jinping, as signaled by the Wall Street Journal (WSJ), could favor the risk-on mood. On the same line were comments from China’s President Xi suggesting more efforts to revive the world’s second-largest economy.
Elsewhere, Reuters reported that the United States, South Korea and Japan participated in a missile warning and ballistic missile search and tracking exercise off Hawaii's coast last week, the Pentagon said on Monday. It was also revealed afterward that the US and South Korea will hold joint military drills from August 22 and September 01. The geopolitical fears are an extra burden on the market sentiment and weigh on the USD/JPY prices.
Against this backdrop, the US 10-year Treasury yields print a three-day downtrend around 2.775% while the S&P 500 Futures decline 0.13% intraday at the latest.
Moving on, risk catalysts and the second-tier activity and housing data from the US can entertain intraday traders.
Technical analysis
The 10-DMA guards immediate USD/JPY upside around 133.80 inside a three-week-old symmetrical triangle between 132.35 and 134.20.
| Pare | Closed | Change, % |
|---|---|---|
| AUDUSD | 0.70213 | -1.37 |
| EURJPY | 135.441 | -1.13 |
| EURUSD | 1.01617 | -0.95 |
| GBPJPY | 160.635 | -0.85 |
| GBPUSD | 1.20539 | -0.66 |
| NZDUSD | 0.63614 | -1.34 |
| USDCAD | 1.28988 | 1 |
| USDCHF | 0.94574 | 0.48 |
| USDJPY | 133.278 | -0.19 |


© 2000-2026. Bản quyền Teletrade.
Trang web này được quản lý bởi Teletrade D.J. LLC 2351 LLC 2022 (Euro House, Richmond Hill Road, Kingstown, VC0100, St. Vincent and the Grenadines).
Thông tin trên trang web không phải là cơ sở để đưa ra quyết định đầu tư và chỉ được cung cấp cho mục đích làm quen.
Giao dịch trên thị trường tài chính (đặc biệt là giao dịch sử dụng các công cụ biên) mở ra những cơ hội lớn và tạo điều kiện cho các nhà đầu tư sẵn sàng mạo hiểm để thu lợi nhuận, tuy nhiên nó mang trong mình nguy cơ rủi ro khá cao. Chính vì vậy trước khi tiến hành giao dịch cần phải xem xét mọi mặt vấn đề chấp nhận tiến hành giao dịch cụ thể xét theo quan điểm của nguồn lực tài chính sẵn có và mức độ am hiểu thị trường tài chính.
Sử dụng thông tin: sử dụng toàn bộ hay riêng biệt các dữ liệu trên trang web của công ty TeleTrade như một nguồn cung cấp thông tin nhất định. Việc sử dụng tư liệu từ trang web cần kèm theo liên kết đến trang teletrade.vn. Việc tự động thu thập số liệu cũng như thông tin từ trang web TeleTrade đều không được phép.
Xin vui lòng liên hệ với pr@teletrade.global nếu có câu hỏi.
ngân hàng