- Phân tích
- Tin tức và các công cụ
- Tin tức thị trường
Tin tức thì trường
USD/MXN fades the corrective bounce off the one-week low marked the previous day as it retreats to 16.87 amid the early hours of Friday’s Asian session. In doing so, the Mexican Peso (MXN) pair braces for the weekly loss while reversing the previous week’s corrective bounce off the lowest levels since December 2015.
It’s worth noting that the pair’s recovery on Thursday and the options market bias take clues from a strong rally in the US Dollar prices backed by the recent US data. However, the comparatively upbeat Mexican fundamentals favor the MXN.
That said, the one-month Risk Reversal (RR) of the USD/MXN pair, a measure of the spread between call and put prices, reverse the previous day’s downbeat print by posting the 0.027 figure by the end of Thursday’s North American trading session.
With this, the options market figures flag the hopes of witnessing a corrective bounce in the USD/MXN price as the weekly RR braces for the second consecutive positive print with the latest number being 0.080.
However, the US Core Personal Consumption Expenditure (PCE) Price Index for June, expected 4.2% YoY versus 4.6% prior, also known as the Fed’s preferred inflation gauge, is scheduled for publishing on Friday and can offer a volatile day and move the USD/MXN pair.
Also read: USD/MXN Price Analysis: Bears have the upper hand near 200-hour SMA/61.8% Fibo. confluence
Early Friday morning in Asia, the Statistics Bureau of Japan released monthly prints of the Tokyo Consumer Price Index for July.
That said, the headline Tokyo CPI improves to 3.2% YoY from 3.1% prior, versus 2.8% market forecasts, whereas the Tokyo CPI ex Fresh Food, Energy rises to 4.0% from 3.8% previous readings. More importantly, Tokyo CPI ex Fresh Food eases from 3.2% to 3.0% for the said month compared to analysts’ estimations of 2.9%.
USD/JPY drops back to 139.00
Following the upbeat Japan inflation clues, USD/JPY recollects the previous day’s chatters about the Bank of Japan’s likely edit to the +/- 0.50% limit of the 10-year Japanese Government Bond (JGB) yields ahead of Japan inflation data and the BoJ monetary policy announcements. With this, the Yen pair retreats to 139.00 by marking an initial fall of 25 pips on the data.
Also read: USD/JPY Price Analysis: Bears occupy driver’s seat near 139.00 amid talks of BoJ’s YCC tweak
- EUR/USD stays defensive at three-week low after posting the biggest daily loss since March 15.
- ECB announces 0.25% rate hike, as expected, but absence of clear forward guidance and chance in statement prod Euro bears.
- Strong US Q2 GDP Annualized growth bolsters US Dollar strength ahead of Fed’s favorite inflation gauge.
- Preliminary German Q2 GDP and inflation data for July eyed ahead of US Core PCE Price Index for June.
EUR/USD seesaws around 1.0980-70 during the early hours of Friday’s Asian session while licking its wounds after declining the most in 4.5 months the previous day. In doing so, the Euro pair portrays the market’s cautious mood ahead of the top-tier data from Germany and the US at the lowest level in three weeks.
On Thursday, the European Central Bank (ECB) matches market forecasts by announcing 25 basis points (bps) increase in the benchmark rates. That said, the policy statement showed the board is “open-minded” about further tightening.
However, the ECB statement dumped reference to the need to bring the rates to a level that cuts inflation quickly enough and gained the attention of the Euro bears, especially when backed by ECB President Christine Lagarde’s comments stating, “The wording change in the statement was not random or irrelevant.”
On the same line, ECB’s Lagarde also signaled the nearness to the end of the inflation battle by suggesting smaller grounds to cover while also showing data-dependency of the next rate decision as well.
Elsewhere, the preliminary readings of the US Gross Domestic Product (GDP) Annualized for the second quarter (Q2) improved to 2.4% from 2.0% prior, versus 1.8% market forecast. On the same line, the US Durable Goods Orders also jumps 4.7% for June compared to 1.0% expected and 1.8% expected (revised). Additionally, Initial Jobless Claims declines to 221K for the week ended on July 21 versus 235K prior and analysts’ estimations of 228K. It should be observed that the US Pending Home Sales for June also improved to 0.3% MoM versus -0.5% expected and -2.5% prior (revised).
However, the first estimations of the US Q2 Core Personal Consumption Expenditure eases to 3.8% QoQ from 4.9% prior and 4.0% market forecasts whereas GDP Price Index edges lower to 2.6% from 4.1% previous readings and 3.0% expected.
Against this backdrop, US Dollar Index (DXY) posted the biggest daily jump since March 15 the previous day, not to forget mentioning a stellar rebound from the weekly low, as the US statistics recall the Fed hawks and bolstered the Treasury bond yields. It’s worth noting that the Wall Street benchmarks closed with nearly half a percent of daily losses whereas the benchmark US 10-year Treasury bond yields marked the biggest daily jump in a month to refresh a three-week high near 4.02%, close to 4.0% by the press time.
Looking ahead, the preliminary readings of Germany’s Q2 GDP and Consumer Price Index , as well as Harmonized Index of Consumer Prices (HICP), for July will be crucial to watch for immediate directions amid looming concerns of the bloc’s recession. Following that, the Fed’s favorite inflation gauge, namely the Core Personal Consumption Expenditure (PCE) Price Index for June, expected 4.2% YoY versus 4.6% prior, could direct the EUR/USD moves as traders seek clues to confirm the September rate hike.
Technical analysis
Despite Thursday’s heavy slump, the 50-day Exponential Moving Average (EMA) and a two-month-old rising support line, respectively near 1.0970 and 1.0955, restrict the EUR/USD pair’s further downside. The recovery moves, however, remain elusive unless providing a clear upside break of a five-week-old horizontal resistance surrounding 1.1010-20.
- NZD/USD loses momentum and currently trades around 0.6188, gaining 0.1% for the day.
- The US GDP expanded 2.4% in the second quarter, beating expectations of 1.8% and 2.0% prior.
- Market players will monitor the US Core Personal Consumption Expenditure (PCE) index.
The NZD/USD pair loses its traction and holds below the 0.6200 area in the early Asian session after retreating from a weekly high of 0.6275. The US dollar Index (DXY), a measure of the value of the Greenback against six other major currencies, jumps to its highest level since July 11, near 101.70, as upbeat US economic figures boosts the Greenback on Friday.
As widely expected, the Federal Reserve (Fed) raised interest rates by 25 basis points (bps) to 5.25%–5.5% on Wednesday. The rate was last seen just before the housing market collapse in 2007 and marked the highest level in more than 22 years.
On Thursday, the US Bureau of Economic Analysis (BEA) first estimate reported that the US real Gross Domestic Product(GDP) expanded at a 2.4% annualized rate, beating the market expectation of 1.8% and following the 2% growth reported in the first quarter. Meanwhile, Durable Goods Orders rose 4.7% on a monthly basis to $302.5 billion. Initial Jobless Claims declined by 7,000 to 221,000 in the week ending July 22. It is the lowest reading in five months.
Due to the lack of significant data released from the New Zealand docket this week, it is difficult for the Kiwi to construct a bullish narrative, and the offshore events will be in the spotlight. However, the market expects a more hawkish stance from the Reserve Bank of New Zealand (RBNZ), which might raise the risk of a hard landing. This, in turn, could weigh on the Kiwi and act as a headwind for NZD/USD.
Looking ahead, the USD's valuation will likely continue to influence the pair's movement later in the day. Market participants will keep an eye on the US Core Personal Consumption Expenditure (PCE) index, the Fed's preferred inflation gauge. The figure is expected to drop from 4.6% to 4.2% annually.
- Gold Price licks its wounds after falling the most in eight weeks amid firmer US Dollar.
- US Dollar bulls cheer upbeat prints of United States Q2 GDP Annualized, dovish ECB hike.
- Firmer US Core PCE Price Index can weigh on XAU/USD as Fed showed readiness for September rate hike if needed.
Gold Price (XAU/USD) steadies around the mid-$1,900s amid the early hours of Friday’s Asian session, after posting the biggest daily slump in two months the previous day. In doing so, the XAU/USD portrays the market’s consolidation ahead of the top-tier US data following a whippy day that initially propelled the Gold Price towards the weekly top on the softer US Dollar and risk-on mood before drowning it on the strong United States data and firmer Treasury bond yields.
Gold Price drops as US Dollar rises on firmer United States data, ECB moves
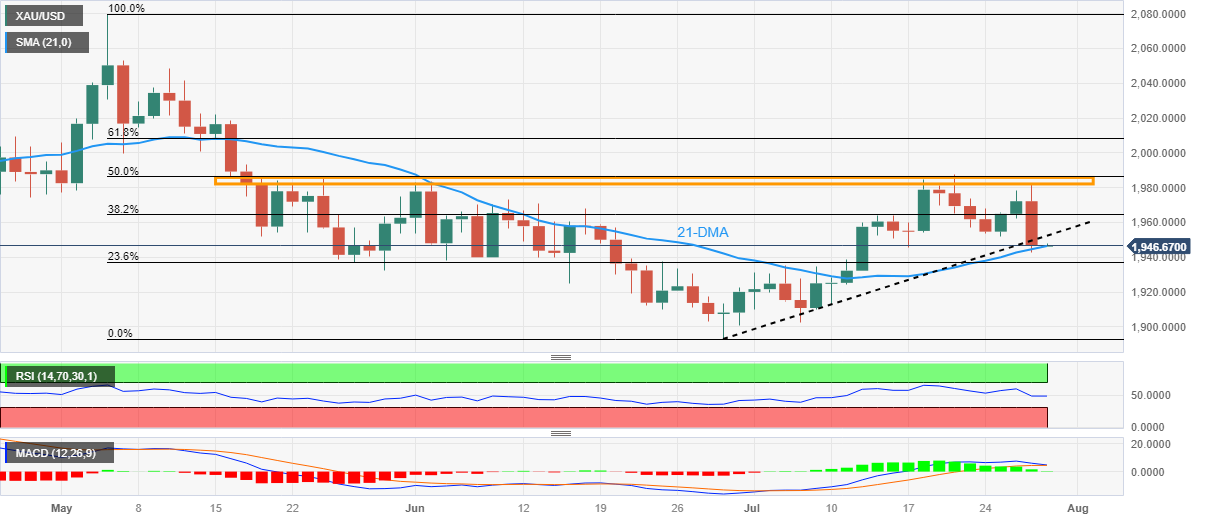
Gold Price aptly justified the word “turnaround Thursday” as it initially rose to the highest levels in a week while poking a 2.5-month-old horizontal resistance before breaking a multi-day-old support line. It’s worth noting that the XAU/USD remains defensive around the 21-DMA level near $1,945 by the press time.
That said, the market’s easing fears of the Federal Reserve’s (Fed) rate hike and upbeat China Industrial Profits, as well as hopes of more stimulus from Beijing, fuelled the Gold Price to refresh the weekly top. However, strong prints of the United States data and upbeat yields drowned the XAU/USD afterward. On the same line could be the dovish hike of the European Central Bank (ECB) and the cautious mood ahead of the Fed’s preferred inflation data.
On Thursday, the preliminary readings of the US Gross Domestic Product (GDP) Annualized for the second quarter (Q2) improved to 2.4% from 2.0% prior, versus 1.8% market forecast. On the same line, the US Durable Goods Orders also jumps 4.7% for June compared to 1.0% expected and 1.8% expected (revised). Additionally, Initial Jobless Claims declines to 221K for the week ended on July 21 versus 235K prior and analysts’ estimations of 228K. It should be observed that the US Pending Home Sales for June also improved to 0.3% MoM versus -0.5% expected and -2.5% prior (revised).
However, the first estimations of the US Q2 Core Personal Consumption Expenditure eases to 3.8% QoQ from 4.9% prior and 4.0% market forecasts whereas GDP Price Index edges lower to 2.6% from 4.1% previous readings and 3.0% expected.
That said, the European Central Bank (ECB) matches market forecasts by announcing 25 basis points (bps) increase in the benchmark rates. That said, the policy statement showed the board is “open-minded” about further tightening. However, the statement dumped reference to the need to bring the rates to a level that cuts inflation quickly enough and gained the attention of the Euro bears, especially when backed by ECB President Christine Lagarde’s comments stating, “The wording change in the statement was not random or irrelevant.” On the same line, ECB’s Lagarde also signaled the nearness to the end of the inflation battle by suggesting smaller grounds to cover while also showing data-dependency of the next rate decision as well. It’s worth noting that the Euro’s slump strengthens the US Dollar and weighs on the Gold Price.
Amid these plays, US Dollar Index (DXY) posted the biggest daily jump since March 15 the previous day, not to forget mentioning a stellar rebound from the weekly low, as the US statistics recall the Fed hawks and bolstered the Treasury bond yields. It’s worth noting that the Wall Street benchmarks closed with nearly half a percent of daily losses whereas the benchmark US 10-year Treasury bond yields marked the biggest daily jump in a month to refresh a three-week high near 4.02%, close to 4.0% by the press time.
Looking ahead, the risk catalysts may entertain the Gold traders ahead of the Fed’s favorite inflation gauge, namely the Core Personal Consumption Expenditure (PCE) Price Index for June, expected 4.2% YoY versus 4.6% prior, will be crucial to watch for clear directions.
Also read: PCE Inflation Preview: Price pressures set to fade in Fed favorite figures, US Dollar to follow suit
Gold Price Technical Analysis
Gold Price justifies multiple failures to cross the 10-week-old horizontal resistance, as well as the downside break of an upward-sloping support line from late June, while welcoming the bears after their three-week vacation.
Also favoring the XAU/USD sellers is the looming bear cross on the Moving Average Convergence and Divergence (MACD) indicator, as well as the Relative Strength Index (RSI) line’s pullback.
It’s worth noting, however, that a sustained downside break of the 21-DMA support surrounding $1,945 becomes necessary for the Gold bears to keep the reins. Even so, a slew of peaks and troughs marked since mid-June around $1,930-25 can test the XAU/USD sellers before directing them to the yearly low registered the last month around $1,893.
On the flip side, a daily closing beyond the support-turned-resistance line of around $1,955 may allow the Gold Price to pare weekly loss, if backed by the aforementioned United States inflation clues.
However, the 38.2% Fibonacci retracement level of the metal’s May-June downside and the previously stated 2.5-month-old horizontal resistance, respectively near $1,965 and $1,985, will challenge the Gold buyers before giving them control.
Overall, the Gold Price is likely to witness further downside but the road towards the south is long and bumpy.
Gold Price: Daily chart
Trend: Further downside expected
- USD/JPY remains pressured at the lowest level in a week, prints five-day downtrend ahead of Japan inflation, BoJ.
- Chatters that BoJ will drop its 0.5% limit on the 10-year JGB bolstered Yen during late Thursday.
- Bears approach yearly horizontal support within rising trend channel established since December 2022, recovery remains elusive below May’s peak.
- Bearish MACD signals, downside break of 50% Fibonacci retracement keep Yen pair sellers hopeful.
USD/JPY bears flirt with the 139.00 round figure during a five-day losing streak ahead of Friday’s Tokyo open. In doing so, the Yen pair justifies the latest chatters surrounding the Bank of Japan’s (BoJ) likely edit to the +/- 0.50% limit of the 10-year Japanese Government Bond (JGB) yields ahead of Japan inflation data and the BoJ monetary policy announcements.
Also read: Breaking: USD/JPY bears firm on a strong hint that BoJ will drop 0.5% cap in 10Y JGB yields
Technically, the bearish MACD signals join the Yen pair’s downside break of the 50% Fibonacci retracement level of October 2022 to January 2023 fall, near 139.60 by the press time, to favor the USD/JPY sellers.
With this, the Yen pair appears well set to prod the horizontal area comprising multiple levels marked since December 2022, close to 138.00-137.80.
Following that, a convergence of the 200-DMA and 38.2% Fibonacci retracement, close to 136.70, will precede the bottom line of a seven-month-old rising channel surrounding 135.60, to limit the USD/JPY downside.
On the contrary, a 50% Fibonacci retracement level of 139.60 and the 140.00 round figure may initially restrict the USD/JPY recovery ahead of directing the bulls to May’s high of near 140.95, quickly followed by the 141.00 round figure.
It’s worth noting, however, that the Yen pair buyers will remain confused unless witnessing a clear upside break of the 61.8% Fibonacci retracement level of 142.52, backed by the dovish BoJ stand.
USD/JPY: Daily chart
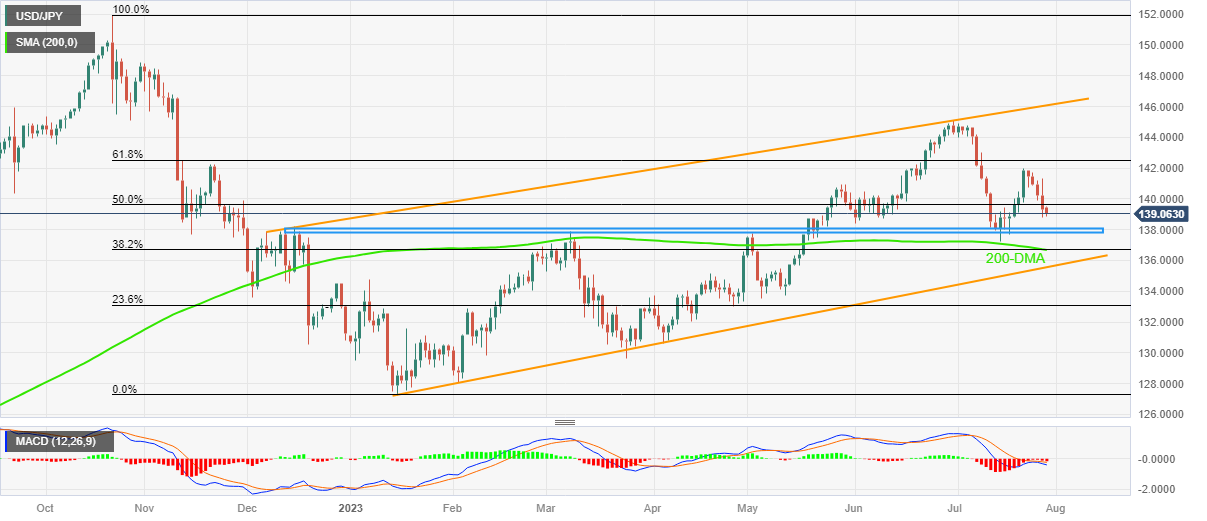
Trend: Limited downside expected
- AUD/USD licks its wounds at 13-day low after a volatile day that ended on a negative side with heavy losses.
- Aussie pair initially cheered Fed-inspired US Dollar weakness and China backed risk-on mood before slumping on US GDP-led greenback rally.
- Australia’s Q2 PPI, Retail Sales for June may entertain Aussie pair traders ahead of US Core PCE Price Index for June.
- Recently firmer US data renew hawkish Fed bets and can offer more US Dollar strength on upbeat inflation clues.
AUD/USD bears attack two-month-old support amid early hours of Friday’s Asian session after a volatile day for the pair that initially refreshed the weekly high before closing with the biggest daily loss in a week to around 0.6700. That said, the quote currently portrays pre-data anxiety following a whippy day that ran from firmer sentiment and softer US dollars to a jump in the greenback and mixed mood.
AUD/USD initially cheered the market’s easing fears of the Federal Reserve’s (Fed) rate hike and upbeat China Industrial Profits, as well as hopes of more stimulus from Beijing, to refresh the weekly top before the US GDP-led slump. Also weighing on the Aussie pair could be the cautious mood ahead of today’s top-tier Aussie and the US data.
US Dollar Index (DXY) posted the biggest daily jump since March 15 the previous day, not to forget mentioning a stellar rebound from the weekly low, as the US statistics recall the Fed hawks and bolstered the Treasury bond yields. It’s worth noting that the Wall Street benchmarks closed with nearly half a percent of daily losses whereas the benchmark US 10-year Treasury bond yields marked the biggest daily jump in a month to refresh a three-week high near 4.02%, close to 4.0% by the press time.
That said, the preliminary readings of the US Gross Domestic Product (GDP) Annualized for the second quarter (Q2) improved to 2.4% from 2.0% prior, versus 1.8% market forecast. On the same line, the US Durable Goods Orders also jumps 4.7% for June compared to 1.0% expected and 1.8% expected (revised). Additionally, Initial Jobless Claims declines to 221K for the week ended on July 21 versus 235K prior and analysts’ estimations of 228K. It should be observed that the US Pending Home Sales for June also improved to 0.3% MoM versus -0.5% expected and -2.5% prior (revised).
However, the first estimations of the US Q2 Core Personal Consumption Expenditure eases to 3.8% QoQ from 4.9% prior and 4.0% market forecasts whereas GDP Price Index edges lower to 2.6% from 4.1% previous readings and 3.0% expected.
At home, Australia’s Export Price Index slumped to -8.5% QoQ while the Import Price Index improved to -0.8% QoQ versus 1.6% and -4.2% respective priors. That said, China's Industrial Profits for the January-June period improve to -16.8% compared to the -18.8% figure marked for the first five months of the year 2023, per China’s National Bureau of Statistics (NBS) data.
Looking ahead, AUD/USD pair traders may witness a lackluster day as top-tier data/events are scheduled for publishing in Asia, as well as in the US session. That said, Australia’s Q2 Producer Price Index, expected to ease to 3.9% YoY from 5.2% prior, will precede the Aussie Retail Sales for June, bearing downbeat forecasts of 0.0% MoM versus 0.7% prior, to entertain traders in Asia. Following that, the Fed’s favorite inflation gauge, namely the Core Personal Consumption Expenditure (PCE) Price Index for June, expected 4.2% YoY versus 4.6% prior, will be crucial to watch for clear directions.
Technical analysis
AUD/USD clings to a two-month-old rising support line surrounding 0.6700 after providing the first daily closing beneath the 200-SMA, around 0.6730 by the press time, in more than two weeks.
- GBP/USD bulls are under pressure following a rally in the Greenback.
- The bears are testing commitments at critical technical structures on the daily chart.
GBP/USD followed EUR/USD lower on strong US data and the European Central Babk's dovish 25bp hike. The pair dropped from 1.2995 to a low of 1.2781 while the markets reduce more hawkish Bank of England rate expectations for the August 3 interest rate meeting. This leaves the technical structure complicated and two-fold for Cable as the following illustrates:
GBP/USD technical analysis
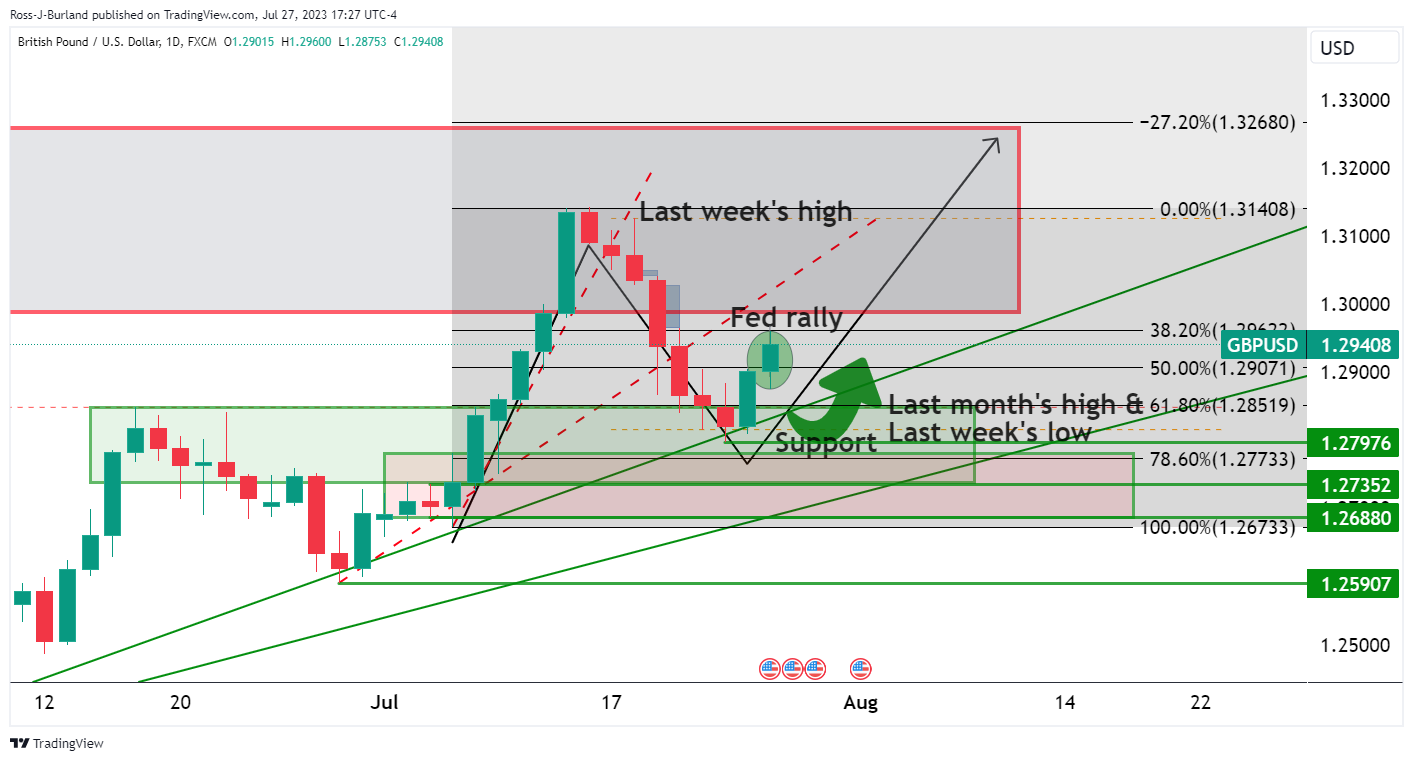
Prior to the Thursday sell-off, Cable was rallying in line with the bullish trend on the back of the Fed's move and subsequent market take on the meeting. However, along came Thursday:
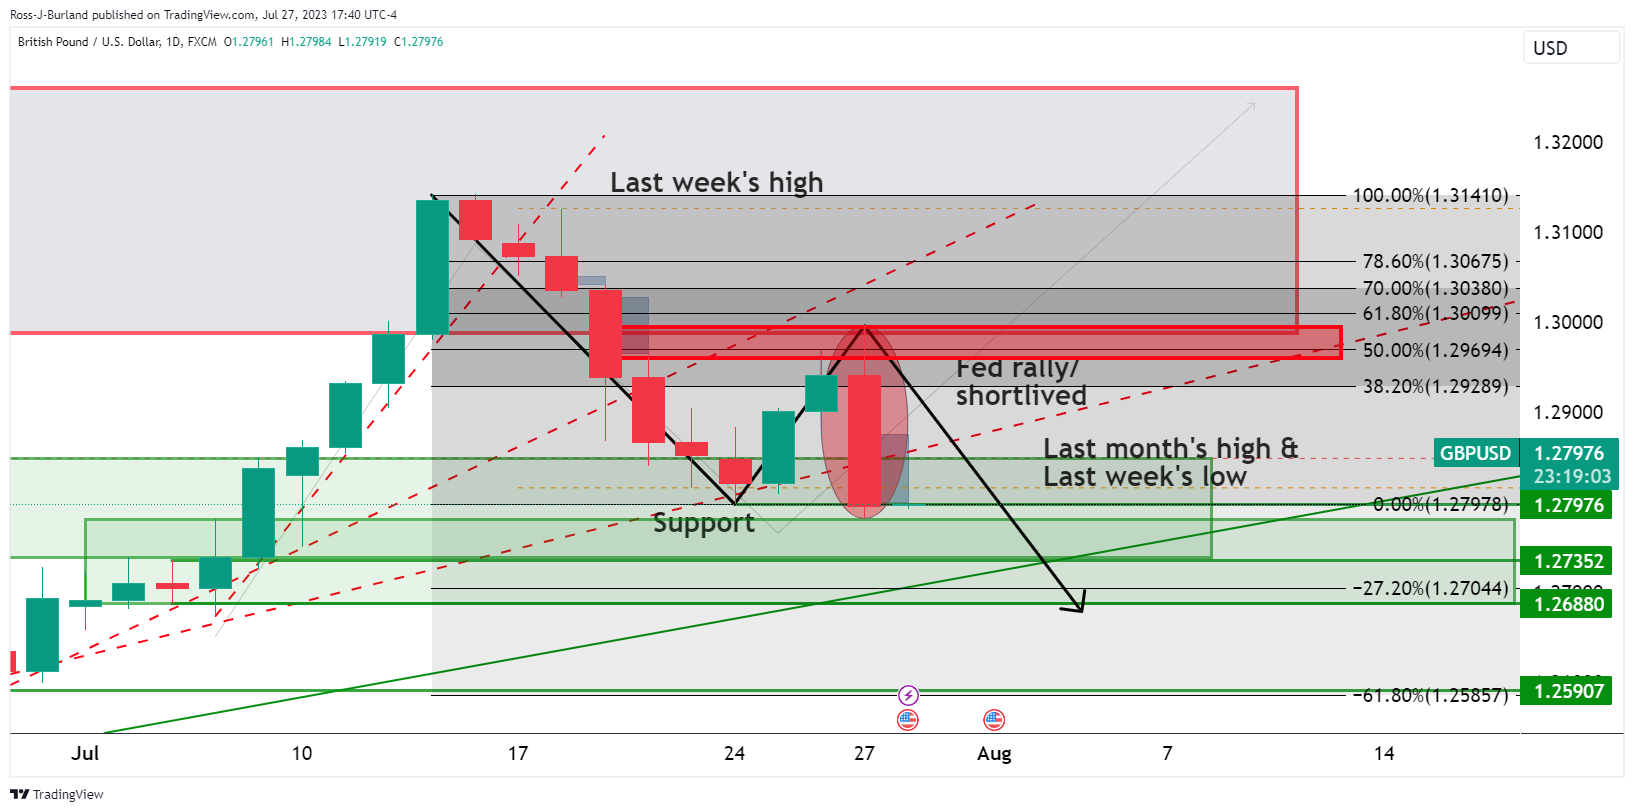
This has seen the pair drop hard into support and leaves a bearish prospect on the charts for a deeper test of the broader bullish cycle for the days ahead.
According to media reports, the Bank of Japan will discuss making a tweak to its yield curve control (YCC) on Friday; the BoJ meeting will be the highlight of the Asian session. The Tokyo Consumer Price Index is due, and in Australia, the Producer Price Index. Later in the day, attention will turn to preliminary inflation figures from France, Spain, and Germany. The US will also release inflation data, including the Core Personal Consumption Expenditure (PCE) index.
Here is what you need to know on Friday, July 28:
Upbeat economic data from the US boosted the US dollar on Thursday. The economy expanded at a 2.4% annualized rate, above the expected 1.8% and also higher than the 2% of market consensus. Additionally, Initial Jobless Claims, Durable Goods Orders, and Pending Home Sales posted better-than-expected readings. Wall Street initially cheered the data, but main indices failed to hold onto gains and finished with losses of 0.60% on average.
The US Dollar Index jumped to 101.85, reaching the highest level since July 11 but then pulled back on the back of the USD/JPY decline. US Treasury yields also rose, with the 10-year rising above 4.0% and the 2-year hitting 4.95%
On Friday, the US Core Personal Consumption Expenditure index for June is due. The annual rate is expected to decline from 4.6% to 4.2%. It is the Fed's preferred inflation gauge. Also due are income and spending data, the Employment Cost Index, and the final University of Michigan Consumer Sentiment index. Next week, the official US employment report is due.
The Japanese Yen rose sharply during the American session and became the biggest gainer of the day. Nikkei reported that the Bank of Japan (BoJ) will discuss a tweak in its Yield Curve Control policy to allow rates over 0.5%. USD/JPY tumbled from above 141.00 to 138.80 in a few hours. The BoJ will have its monetary policy meeting on Friday, which gained attention following recent speculations. The Tokyo Consumer Price Index (CPI) is also due.
The Euro weakened after the European Central Bank (ECB) decision to raise rates by 25 basis points, as expected. The fact that Lagarde offered no forward guidance and kept all options on the table for the next meeting in September weighed on the common currency. The key driver in EUR/USD, however, was the stronger US dollar. Spain, France, and Germany will release the preliminary July Consumer Price Index. EUR/USD tumbled to 1.0960, having its worst day in months.
Jörg Krämer, Chief Economist at Commerzbank:
The ECB switched off the autopilot at today's Council meeting. From now on the data will determine whether the ECB raises its interest rates again or not. Because we expect a significant decline in inflation and a recession in the second half of the year, we continue to not forecast a rate hike in September. On the other hand, we doubt the market's view that the ECB will cut rates as early as 2024.
GBP/USD resumed the downside, falling below 1.2800 to the lowest level in three weeks. EUR/GBP bottomed at 0.8545 but then erased losses, rising to 0.8575.
USD/CAD rose, boosted by the Greenback, and hit weekly highs at 1.3245 but still remains capped by the 1.3250 resistance zone. On Friday, Canada's monthly GDP for May is due, with a 0.3% expansion expected.
NZD/USD retreated a hundred pips from the top and closed below 0.6200. AUD/USD posted its lowest close since July 11, near 0.6700 and below the 20-day Simple Moving Average (SMA). Both currency pairs are under pressure amid stronger Dollar and technicals. Australia will release the Producer Price Index on Friday.
Metals collapsed following the US data. Silver lost more than 3%, falling to $24.00, and Gold plummeted from $1,980 to $1,942. Cryptocurrencies also suffered from a stronger dollar, with Bitcoin falling 1.60% to $29,100 and Ethereum 1.24% to $1,858.
Like this article? Help us with some feedback by answering this survey:
- EUR/USD bulls eye a move to test key resistance from key support.
- EUR/USD bears are in the market to test critical structure.
EUR/USD was offered as the US Dollar index, DXY, recovered from early losses and ended the New York session higher by some 0.7% at 101.77 after claiming between a low of 100.551 and 101.840 which was a 2-week high.
Meanwhile, stronger-than-expected US economic data supported a hawkish Federal Reserve thesis for the remainder of the year and further out. The second quarter Gross Domestic Product, Weekly Jobless Claims, and June's Pending Home Sales sent the US Treasury note yields higher, supporting the Greenback. EUR/USD also dropped to a 2-week low on dovish comments from ECB President Lagarde.
EUR/USD technical analysis
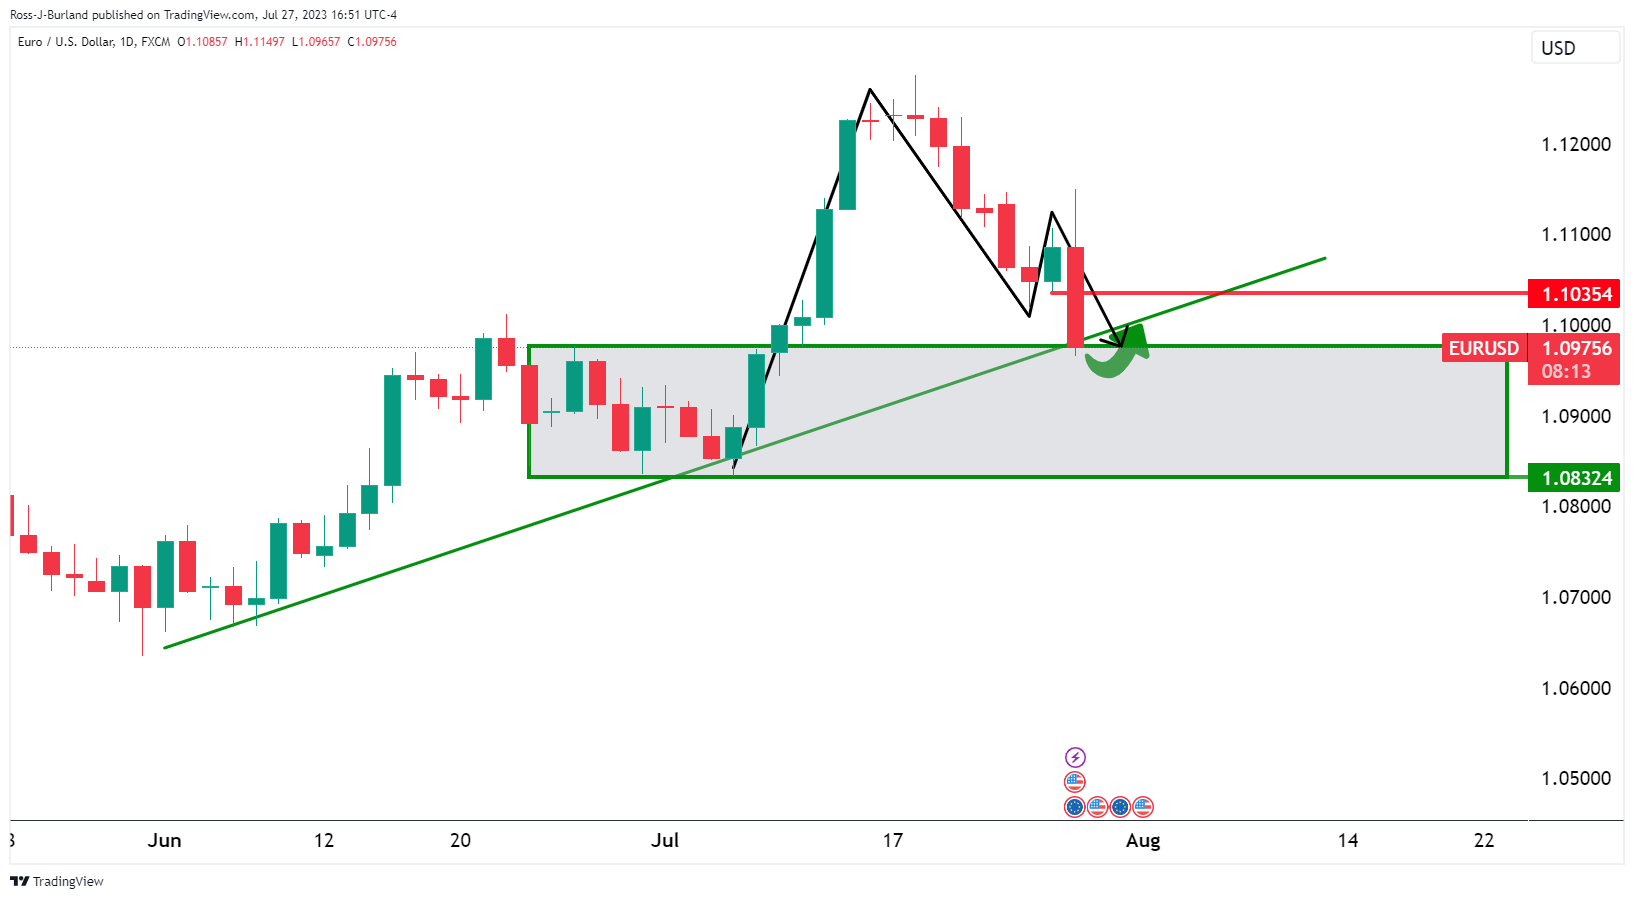
EUR/USD is at a critical structure point as per the trendline support that meets prior highs from back in late June. However, the momentum is strong and there are possibilities of a continuation:
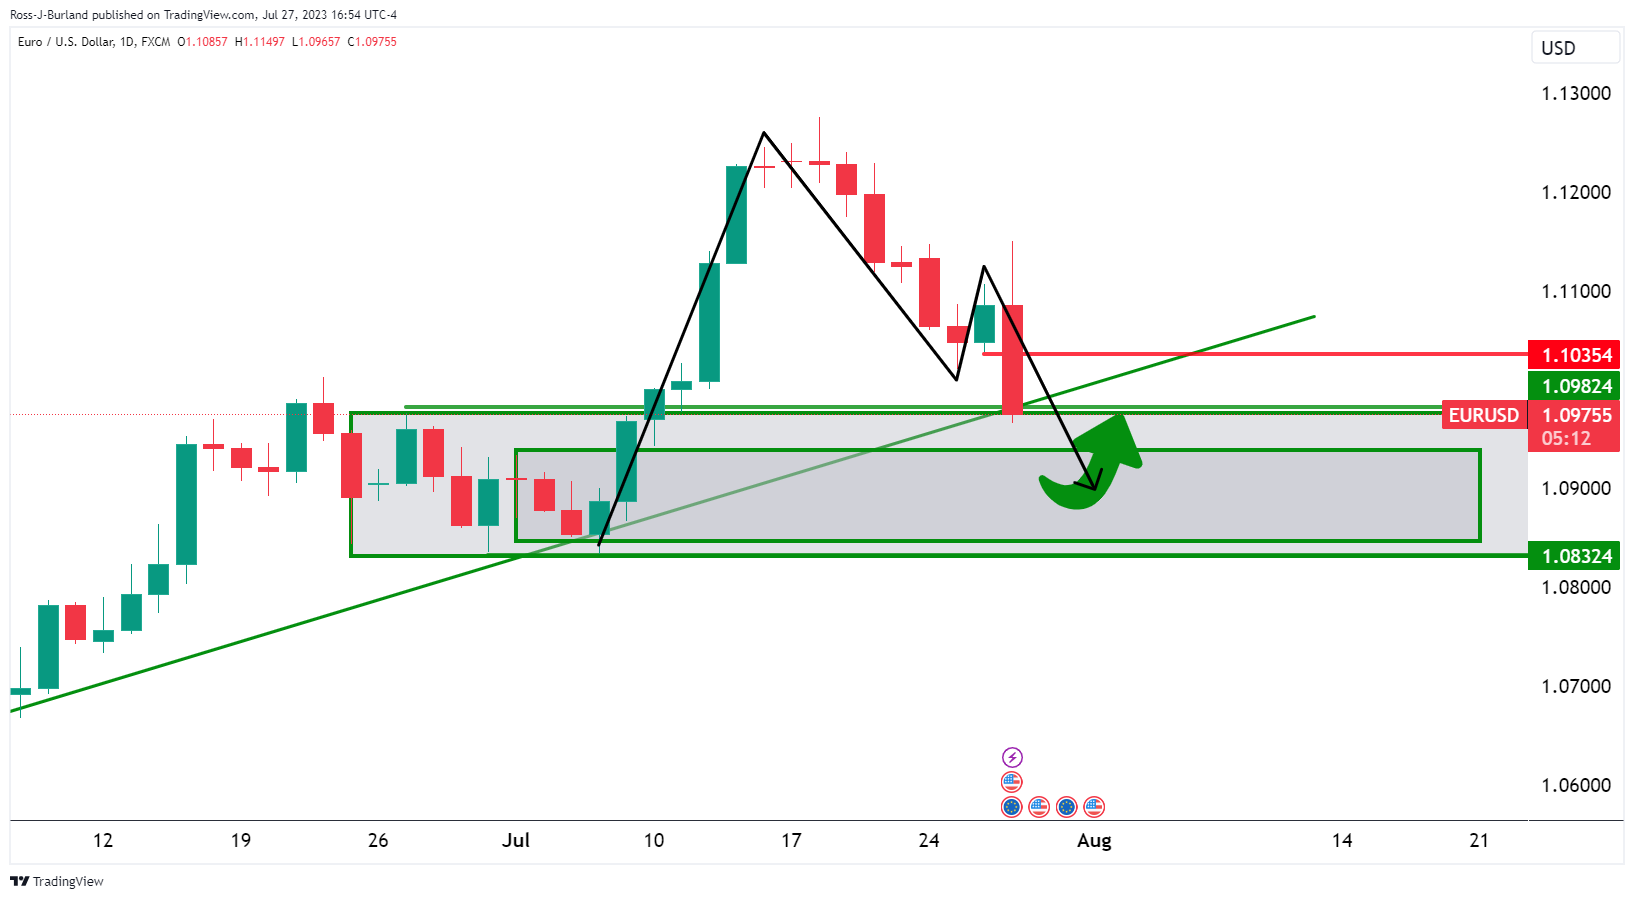
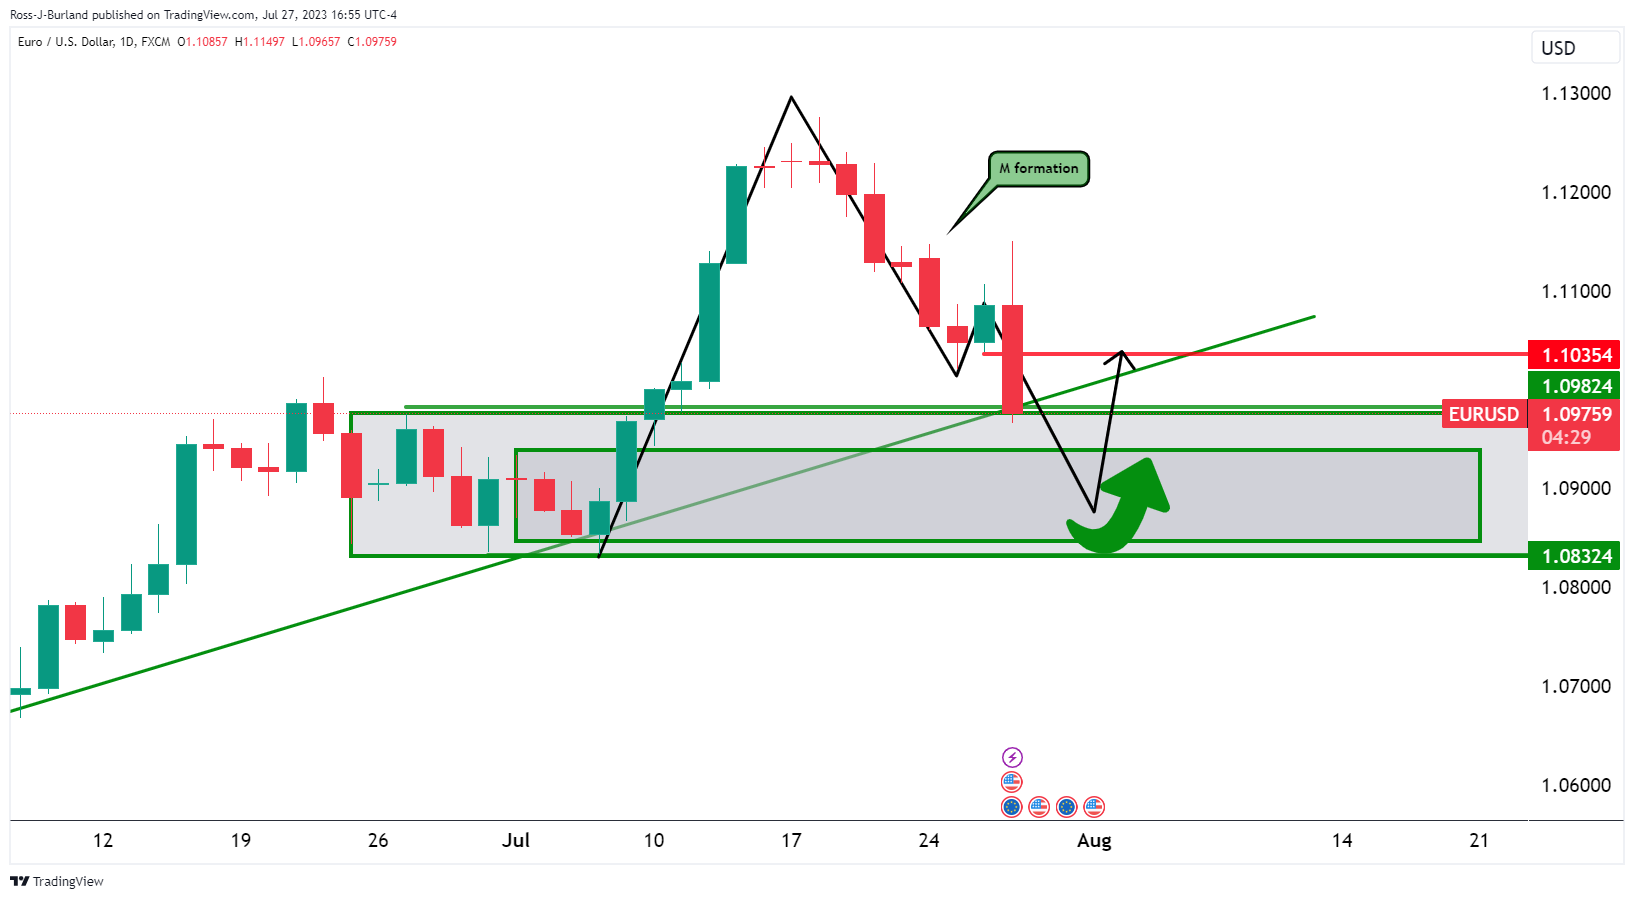
Such a move would be in line with creating an M-formation, a reversion pattern that would likely see a correction back towards the neckline and origin of the last bearish impulse.
- XAU/USD fell more than 1.40% on Thursday and lost the 100 and 20-day SMA near $1,940.
- Robust US data fueled hawkish bets on the Fed, increasing US yields.
- The USD DXY jumped back above 101.00.
On Thursday, non-yielding precious metals faced selling pressure amid strong data from the US, which made markets start to place bets on a possible hike by the Federal Reserve (Fed) in September, which increased US treasury yields.
It's worth mentioning that Jerome Powell claimed on Wednesday that in September, the Fed may hike or pause, adding that the decision will depend solely on incoming data. In that sense, on Thursday, the US reported that the Q2 Gross Domestic Product (GDP) expanded at a higher annualised pace than expected by increasing monthly Durable Goods Orders in June. In addition, Jobless Claims in the third week of July rose but were lower than anticipated hinting that the US economy is holding firm and may give the Fed room to deliver an additional hike.
As a reaction, US Treasury yields, which could be seen as the opportunity cost of holding Gold, increased across the board, applying pressure on the XAU/USD. The 2-year rate rose to 4.92%, the 5-year yield to 4.23%, and the 10-year to 4.00%, with all three seeing more than 1% increases.
XAU/USD Levels to watch
The daily chart suggests that the technical outlook for the XAU/USD has turned bearish for the short term. The Relative Strength Index (RSI) collapsed into negative territory, while the Moving Average Convergence Divergence (MACD) prints fading green bars, suggesting that the bears are in command. In addition, the price has fallen below the 20 and 100-day Simple Moving Averages (SMAs).
Support levels: $1,930, $1,915, $1,900.
Resistance levels: $1,945 (20-day SMA), $1,965 (100-day SMA), $1,980.
-638260872859459500.png)
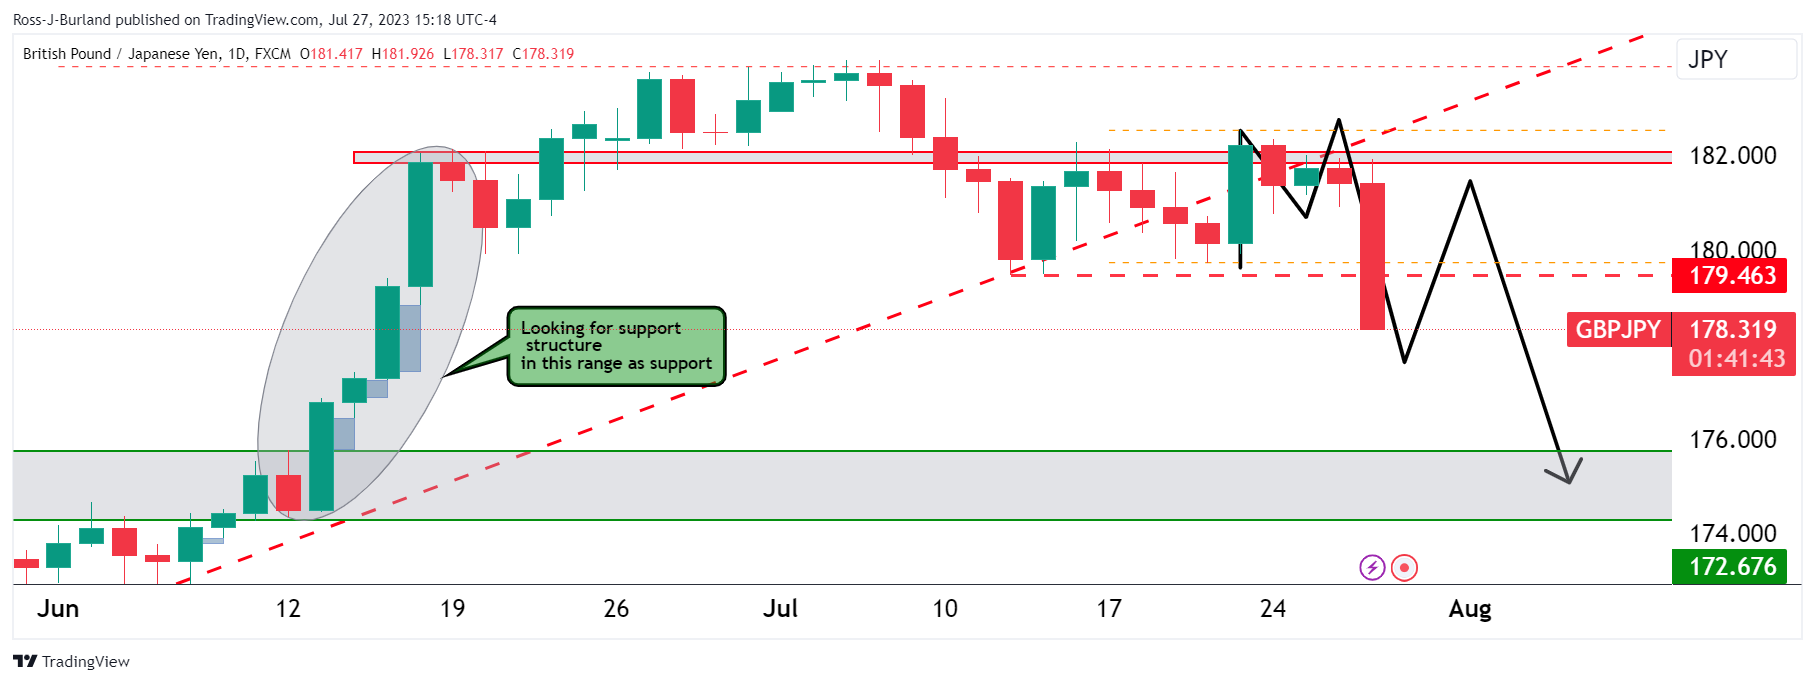
- GBP/JPY sells-off on BoJ sentiment ahead of Friday's meeting.
- GBP/JPY drops into a potentially strong area of support in the 177.70/90s as per the hourly structure.
- Bears also eye the Point of Control near 177.00 and then a swing support area at 176.50.
GBP/JPY collapses on a strong hint from Nikkei news that the BoJ will discuss dropping the 0.5% cap in 10Y JGB yields in Friday's meeting. The article has shaken up the sentiment surrounding the Bank of Japan whereby it was otherwise recently telegraphed by the BOJ Governor Ueda that there was "still some distance to sustainably achieve 2% inflation target" and that unless their assumptions on need to sustainably achieve 2% target changes the BoJ's "narrative on monetary policy won't change."
However, that narrative has flipped in New York trade on Thursday and USD/JPY fell from 141.10 to a low of 139.09 when the Nikkei reported '' the Bank of Japan will discuss tweaking its yield curve control policy at a policy board meeting Friday to let long-term interest rates rise beyond its cap of 0.5% by a certain degree, Nikkei has learned, in what would be a shift toward a more flexible policy approach.'' Consequently, GBP/JPY has been dragged deeper below trendline resistance as follows:
GBP/JPY technical analysis
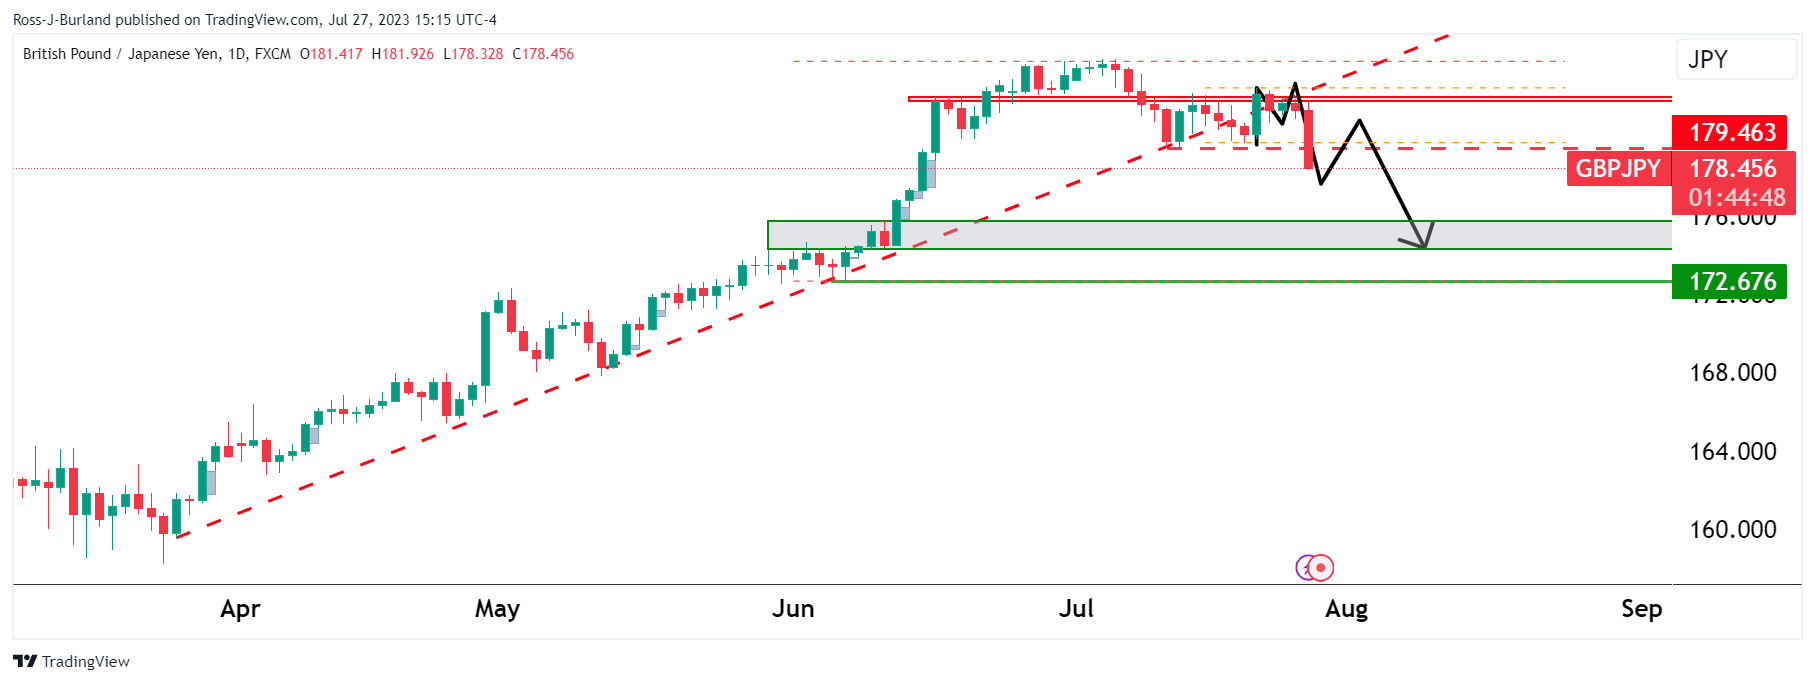
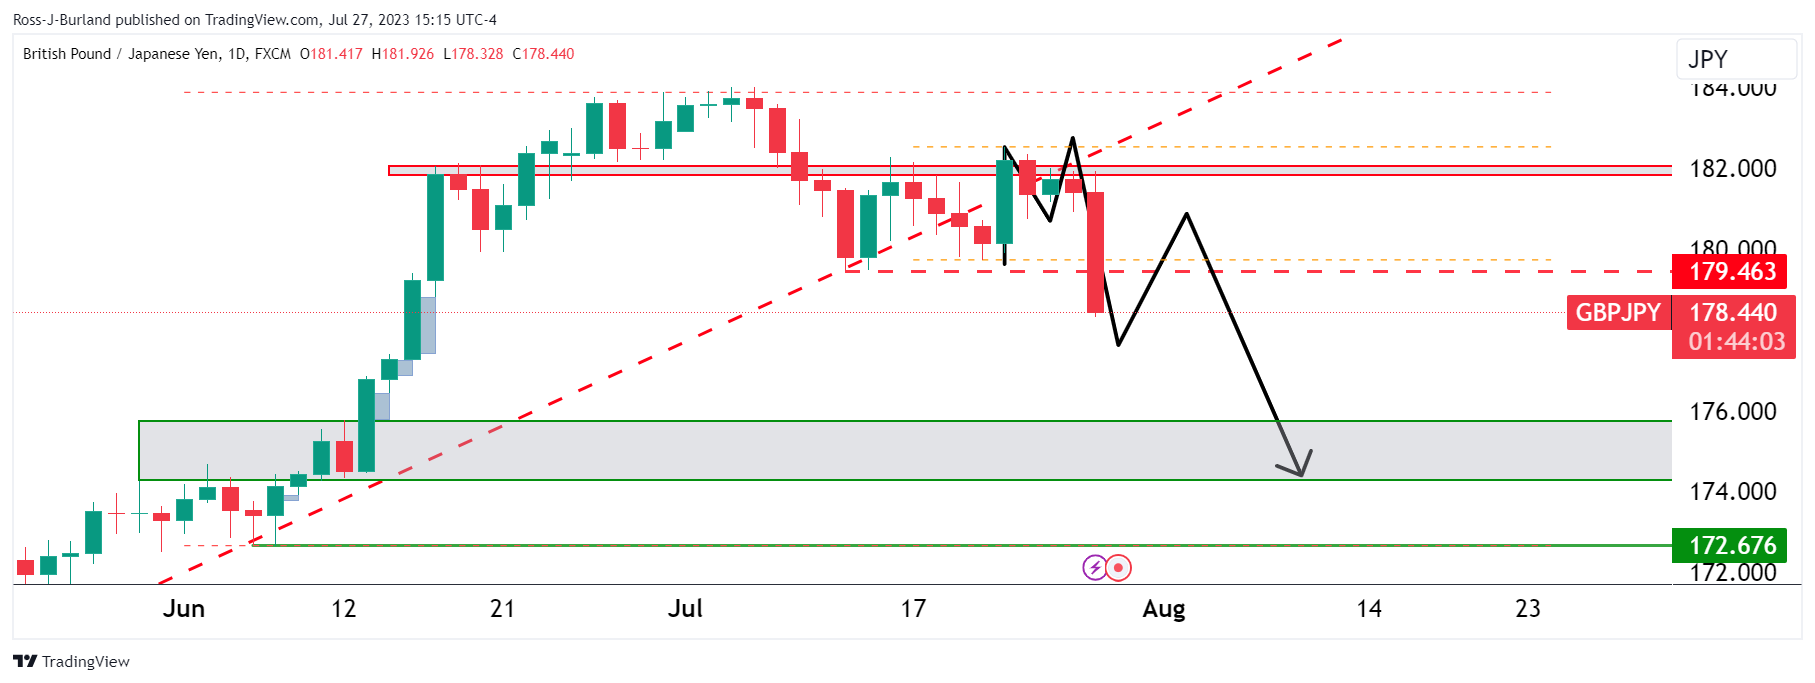
As can be seen, the price is falling but is leaving an M-pattern on the daily chart. A correction is inevitable but we just don't know when this horse will settle down.
GBP/JPY H1 chart

We can see a potentially strong area of support in the 177.70/90s as per the hourly structure back in the prior bullish cycle where volumes are starting to deplete. Below there, we have the Point of Control near 177.00 and then a swing support area at 176.50.
- EUR/JPY fell to its lowest point since mid-june seeing more than 1.30% losses falling below 154.00.
- ECB hiked by 25 bps, but Christine Lagarde didn’t commit to a hike in September.
- All eyes are now on BoJ’s decision on Friday. Reports suggest that the bank will consider a policy pivot.
The EUR/JPY cross tallied a fourth consecutive day of losses, weakened by Christine Lagarde’s neutral stance following the European Central Bank (ECB) decision to hike rates by 0.25% as expected. The Euro is seeing losses agains most of its rivals, including the JPY, while investors await the Bank of Japan (BoJ) decision early in the Asian session on Friday.
When asked if the bank had more ground to cover, Lagarde stated, “At this point, I wouldn't say so”. In addition, regarding the September decision, she confirmed that it would depend on the economy's evolution and inflation. She also added that the Council would not use forward guidance and would have the choice of raising or maintaining interest rates.
On the Japanese side, markets await the BoJ to maintain its dovish stance in Friday’s meeting. However, Nikkei reported on Thursday that the bank would consider keeping a rate ceiling but allow moderate rises beyond that level, which gave the JPY a significant boost. In addition, investors will eye the updated macro projections to continue modelling their expectations regarding the bank’s next steps.
EUR/JPY Levels to watch
According to the daily chart, the technical outlook is bearish. The Relative Strength Index (RSI) fell into negative territory, while the Moving Average Convergence Divergence (MACD) prints higher red bars indicating that the bears are in command.
Support levels: 153.00, 151.00, 150.00
Resistance levels: 156.00 (20-day Simple Moving Average), 157.00, 157.50.
EUR/JPY Daily chart
-638260776961677036.png)
USD/JPY bears jumped in on a Nikkei news article ahead of the Bank of Japan's meeting on Friday that took USD/JPY down from 141.10 to a low of 139.20 in a flash. The Nikkei reported, '' The Bank of Japan will discuss tweaking its yield curve control policy at a policy board meeting Friday to let long-term interest rates rise beyond its cap of 0.5% by a certain degree, Nikkei has learned, in what would be a shift toward a more flexible policy approach.''
This has flipped sentiment around that had otherwise been expecting a non-event in Friday's meeting considering it was only recently that the BOJ Governor Ueda said there was "still some distance to sustainably achieve 2% inflation target" and that unless their assumptions on the need to sustainably achieve 2% target change the BoJ's "narrative on monetary policy won't change."
The shift in sentiment is playing into a downtrend in USD/JPY on the charts as follows:
USD/JPY daily chart

With the price being on the backside of the bullish trendline, already breaking below the structure in mid-July, the test of the counter-trendline resistance has led to a sell-off. This down-trend cycle could well continue, especially if the BoJ does indeed communicate a change in the narrative on monetary policy. 134.00 is eyed as a potential support area.
- EUR/GBP peaked at a daily high of 0.8600 and then retreated below 0.8550.
- As expected, ECB hikes rates by 0.25% but didn’t commit to a hike in September.
- The 2-year German yield fell more than 1% to 3.23%.
On Thursday, the Euro weakened against most of its rivals, including the USD, GBP, AUD, and JPY, following the European Central Bank's (ECB) decision to hike rates by 0.25% as investors perceived a dovish tone in Christine Lagarde’s presser making German yields decrease.
Like Federal Reserve (Fed) Chair Jerome Powell on Wednesday, Christine Lagarde confirmed she was “open-minded” towards the September meeting as the decision will depend on the economic and inflation outlook. In addition, she stated that the Council will not engage in forward guidance and will have the option of either increasing or maintaining interest rates.
On the other hand, the GBP traded weak on Thursday against most of its rivals as investors continue to bet on a less aggressive Bank of England (BoE). Ahead of the August 3 decision, the World Interest Rate Possibilities (WIRP) suggest that the odds of a 50 basis point (bps) increase dropped nearly to 35%, and markets are discounting a terminal rate of 5.75-6.0% vs. 6.5% early in July.
EUR/GBP Levels to watch
From a technical perspective, the EUR/GBP pair retains the short-term bearish bias according to indicators on the daily chart. The Relative Strength Index (RSI) remains in negative territory. At the same time, the Moving Average Convergence Divergence (MACD) printed a red bar following two consecutive weeks of green bars, indicating that the bears are in the driver’s seat.
Support levels: 0.8540, 0.8530, 0.8500 (cycle low).
Resistance levels: 0.8582 (20-day Simple Moving Average), 0.8600, 0.8630.
EUR/GBP Daily chart
-638260736459765947.png)
Nikkei reported that the Bank of Japan (BoJ) “will discuss tweaking its yield curve control policy at a policy board meeting Friday to let long-term interest rates rise beyond its cap of 0.5% by a certain degree”. If materialized, it would be a shift from the BoJ to a more flexible monetary policy approach.
The BoJ meets on Friday, and until this report, no change in its monetary policy stance was expected.
Market reaction:
The Japanese Yen jumped across the board after the Nikkei report. The USD/JPY dropped more than a hundred pips in a few minutes, falling from above 141.00 to 139.80. The pair remains under pressure, looking at the daily low at 139.37.
- WTI jumped above $80.00 for the first time since mid-April.
- Tighter global supply and Chinese stimulus support the rise in Oil prices.
- Hawkish bets on the Fed may limit the price’s momentum.
On Thursday, the West Texas Intermediate (WTI) rose more than 1% to its highest level since mid-April, above $80.00. Investors seem to be weighing the fact that the Chinese economic stimulus would bolster local economic activity and drive Oil prices up on higher demand. In addition, expectations of Organization of the Petroleum Exporting Countries (OPEC) production cuts give further traction to the black gold.
On the negative side, the USD strength following the Federal Reserve (Fed) hike on Wednesday and the release of robust economic activity data on Thursday may limit the WTI’s advance. In that sense, as Jerome Powell opened a hike in September as the decision will be based on data, strong US data fuel hawkish bets on the Fed favouring the USD.
In that sense, it was reported that the Q2 Gross Domestic Product (GDP) increased at an annualised rate of 2.4%, exceeding the 1.8% expected and the previous 2%. Durable goods saw a notable increase in June. The headline number increased by 4.7% MoM, exceeding the market expectation of 1%, while orders excluding Defense and Transportation increased by 6.2% and 0.6%, respectively, despite expectations for them to remain unchanged.
In addition, Jobless Claims for the week ending on July 21 decreased further, coming in at 221,000 rather than the predicted 235,000 and the previous 228,000. According to the CME FedWatch tool, markets are discounting low odds of a hike in September (24%).
WTI Levels to watch
From a technical standpoint and according to the daily chart, the WTI holds a short-term bullish perspective. The price remains trading above its main moving averages, while its indicators edge higher but stand near overbought conditions to a downward correction shouldn’t be taken off the table.
Resistance levels: $82.00,$82.30,$82.50.
Support levels: $76.66 (200-day SMA), $74.96 (20-day SMA),$73.52 (100-day SMA).
WTI Daily chart
-638260698103410065.png)
- The NZD/USD peaked at a daily high of 0.6272 and then settled below 0.6200.
- US Q2 GDP, Durable Goods and Jobless Claims data came in strong, beating expectations.
- Investors digest Wednesday’s Fed decision and start to model their expectations.
On Thursday, the NZD/USD saw volatility and retreated from a daily high of 0.6272 and then fell below 0.6200. In that sense, the USD gained traction following robust high-tier economic data while investors asses the latest Federal Reserve (Fed) decision.
On Wednesday's press conference, Jerome Powell noted that future decisions will depend “solely” on incoming data after the Fed announced a 25 basis point hike to the 5.25-5.50% target range. In that sense, as the US reported an additional set of robust data, investors are starting to place bets on a possible hike in the September or November meeting, which seems to fuel the USD.
That being said, the Q2 Gross Domestic Product (GDP) from the US, was reported to expand at an annualised rate of 2.4%, above the 1.8% expected and the previous 2%, while Durable Goods notably grew in June. The headline figure saw a 4.7% MoM increase beating the 1% expected, while orders excluding Defense and Transportation expanded by 6.2% and 0.6%, respectively, while markets expected them to remain steady.
In addition, Jobless Claims for the week ending on July 21 continued to decelerate, coming in at 221,000, below the 235,000 expected and the previous 228,000. As for now, according to eh CME FedWatch tool, markets are discounting 24% odds of a hike in September and a 33% possibility of an increase in the November meeting