- Analiza
- Novosti i instrumenti
- Vesti sa tržišta
Forex-novosti i prognoze od 07-09-2023
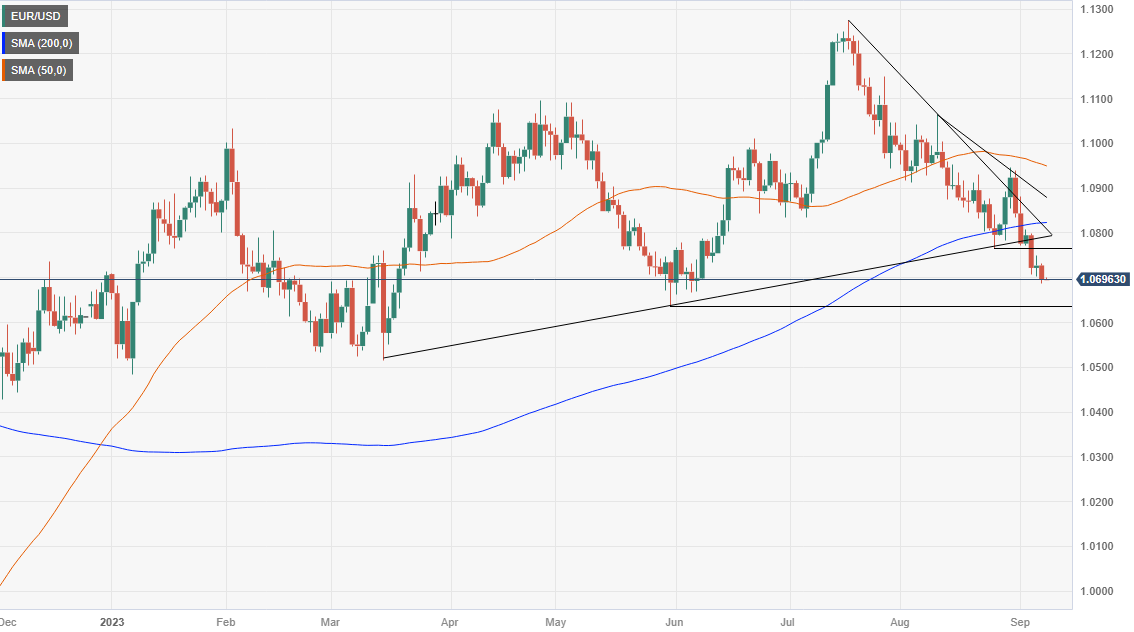
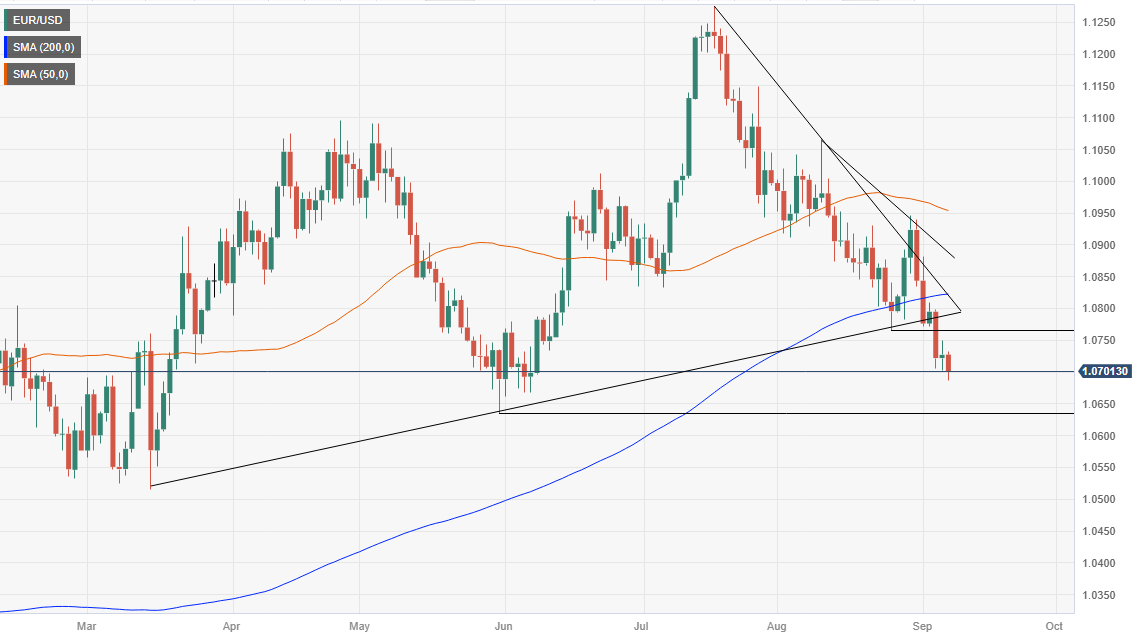
- EUR/USD trades at 1.0696, up 0.01%, but remains below the pivotal 1.0700 mark, signaling potential for further downside.
- For a bullish reversal, the pair needs to clear 1.0700 and aim for September 6 daily high of 1.0748 as an intermediate resistance.
- Most likely scenario sees EUR/USD targeting May 31 low of 1.0635, with a breach potentially exposing the 1.0600 psychological level.
The EUR/USD begins the Asian session almost flat but below the 1.0700 figure, seen as a bearish signal, after printing losses of 0.29% on Thursday, which could open the door to test May lows. At the time of writing, the major trades at 1.0696, up 0.01%.
EUR/USD Price Analysis: Technical outlook
The daily chart portrays a continuation of the downtrend, as the pair achieved a new lower-low and trades near the bottom of the weekly range. However, being the 1.0700 figure that usually keeps the EUR/USD seesawing in the top/bottom of the double zero mark, buyers and sellers need to take action to win the battle.
For buyers, the EUR/USD must climb above 1.0700 and reclaim the September 6 daily high of 1.0748, an intermediate resistance level. Once cleared, the pair's next ceiling level would be the September 5 high at 1.0798 before challenging the 200-day Moving Average (DMA) at 1.0822.
On the flip side, and the most likely scenario, due to recent economic data and the EUR/USD breaking decisively below the 200-DMA, the first support would be the May 31 daily low of 1.0635. A breach of the latter will expose the psychological 1.0600 figure, followed by the March 15 swing low of 1.0516.
EUR/USD Price Action – Daily chart
- NZD/USD remains on the defensive around 0.5875 amid the cautious mood.
- US Initial Jobless Claims declined to 216,000; Continuing Claims totaled 1.679 million, beating market estimates.
- US economic data lends support to the higher for longer interest rate narrative.
- The concern over of Chinese economic slowdown might exert some selling pressure on the Kiwi.
The NZD/USD pair remains under pressure below the 0.5900 barrier during the early Asian session on Friday. The US Dollar (USD) gains momentum as investors price in a quarter basis point (bps) hike in interest rates by the Federal Reserve (Fed) for the rest of the year. The pair currently trades near 0.5875, gaining 0.03% on the day.
Data released by the US Department of Labor on Thursday showed that the US Initial Jobless Claims totaled 216,000 in the week ending of September 2. This figure surpassed the market's forecast of 234,000 and followed the previous week's revised figure of 229,000 (from 228,000). Meanwhile, Nonfarm Productivity rose by 3.5%, below the 3.8% market expectation and revised from the first estimate of 3.7%. In response to the data, the US Dollar Index (DXY) edged higher to the highest level since early March above the 105.00 area,
New York Federal Reserve (Fed) President John Williams stated that inflation is heading in the right direction while adding that he requires additional information before making a decision. Chicago’s Fed President Austan Goolsbee said the Fed may achieve the golden path, where inflation erases but a recession is avoided. Along with The Federal Reserve (Fed) Governor Christopher Waller last week, he said that there is further room to increase interest rates, but the data will determine whether the Fed needs to hike rates again and if it is done hiking rates.
Nevertheless, the US economic data lends support to the "higher for longer" interest rate narrative, which boosts the Greenback across the board. According to the CME FedWatch Tool, markets have priced in 93% odds of holding the interest rate at the September meeting, while the probability of raising rates in its November meeting is around 51%.
On the Kiwi front, Statistics New Zealand showed on Thursday that the nation’s Manufacturing Sales for the second quarter improved to 2.9% versus a 2.1% drop in the previous reading. Earlier this week, the ANZ Commodity Price for August dropped to 2.9% from a 2.6% decline in July. The New Zealand Terms of Trade Index improved to 0.4% in the second quarter, compared to a decline of 1.5% in the previous reading and an expected drop of 1.3%. Apart from the data, the fear of the economic slowdown in China and the property debt crisis might exert some selling pressure on the China-proxy New Zealand Dollar (NZD).
Moving on, market participants will digest the data and wait for fresh impetus. In the absence of top-tier economic figures from both New Zealand and the US, risk sentiment will be a key factor for the pair movement. On Saturday, the Chinese Consumer Price Index (CPI) YoY for August will be released and it might trigger volatility in the next sessions. These figures could give a clear direction for NZD/USD.
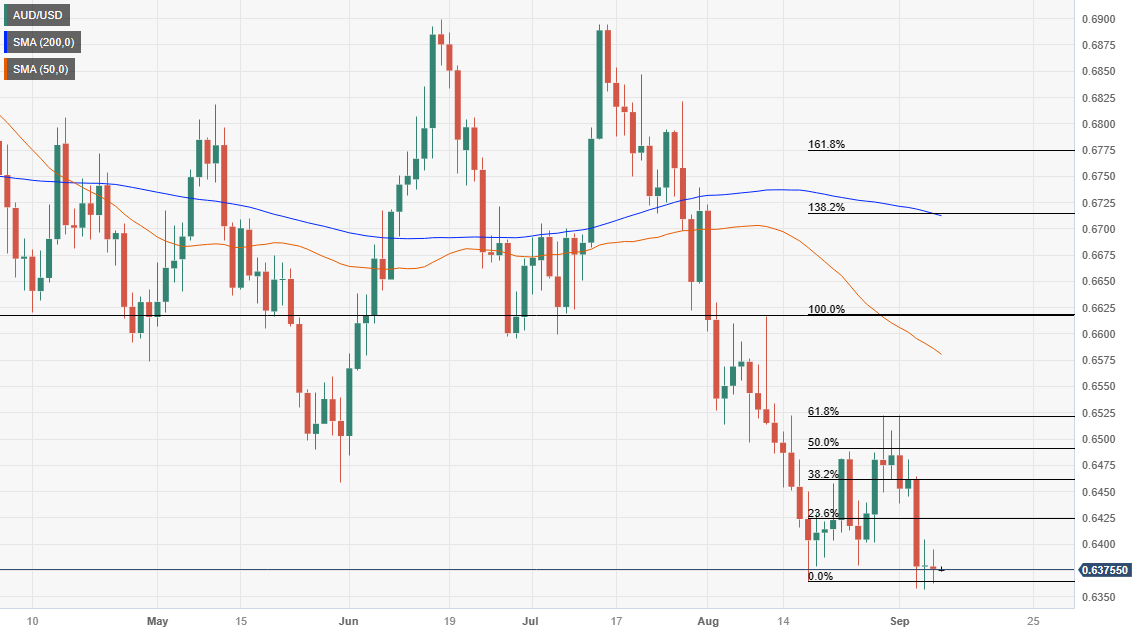
- AUD/USD trades flat at 0.6375 as Australia posts a trade surplus of A$8 billion in July, missing estimates and sparking risk-off sentiment.
- US jobless claims of 216K beat estimates, reinforcing the Fed’s ‘higher for longer’ stance and putting downward pressure on AUD/USD.
- Traders eye upcoming economic indicators from Australia and the US, including Westpac Consumer Confidence and US inflation figures.
The Aussie Dollar (AUD) pared its losses versus the US Dollar (USD) on Thursday after US economic data showed the US Federal Reserve (Fed) work is far from done, while weakness in China’s exports weighed the market mood. At the time of writing, the AUD/USD is trading at 0.6375, flat as Friday’s Asian session commences.
The Aussie Dollar remains flat against the US Dollar as strong US jobless claims and China’s export slowdown create a mixed trading environment
Australia’s economic docket showed that Imports surpassed Exports, but still, it showed a surplus on its Trade Balance of A$8 billion in July. Although the data is encouraging, missed estimates. That, alongside a weaker improvement of China’s exports, spurred a risk-off impulse that carried on throughout the whole trading day, with Wall Street finishing with losses, except for the Dow Jones, witnessing decent gains of 0.22%.
Aside from this, US economic data revealed by the US Department of Labor reinforced the Federal Reserve’s need to hold rates higher for longer, as said by its Chairman Jerome Powell. Unemployment claims for the last week rose by 216K, below estimates, while Continuing Claims gave signals that conditions are tightening.
The data bolstered the US Dollar (USD), which, as shown by the US Dollar Index, printed gains of 0.20%, standing near yearly highs above 105.000. Therefore, the AUD/USD was downward pressure near the 0.6350s area.
Meanwhile, US Treasury bond yields retreated somewhat, as money market futures slashed bets the US Federal Reserve would continue to tighten monetary policy, past the current Federal Funds Rate (FFR) at 5.25%-5.50%, Odds for a 25 bps rate hike in November, are at 43.4%.
Recently, Federal Reserve officials have kept their options open regarding deciding the forward path of monetary policy. John Williams from the New York Fed said that policy is “restrictive” but refrained from commenting on his decision. Of late, Chicago’s Fed President Austan Goolsbee said the Fed could reach the “golden path” where inflation falls but recession is avoided.
AUD/USD traders should be attentive to next week’s data. The Australian economic docket would feature the Westpac Consumer Confidence, NAB Business Confidence, and employment data. On the US front, inflation figures, Retail Sales, Industrial Production, unemployment claims and Consumer Sentiment would shed some light regarding the Fed’s future decision.
AUD/USD Price Analysis: Technical outlook
The daily chart portrays the pair subdued at around the year lows of 0.6357, printing back-to-back sessions of spinning tops, suggesting that neither buyers nor sellers are in charge. However, the trend remains downward, and if the AUD/USD drops below 0.6357, expect a challenge of the 0.6300 figure. Once cleared, the major would test the November 22 low of 0.6272. On the flip side, upside risks emerge above the September 6 high of 0.6405, with the next resistance at the September 5 high at 0.6464.
- XAU/USD found support at the convergence of the 20 and 200-day SMAs at $1,915.
- Jobless Claims for the first week of September from the US came in lower than expected.
- Tightening expectations for the Fed and US yields remain high.
The Gold Spot price XAU/USD recovered some ground after finding support at the $1,915 area, jumping towards $1,920. However, the upside is limited as the expectations of one last Federal Reserve (Fed) hike grow in the markets.
During the American session, it was reported that Initial Jobless Claims for the first week of September came in lower than expected. The figure came in at 216,000, lower than the expected figure of 234,000 and declining from the previous 228,000.
The US Treasury yields, often seen as the opportunity cost of holding non-yielding metals, declined on Thursday and allowed the yellow metal to gather momentum. That being said, they still remain high as markets are placing bets on the Federal Reserve (Fed) hiking again in this tightening cycle, in November or in December, as the US is showing evidence of its economic activity remaining strong despite the Fed's aggressive moves. The focus shifts to next week's Consumer Price Index (CPI) data from the US in order for markets to continue modelling their expectations.
XAU/USD Levels to watch
Based on the daily chart, XAU/USD maintains a neutral to bearish technical perspective, suggesting that the bears are gradually gaining momentum but are not yet in total control. The Relative Strength Index (RSI) exhibits a positive slope below its midline, while the Moving Average Convergence (MACD) lays out decreasing green bars.
Support levels: $1,915 (Convergence of 20 and 200-day SMA), $1,900, $1,880.
Resistance levels: $1,930, $1,950, $1,970.
XAU/USD Daily Chart
-638297203807772297.png)
- USD/CHF rose to 0.8925, up by 0.20% daily.
- Switzerland Unemployment data from August didn’t show any surprises.
- Hawkish bets on the Fed boosts the USD
On Thursday, the USD/CHF continued to gain ground, driven by a strong USD whose DXY index traded at highs since March above 105.00.
On the data front, the US reported that Initial Jobless Claims came in lower than expected in the first week of September, with the headline figure at 216,000, lower than the expected figure of 234,000 and decelerating from the previous 229,000. On the Swiss side, the Unemployment rate came in at 2.1% in August, matching the consensus.
What’s strengthening the USD seems to be investors placing hawkish bets on the Federal Reserve (Fed) due to the continuing favourable reports of the US economic activity. Despite US Treasury yields decreasing, the CME FedWatch tool suggests that swaps markets are pricing in higher probabilities of nearly 40% of a 25 basis point (bps) hike by the Fed in the November and December meetings.
USD/CHF Levels to watch
The daily chart analysis shows that the short-term outlook for USD/CHF appears bullish. The Relative Strength Index (RSI) and Moving Average Convergence Divergence (MACD) maintain favourable positions, with the RSI above its midline and displaying an upward trend and the MACD exhibiting green bars. In addition, the pair is above the 20 and 100-day Simple Moving Averages (SMAs), but below the 200-day SMA, pointing towards the prevailing strength of the bulls in the larger context.
Support levels: 0.8900, 0.8877 (100-day SMA), 0.8850.
Resistance levels: 0.8950, 0.9000, 0.9030.
USD/CHF Daily Chart
-638297162038382097.png)
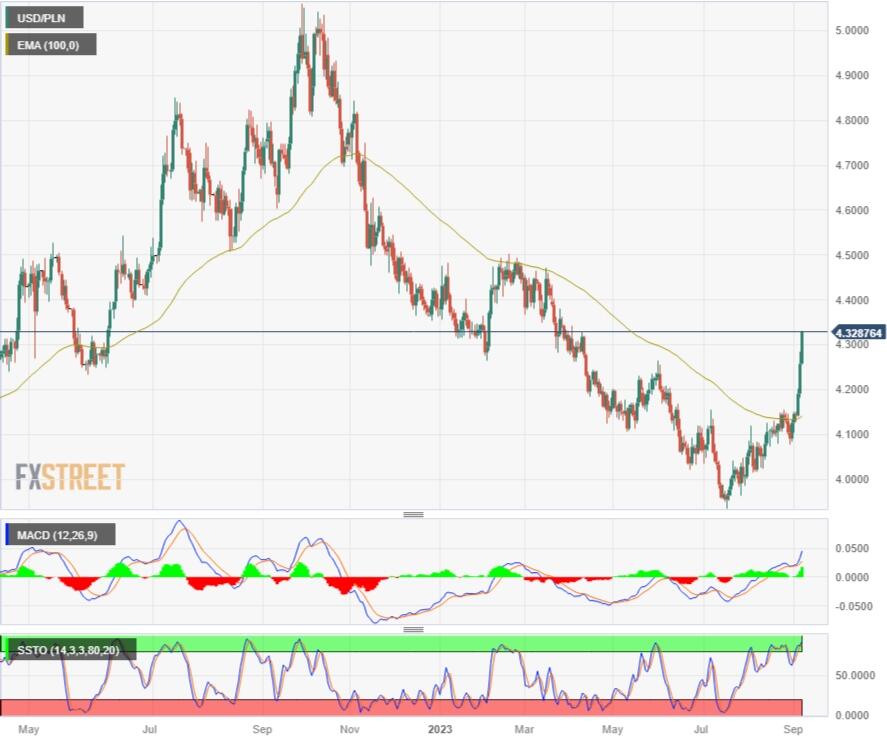
- Polish central bank cuts interest rates deeper than expected, draws criticisms.
- Politics appear to be influencing central bank action rather than the economy.
- Polish inflation is still in double-digit territory despite recent declines.
The USD/PLN is pushing higher following an interest rate cut from the National Bank of Poland (NBP), sending the Polish Zloty (PLN) into a tailspin. The NBP cut their reference rate from 6.75% to 6% on Wednesday, and the move is sending the PLN to five-month lows, erasing much of 2023’s gains.
Polish annual inflation remains slightly above 10%, far below the peak of 18% from earlier this year but still well above the NBP’s target of 2.5%. The Polish economy is also showing signs of a deepening slowdown, and too much movement from the NBP could exacerbate problems for the Polish economy.
Polish central bank accused of political motivations
NBP Governor Adam Glapinski, an open supporter of the governing Law and Justice conservative party, has been criticized for the poorly timed rate cut. Marek Tatala, vice president of the Economic Freedom Foundation, publicly stated that the central bank has “joined the election campaign” using his position at the NBP to try and stoke popularity for the ruling party by easing borrowing costs.
Reductions to the inflation rate will help to make lending rates cheaper in the short term, but Polish politician Ryszard Petru noted in a statement that cutting rates will be “pro-inflationary”, which could make life harder for the Polish population moving forward.
USD/PLN technical outlook
The USD/PLN has broken well above the 100-day EMA on the daily candles and appears set to continue breezing past the 4.3000 psychological level as the PLN eats away at the progress made through the year. The USD peaked against the Zloty in late 2022 near 5.000, reaching a floor of 3.9354 in July.
Technical resistance currently rests at the upper bound of April’s consolidation zone, just below 4.5000, and any bearish resurgence will face dynamic support from the 100-day EMA that is beginning to rotate bullish from 1.4500.
USD/PLN Daily chart
- Eurostoxx closes down on weak European data releases.
- DAX manages to hold steady as the German economy leads the EU group.
- FTSE saw a hesitant step upward as BoE signals a possible end of rate hikes.
Thursday’s European market session ended with a mixed bag thanks to the United Kingdom’s (UK) Financial-Times Stock Exchange 100 Share Index (FTSE 100) managing to hang onto intraday gains and close the day up around 0.35% near £7,430.
UK FTSE lifts on dovish BoE Gov Bailey
UK stock markets were potentially relieved to hear from the Bank of England’s (BoE) Governor Andrew Bailey that the peak of the rate hike cycle may have been achieved. Dovish comments from both Governor Bailey and policymaker Swati Dhingra helped to prop up the UK indexes, but the action came at the expense of the Pound Sterling (GBP), which broadly stepped lower on the news.
On the European Union (EU) side of The Channel, the Eurostoxx 50 closed lower, down -0.24% for Thursday. European equities continue to struggle under the weight of consistently underperforming economic data for the region, and growing fears of a slowdown are beginning to sap buying strength across the indexes. The Eurostoxx 50 closed out the day near €4,220.
German DAX holds steady for Thursday
Germany’s DAX index managed to avoid any losses, closing mostly flat on the day near €15,700. With economic data for the broad EU region beginning to show signs of weakness, Germany enjoys the benefit of having the least weak data. Still not good enough to spark confident rallies in the equity indexes, but enough to stave off further moves to the bearish side.
FTSE Technical outlook
The FTSE 100 will be the index to watch as equities grapple with possible policy stance changes from the BoE. Inflation may be bedding back down for the UK, but the technical positioning still leans bearish for the moment.
Current price action is struggling to make a clean break from the declining pattern from August’s start near £7,700, and bullish momentum remains limited from the £7,450 level. Continued short action will see support from August’s lows near £7,250, a level that saw similar technical support back in July.
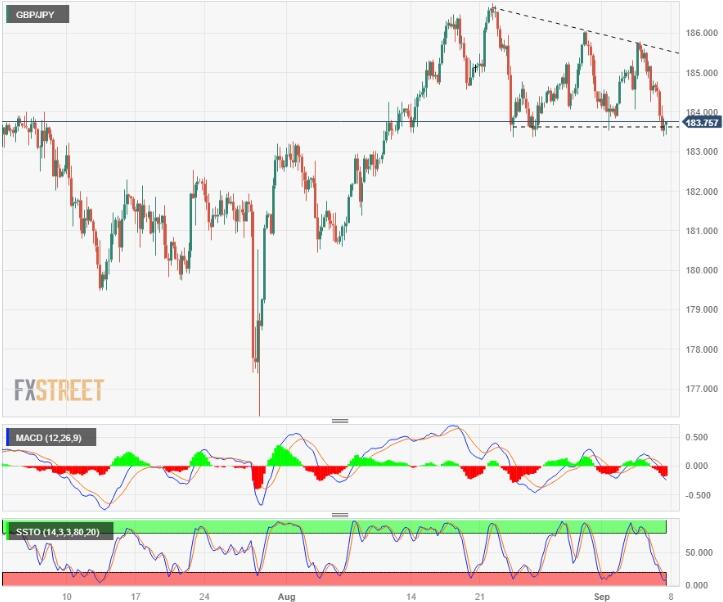
- The GBP/JPY can’t find a decent boost from near-term bottom.
- BoE Governor Bailey warns rate hike cycle could be approaching the end.
- Japan GDP data to determine JPY flows heading into the end of the week.
The GBP/JPY pairing is on the downside as the Pound Sterling (GBP) stumbles on comments from the Bank of England (BoE) Governor Andrew Bailey suggesting the rate hike cycle could be nearing its end. It’s been up-and-down action for the Guppy chart as the GBP struggles to find a foothold against the Yen (JPY). The week’s early near 185.75 couldn’t hold and now the pair is swamped near the bottom of a three-week channel near the 183.50 level.
Dovish BoE saps Pound Sterling momentum, sends GBP lower
BoE Governor Bailey hit the wires early Thursday with dovish comments about the BoE rate hike cycle, implying September’s rate call could see the end of interest rate increases from the United Kingdom’s central bank. Policymaker Swati Dhingra also hit the airwaves, echoing Governor Bailey’s dovish rate sentiment.
Japan GDP figures are on the docket, mild contraction expected
It's a data-light week for the GBP, and JPY traders will be keeping an eye out for Japanese Gross Domestic Product (GDP) figures due during Tokyo’s Friday market session. Japan’s GDP grew by 1.5% during the first quarter of 2023, and Q2 GDP is expected to show a minor reduction in the headline figure to 1.3%.
Technical outlook
The GBP/JPY sees contracting resistance from late August’s peak near 186.75, with lower highs tapping out a descending trendline. The near-term floor has been priced in near 183.60, and 4-hour chart technical indicators are beginning to flash oversold conditions.
On the daily candles, 184.00 is developing into a significant level for the Guppy, and while the overall trend remains decidedly bullish from the year’s lows near 156.00, upside momentum has been evaporating steadily. Bearish momentum from this level will see the GBP/JPY running into support from the 180.00 to 181.00 region.
GBP/JPY, 4-hour chart
The US Dollar remains firm, and on Friday, it will attempt to defend or extend the weekly gains. During the Asian session, Japan will release Q2 GDP data. Later in the day, the highlight will be the Canadian jobs report.
Here is what you need to know on Friday, September 8:
Wall Street finished mixed, with the Dow Jones gaining 0.17% and the Nasdaq falling 0.89%. Caution still prevails in the markets. US Treasury yields jumped initially after the release of US economic data but later pulled back. The US 10-year yield settled around 4.25%.
Data released in the US on Thursday revealed a decline in Initial Jobless Claims to 216K and Continuing Claims to 1.679 million, surpassing market estimates. Following the report, the US Dollar Index reached a peak of 105.15, its highest level since March, before retracing slightly to 105.05. Economic figures bolster the "higher for longer" interest rates narrative and provide support for the US Dollar.
EUR/USD posted its lowest daily close in three months, just below 1.0700. The Euro appears vulnerable, moving with a clear downward bias and showing no signs of stabilization. The final release of Germany's Consumer Price Index is upcoming, and no surprises are anticipated. Looking ahead, the European Central Bank (ECB) will hold its monetary policy meeting next week, and there is currently no clear consensus on what actions it may take regarding interest rates.
Analysts at Danske Bank on ECB meeting:
The worsened economic outlook and markets turning more dovish, we expect the ECB to deliver a 25bp hike at the September meeting, marking a peak in the deposit rate of 4.00%. After all, the ECB has an inflation mandate rather than facilitating economic activity.
USD/JPY pulled back modestly after reaching fresh multi-month highs just below 148.00. The reversal in US yields provided support to the Japanese Yen on Thursday. Japan is set to release Q2 GDP growth data on Friday.
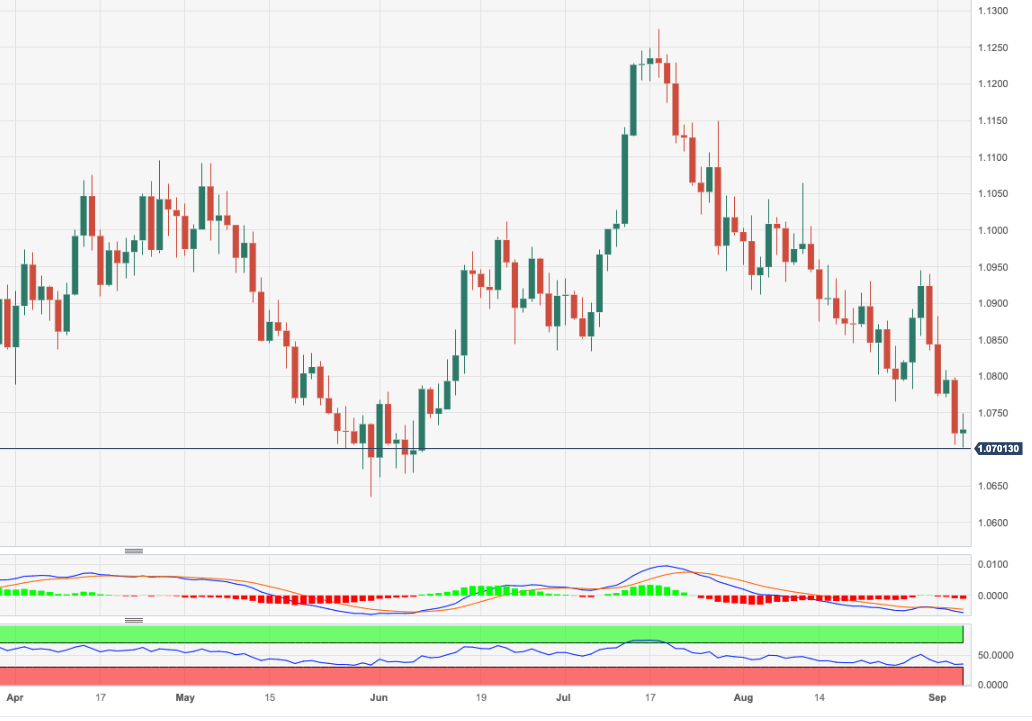
The British Pound registered its fifth daily decline out of the last six days, against the US Dollar. GBP/USD hit a three-month low at 1.2445, close to the 200-day Simple Moving Average (1.2425), before paring losses and rising to 1.2470.
Despite signs of stabilization in China's trade data, the Australian Dollar continues to face pressure from commodity prices and a stronger US Dollar. AUD/USD remains range-bound between 0.6360 and 0.6400, near monthly lows, with a downside bias.
The Canadian Dollar underperformed during the Americas session, despite upbeat Building Permits and Ivey PMI data. Following the Bank of Canada's decision to keep interest rates unchanged at 5%, Governor Macklem explained the decision and mentioned that there is little downward momentum in underlying inflation. USD/CAD rose to its highest level since March and is eyeing the 1.3700 area. Canada will release the August employment report on Friday.
TD Securities on Canadian jobs data:
We look for the economy to add 20k jobs in August, slightly below the 6m trend and well below levels required to keep up with population growth, with a partial rebound in construction helping to drive the headline print. A 20k print would leave the UE rate stable at 5.5%, while softer wage growth should give the report a dovish tone even if jobs print slightly above consensus.
Like this article? Help us with some feedback by answering this survey:
In an interview with Bloomberg, New York Federal Reserve President John Williams mentioned that inflation is moving in the right direction. Regarding the September FOMC meeting, he said he needs more data before deciding.
Williams added that labor market imbalances are evening out and that demand is coming down. According to him, the question before the Fed is whether monetary policy needs to be more restrictive.
He sees the risk of stronger-than-expected growth and projects the unemployment rate to edge up over the next year.
Market reaction
The US dollar pulled back marginally after the beginning of Williams' comments. The US Dollar Index is hovering around 105.00.
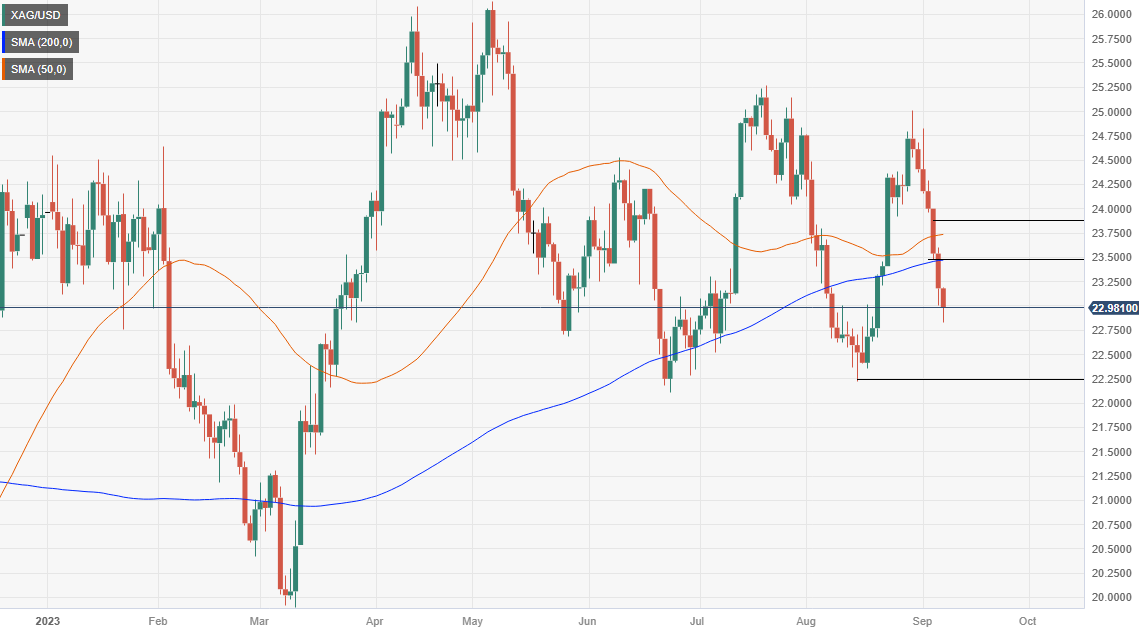
- Silver falls 0.83% despite a pause in US Treasury bond yield uptrend, as strong US jobless claims data hints at further Fed action.
- Money markets currently rule out rate hikes for the remainder of the year, but upcoming CPI data could reignite discussions.
- Traders eye US real yields and upcoming inflation data, as any upward revisions could signal headwinds for precious metals.
Silver price plunged 0.83%, although US Treasury bond yields paused their uptrend after data from the United States (US) sponsored speculations the US Federal Reserve is not done raising interest rates. Despite this, the Greenback (USD) is rising a headwind for the white metal. The XAG/USD is trading at $22.97 per troy ounce after hitting a daily high of $23.18.
XAG/USD drops BELOW $23.00 amid robust US jobless claims, putting precious metals under pressure as rate hike talks resurface
The precious metals segment, mainly the white metal, is under pressure, as Gold remains steady at $1,920.00 a troy ounce, gaining 0.18%. Solid data revealed by the US Department of Labor showed that Americans filling for unemployment claims was below expectations of 229K in the last week, with data coming at 216K. Although weekly measures tend to be volatile, Continuing Claims fell by 40K to 1.679 million in the week ending August 26, the lowest level since the week ended on July 15.
Given that the latest US Nonfarm Payrolls report for August was solid, despite seeing an uptick in the Unemployment Rate from 3.5% to 3.8%, it appears the Fed still has work to do.
However, after today’s data, money markets do not expect any rate hikes from the US central bank for the remainder of the year. Even though chances of a 25 bps rate hike are still below 50%, next week’s data could spark discussions about November’s meeting.
Next week, the US Department of Labor will reveal inflation in the country. The Consumer Price Index (CPI) for August is expected to come at 3.4% YoY, while core CPI, which excludes volatile items, is foreseen at 4.5% YoY. The former is projected to increase compared to July’s data, contrarily to core CPI.
Upward revisions on the data would add to already high inflationary pressures in the US and trigger action by the Federal Reserve. Traders should be aware that policymakers will enter its blackout period on Saturday. So, any signals must be viewed with a pinch of salt, as next week’s data could trigger a change of direction in the US central bank.
If US data suggests further tightening is needed, that would be a headwind for precious metals, as US Treasury bond yields would likely advance. Traders must follow the direction of US real yields, which are US nominal bond yields minus inflation expectations. Currently, the US 10-year TIPS, seen as a proxy for real yields, stands at 1.955%, three bps below its opening price.
XAG/USD Price Analysis: Technical outlook
Silver price is set to extend its losses after decisively clearing the 200-day Moving Average (DMA) at $23.46, while the 50-DMA closes into the former, threatening to form a death-cross, seeing as a bearish signal. If XAG/USD achieves a daily close below $23.00, expect further downside, with the August 15 daily low of $22.23 seen as the next support before it tumbles toward the June 23 swing low of $22.11. Conversely, buyers’ initial resistance would be seen at the 200-DMA, followed by the 50-DMA at $23.71.
The US Dollar can exhibit more strength through the end of the current year than previously expected, argue analysts at Wells Fargo. They point out that China's slowdown and a resilient US economy can support the Greenback. However, longer term, they see dollar depreciation.
Key quotes:
We are now more optimistic on the dollar's prospects over our entire investment horizon. Given our view for a deteriorating macroeconomic backdrop amid a sharp China deceleration, we believe the dollar could attract safe haven flows that boost the greenback through the end of this year.
We also believe the resilience of the U.S. economy and the possibility of additional Fed rate hikes should also attract investors toward dollar-denominated assets and support the greenback through the end of 2023.
Longer term, we continue to forecast a weaker dollar; however, we now believe the greenback will experience a slower pace of depreciation than previously. We still expect Fed rate cuts to weigh on the dollar next year, but with a U.S. “soft landing” a real possibility and inflation likely to hover above the Fed's target in 2024, sharp rate cuts are now less likely.
With the Fed likely to deliver a version of a “higher for longer” stance on interest rates, the dollar can now exhibit more resilience over the course of 2024.
- GBP/USD declined for a third consecutive day towards the 1.2470 area.
- Initial Jobless Claims from the US from the first week of September come in lower than expected.
- Investors await next week's CPI figures from the US from August.
- Market’s bet on a less aggressive BoE after Monetary Policy hearings on Wednesday.
On Thursday, the GBP/USD turned south and seems to be heading to the 200-day Simple Moving Average (SMA) at 1.2420 for a restest. A resilient USD and falling British yields are responsible for the pair’s movements.
On the data front, Jobless Claims from the week ending on September 1 came in slightly lower at 216,000 vs. the 234,000 expected, decelerating from the previous weekly reading of 229,000. The initial reaction boosted the USD, and the DXY increased to nearly 105.10.
The US Treasury yields are retreating but remain high, suggesting investors are gearing up for another Federal Reserve (Fed) hike this cycle. The 2-year consolidated Wednesday’s upward movements and declined below 5%, while the 5 and 10-year yields stand at 4.38% and 4.26%. Regarding expectations, economic activity in the US remains robust and doesn’t show signs of cooling, which would give the Fed the green light to consider one last hike. In that sense, the CME FedWatch tool suggests that the odds of one more 25 basis point (bps) hike stand near 40%, keeping the USD afloat.
On the GBP’s side, the 2,5 and 10-year rates are seeing more than 1% declines and may reflect that investors foresee a less aggressive Bank of England (BoE). On Wednesday, Andrew Bailey commented that the bank would remain data-dependent and didn’t commit to further hikes. At the same time, Swati Dhingra pointed out that the policy is “sufficiently restrictive”.
GBP/USD Levels to watch
The technical analysis of the daily chart points to a neutral to bearish outlook for GBP/USD, indicating the potential for further bearish movement. The Relative Strength Index (RSI) is getting nearer to oversold conditions, while the Moving Average Convergence (MACD) histogram presents rising red bars. Moreover, the pair is below the 20 and 100-day Simple Moving Averages (SMAs), but above the 200-day SMA, suggesting that despite the recent bearish sentiment, the bulls are still resilient, holding some momentum.
Support levels: 1.2420 (20-day SMA), 1.2400, 1.2380.
Resistance levels: 1.2470, 1.2500, 1.2550.
GBP/USD Daily Chart
-638297092469356213.png)
- EUR/USD trades at 1.0707, down 0.19%, as US jobless claims of 216K outperform the expected 229K, fueling a Fed rate hike speculation.
- Eurozone Q2 GDP grows a meager 0.1%, missing market expectations of 0.3%, raising concerns of a potential economic contraction.
- Despite high inflation, traders expect the ECB to maintain rates, though a hawkish statement from Lagarde is anticipated.
The Euro (EUR) caps its fall against the Greenback (USD) but remains trading with losses of 0.19% after data from the Eurozone shows the bloc grew at a marginal pace. Contrarily, the United States (US) labor market remains robust, as demonstrated by data. The EUR/USD is trading at 1.0700 after hitting a daily high of 1.0731.
Euro struggles against a resilient US Dollar as Eurozone GDP disappoints and US jobless claims beat expectations
Data revealed from the US Burea of Labor Statistics (BLS) showed the jobs market remains resilient amidst 525 basis points of tightening by the Fed, as Initial Jobless Claims for the last week printed 216K new fillings for unemployment, well below the 229K foreseen by analysts. This data spurred a repricing of further tightening by the US Federal Reserve, with chances for a 25 bps hike in November ticking up to 43%. Regarding September’s meeting, money market futures have priced in the Fed would stay put.
Consequently, the EUR/USD pair edged lower and hit a low of 1.0688. Since then, the pair has recovered territory and the 1.0700 figure, sponsored by US Treasury bond yields, registering modest losses. At the same time, the Greenback lost some ground, as the US Dollar Index (DXY) fell below the 105.000 mark but clung to gains of 0.11%.
Earlier in the European session, Eurostat revealed the Gross Domestic Product (GDP) for the second quarter (Q2) in the bloc grew by just 0.1%, lower than the 0.3% expected by the markets. Although the EU had missed a recession, recently revealed data showing that business activity is slowing, Industrial Production is dropping, and hawkish stances by European Central Bank (ECB) policysetters could pave the way for an economic contraction in the Eurozone.
Given the backdrop, the EUR/USD pair is set to continue to weaken despite the ECB’s hawkish commentary. Although inflation remains high, downside risks in the EU compared to the United States (US) paint a gloomy scenario for Europe. At the upcoming September meeting, traders expect the ECB to keep rates unchanged, though Lagarde and Co are foreseen to deliver a hawkish statement.
EUR/USD Price Analysis: Technical outlook
The pair’s fall below 1.0700 has opened the door for further losses, with sellers eyeing the next intermediate support at 1.0635, the May 31 swing low. Once cleared, there’s no demand area until the EUR/USD drops towards the March 15 daily low at 1.0516. Conversely, buyers can remain hopeful of higher prices if the major prints a daily close above 1.0700. First resistance would be September 7 high at 1.0731, followed by the September 6 high at 1.0748 and 1.0800.
Tiff Macklem, Governor of the Bank of Canada mentioned on Thursday that monetary policy “may be sufficiently restrictive to restore price stability” but warned the Governing Council “is concerned about the persistence of underlying inflation.” On Wednesday, the BoC kept its key interest rate unchanged at 5%.
Speaking before the Calgary Chamber of Commerce, Macklem added that they are prepared to raise rates further, if they have to, in order to “restore price stability”. After reading his remarks, the Governor will take questions from reporters.
Key takeaways from the speech:
We’ve come a long way in the past year. Monetary policy is working, and inflation is coming down. But we still have some way to go to restore price stability. With past interest rate increases still working their way through the economy, monetary policy may be sufficiently restrictive to restore price stability. However, Governing Council is concerned about the persistence of underlying inflation. Inflation is still too high, and there is little downward momentum in underlying inflation.
We will be carefully assessing the balance between demand and supply and underlying inflation to gauge progress toward price stability. If we need to raise interest rates further to restore price stability, we are prepared to take further action. But we don’t want to raise our policy rate more than we have to.
We know higher interest rates are hitting some Canadians hard, and we don’t want this to be any harder than necessary. But letting too-high inflation persist would be worse. We are confident that 2% is the right target. The target is now in sight. We need to stay the course.
Market reaction
The USD/CAD remained relatively steady hovering around 1.3670, on its way to the highest daily close in months.
- WTI decreased by more than 0.80%, below $87.00.
- Global tighter supply amid further extensions of voluntary cuts on OPEC+ countries limits the downside for WTI.
- US Crude Oil stockpiles decreased in the first week of September, above expectations.
In Thursday's session, the West Texas Intermediate (WTI) retreated below $87.00, near $86.30, after releasing the Energy Information Administration (EIA) stock data. On the USD side, despite falling yields, it stays resilient and contributed to the WTI’s decline.
On the data front, the Energy Information Administration (EIA) reported that Crude Oil stocks decreased by 6.37M in the first week of September, higher than the expected 2.06M, but failed to trigger a reaction on the WTI. Furthermore, as Oil contracts are denominated in USD, a stronger Greenaback limits the upside potential in the session, and the expectations of one last hike of the Federal Reserve (Fed) give the Greenback traction. On Thursday's session, it was reported that the number of people filling for unemployment benefits increased but was lower than expected, suggesting that the labour market remains resilient.
As for now, the odds of a hike in November or December by the Fed, according to the CME FedWatch tool, increased to 40%. High rates tend to cool down the economies, so solid economic figures may allow the Fed to continue hiking, limiting the WTI’s potential in the short term.
On a positive note, Saudi Arabia, the biggest Oil exporter in the world, is set to extend its voluntary production cuts throughout the rest of 2023 by 1.66 million barrels per day (bpd) after announcing a 1 million reduction in July. In that sense, supply forces may limit the downside for the WTI.
WTI Levels to watch
Analyzing the daily chart, the WTI's technical outlook is bullish in the short term, but indicators still flash overbought signals meaning that the price may correct in the next sessions. The Relative Strength Index (RSI) is above 70 with a negative slope, while the Moving Average Convergence Divergence (MACD) displays stagnant green bars. In the larger context, the pair is above the 20,100,200-day Simple Moving Average (SMA), suggesting that the bulls are firmly in control..
Support levels: $86.00, $85.50, $84.00
Resistance levels: $87.00, $87.50, $88.00
WTI Daily Chart
-638297048967901278.png)
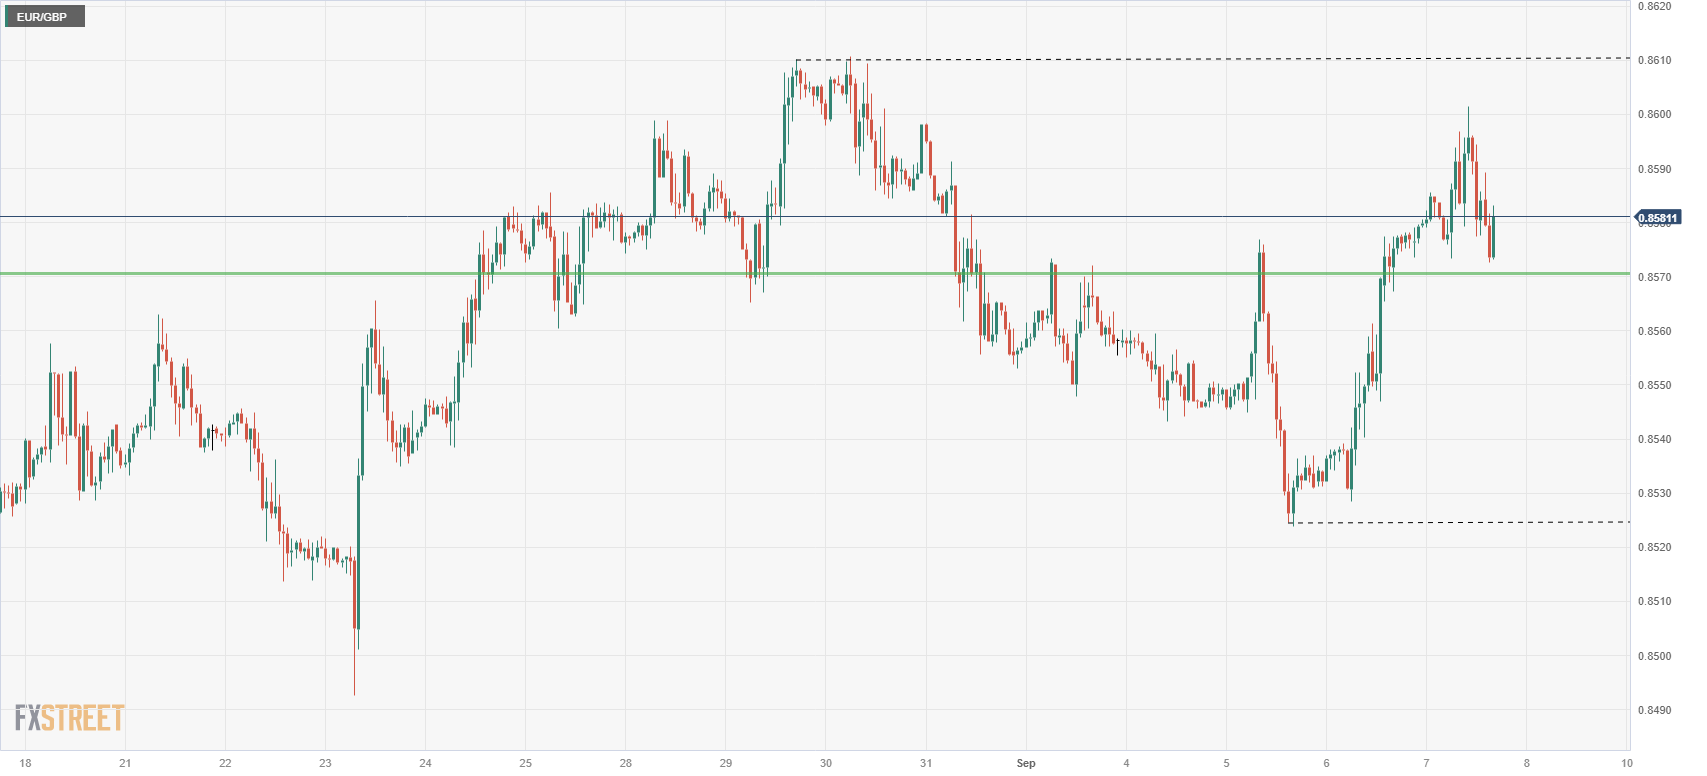
- The EUR has managed to climb up the charts against the GBP, but upside momentum remains limited.
- Eurozone data continues to miss expectations but hasn’t turned negative yet.
- Data-light GBP leaves the calendar open for the Euro.
The Euro (EUR) has managed to claw back some ground from the Pound Sterling (GBP) as of late, but the chart action has been middling for Thursday as the neighboring currencies play tug-of-war for chart momentum. It’s been a data-light week for the GBP, leaving the economic calendar decidedly Euro-centric for scheduled data events.
Gross Domestic Product (GDP) figures for the broader European Union (EU) came in slightly below expectations early Thursday, printing a meager 0.5%. Market forecasts expected the headline figure to match the previous period’s reported figure of 0.6%. The miss caused the Euro to sag briefly against the Pound Sterling, but a continued bump in German Bunds helped to bolster the EUR to a session high just beyond the 0.8600 handle before market sentiment dragged the EUR/GBP back towards the middle.
Upcoming on the economic data docket will be Germany’s Harmonized Index of Consumer Prices for August. The report is the Final version of the data point, with the Preliminary version released a week ago, so any wild deviations in the printing are not anticipated. The market forecast is for an annual rate of 6.4%, in line with the preliminary reading.
EUR/GBP Levels to watch
On the technical side, the EUR/GBP has caught a bump to lift away from the week’s low of 0.8524, but the challenge for Euro bulls will be to overcome late August’s swing high near 0.8610. Continued selling pressure will put the EUR/GBP back into August’s lows near 0.8580, but near-term support is being provided by the recent inflection point around 0.8570.
EUR/GBP 1-hour chart
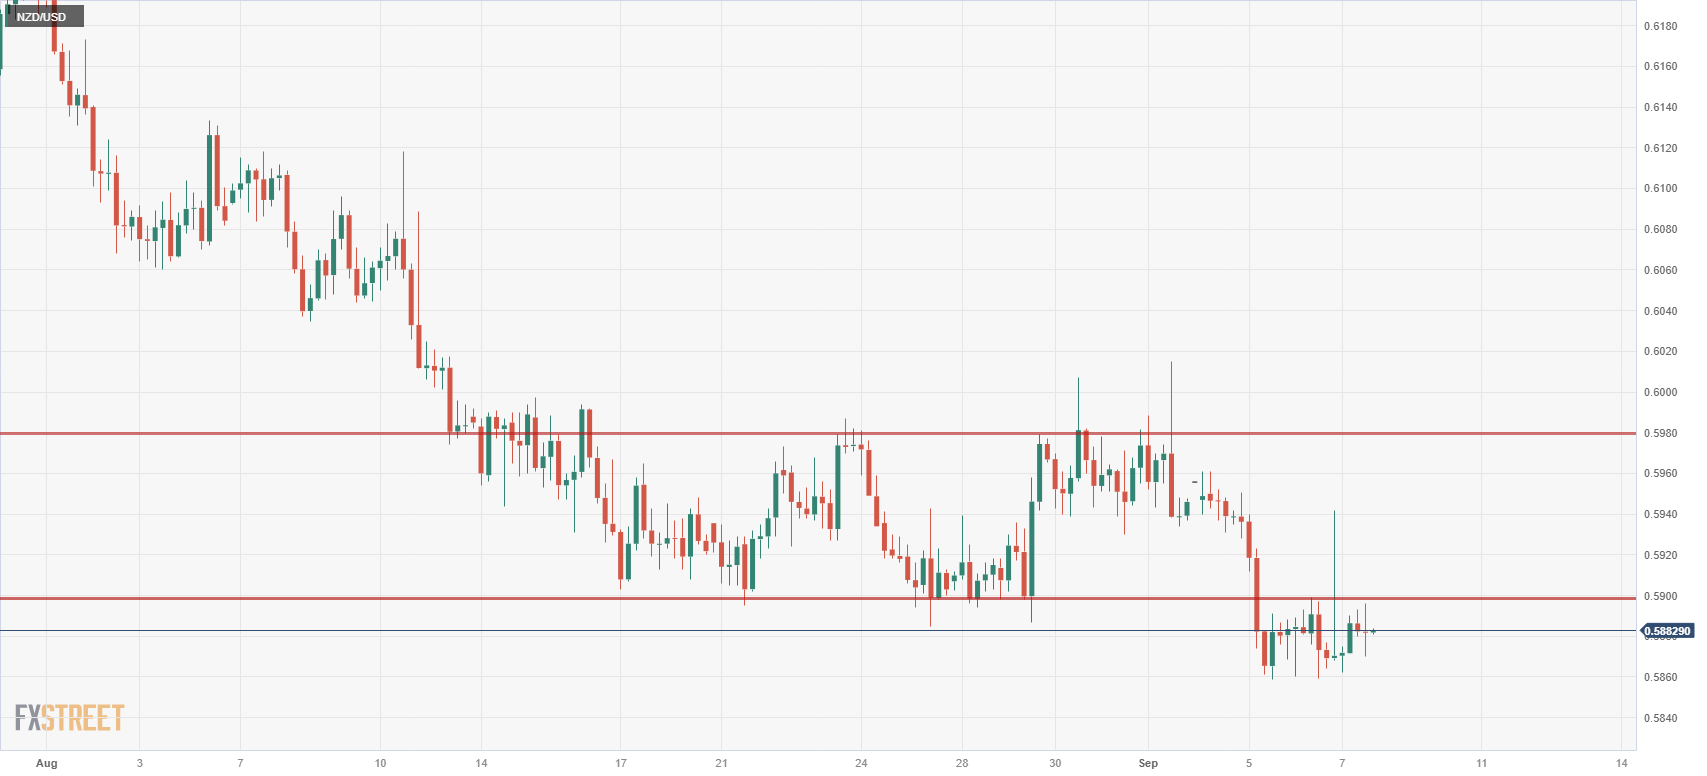
- NZD/USD remains trapped as Kiwi bulls seek upside momentum.
- Broader market remains very much a USD game.
- Upcoming Japan data could provide a bump for the Antipodeans if numbers deviate.
The NZD/USD finds itself range-bound as the week continues, trapped between yesterday’s high and low as the US Dollar (USD) refuses to give up ground against most of its major competitors. US Initial Jobless Claims came in better than expected, providing support for the Greenback, and a notable lack of recovery momentum leaves the Antipodeans in a slump after the USD’s bumper start to the week.
US Initial Jobless claims printed at 216K, below the previous period’s 229K, reversing the market’s forecasted increase to 234K. Several speaking notes are expected from members of the Federal Reserve (Fed) over the remainder of the day, and traders will want to keep an eye out for any fresh comments about monetary policy that could shift USD sentiment.
Things are notably light on the Kiwi (NZD) side. During the Asian session, traders will want to keep an eye on upcoming Japanese data that could produce some volatility if the numbers have any surprises. Japan's quarterly Gross Domestic Production figures are expected to show a slight decline; market forecasts are calling for a printing of 1.3%, down from the previous reading of 1.5%.
NZD/USD: 0.5900 is the new resistance
Looking out over the longer-term horizon, the Kiwi is tapping into the lowest prices for the year, touching ten-month lows near 0.5880. Continued selling pressure will see the NZD/USD pair at risk of free-falling to 2022’s lows near 0.5560, and the upside looks resistance-heavy as the NZD has clocked losses against the Greenback for six of the past seven trading weeks.
With the Kiwi’s recent slump to the downside of the sideways channel from the last three weeks, there’s a risk the previous support from 0.5900 could now act as a near-term resistance level.
NZD/USD 4-hour chart
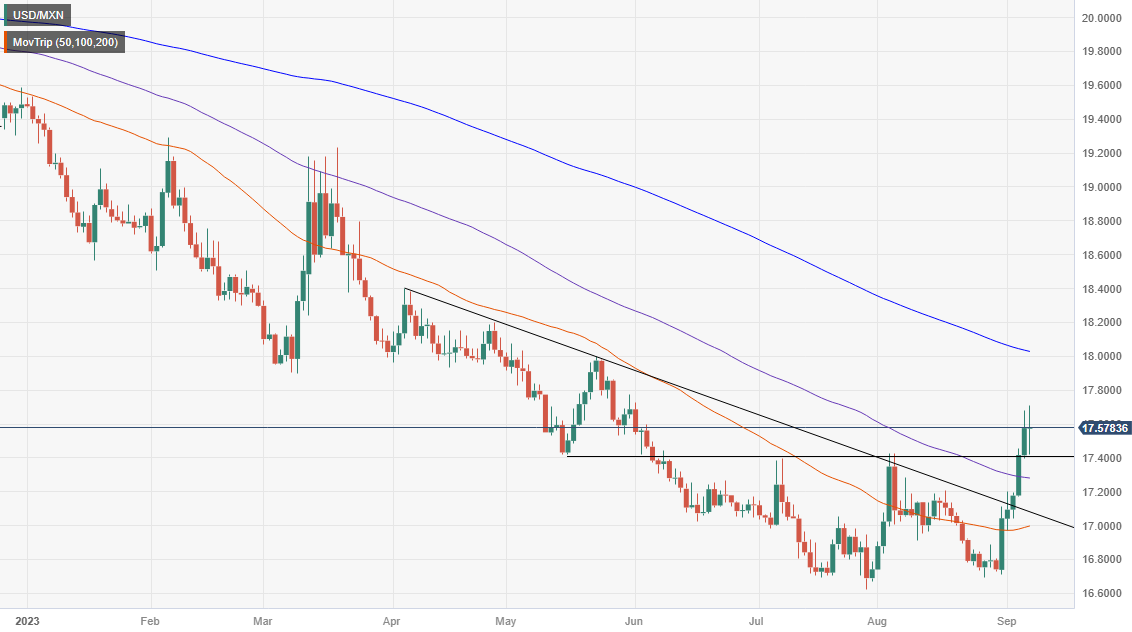
- USD/MXN drops 0.30% to 17.5300 as Mexico’s inflation falls to 4.64%, meeting market expectations and signaling a cooling economy.
- US jobless claims below forecasts at 216K, but the Mexican Peso gains ground, challenging the Fed’s neutral stance on rate hikes.
- USD/MXN faces strong resistance at 18.0000, with potential triggers for volatility, including Fed surprises and Mexico’s 2024 general election.
The Mexican Peso (MXN) recovered some ground against the US Dollar (USD) on Thursday, although Mexico’s economy deflates while the US jobs market remains tight. Hence, the USD/MXN is trading at 17.5300, a loss of 0.30%, after hitting a daily high of 17.7074.
Mexican Peso gains against the US Dollar despite a strong US labor market, as inflation in Mexico drops
The Instituto Nacional de Estadistica Geografia e Informatica (INEGI) revealed that inflation in Mexico dropped to its lowest level since March 2021, at 4.64%, as expected by market analysts. Core inflation, which excludes volatile items, slowed sharply to a 20-month low in August at 6.08%, below the foreseen 6.12%.
Jonathan Heath, a Deputy Governor of the Bank of Mexico (Banxico), said in social media X that core inflation was “good news” while adding, “There is still a long way to go.” Recently, some Banxico officials stressed the need to maintain higher rates as the central bank curbs inflation.
Across the border, the US Bureau of Labor Statistics (BLS) revealed that unemployment claims rose by 216K, beneath 229K forecasts on the week ending September 2, flashing a tight labor market. Even though the Greenback (USD) appreciated against most G8 currencies on the news release, the Mexican Peso outweighed the former, as the USD/MXN continued to trend downwards.
Fed officials have become more neutral, as data suggests prices are cooling down. But the resilience of the US jobs market puts the US central bank at a crossroads between doing too much and triggering a recession or perhaps under-tightening and suffering the consequences of an acceleration of inflation.
Meanwhile, the CME FedWatch Tool depicts money markets have fully priced in the Fed will keep rates unchanged in September. But for November, chances of a 25 bps increase lie at 43.5%.
Given the recent developments in both economies, the USD/MXN is set to print more gains, though it would face strong resistance at 18.0000. Any hawkish surprises by the Fed and next year’s Mexico general election could trigger outflows from the emerging market currency.
USD/MXN Price Analysis: Technical outlook
From a technical standpoint, the USD/MXN is neutral to upward biased. Still, today’s pause could spur some consolidation as bulls recharge batteries to challenge the 18.0000 psychological figure. Even though a pin-bar is forming, a daily close below September’s 6 low of 17.3912 could pave the way for a deeper correction. Otherwise, a break above 17.7074 and the pair could reach 18.0000.
- USD/JPY declined more than 0.30% towards 147.20.
- Initial Jobless Claims for the first week of September came in lower than expected.
- Masato Kanda didn’t rule out an intervention to stop JPY’s weakness.
On Thursday’s session, the USD/JPY slightly fell towards the 147.20 area, driven by the growing expectations of the Bank of Japan (BoJ) taking action to stop the JPY’s decline. On the other hand, the USD is consolidating, but hawkish bets on the Federal Reserve (Fed) limit the downside for the Greenback.
The US Bureau of Labour Statistics reported that the number of people filing for unemployment benefits increased but was lower than expected. The actual figure came in at 216,000 vs. the 234,000 expected and was lower than the previous weekly reading of 229,000.
Meanwhile, the USD measured by the DXY index holds above the 105.00 zone, its highest level since March. On the other hand, US Treasury yields slightly retreated but remained in weekly highs after yesterday’s rally following the strong ISM PMI figures from the US from August. In that sense, the CME FedWatch tool suggests that markets still bet on higher odds of one last hike by the Federal Reserve (Fed) in this cycle, and the odds of a 25 basis point in November and December stan near 40%.
However, those expectations may change after next week’s Consumer Price Index (CPI) figures from the US from August.
On the Bank of Japan's (BoJ) front, Reuter reported that Japan's top currency diplomat, Masato Kanda, stated that the Japanese banking authorities are considering an intervention to end “speculative” movements. In that sense, in case the BoJ steps in, the JPY may see some upside, but monetary policy divergences seem to be the main reason for Yen’s weakness. Furthermore, on Friday, investors will see Japan's Gross Domestic Product (GDP) Q2 revision figures.
USD/JPY Levels to watch
Observing the daily chart, the USD/JPY displays signs of bullish exhaustion, leading to a neutral to bearish technical perspective. The Relative Strength Index (RSI) displays a negative slope in the bullish territory, hinting at a potential shift in momentum, while the Moving Average Convergence (MACD) exhibits shorter green bars. In the broader context, the pair is above the 20,100,200-day Simple Moving Average (SMA), highlighting the continued dominance of bulls on the broader scale.
Support levels: 147.00, 146.50, 146.10 (20-day SMA).
Resistance levels: 147.50, 148.00, 148.50.
USD/JPY Daily Chart
-638296986911906841.png)
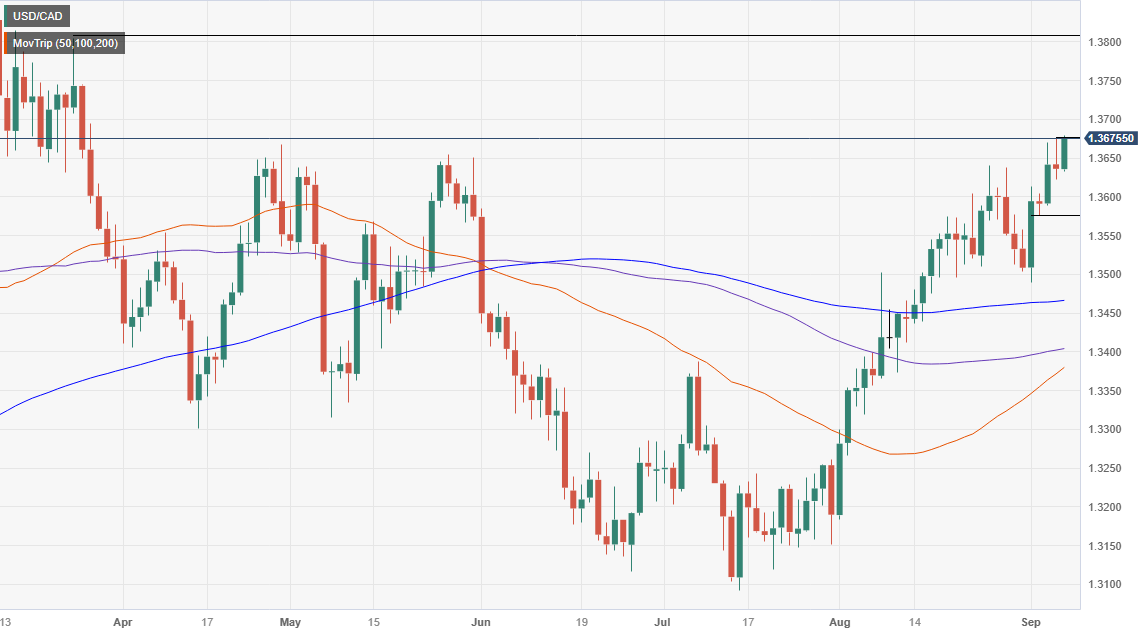
- USD/CAD rises 0.35% to 1.3675 after US jobless claims fall below estimates, pressuring the Fed to focus on its 2% inflation target.
- Market anticipates a 43.5% chance of a 25 bps Fed rate hike in November, as per CME FedWatch Tool, bolstering the US Dollar.
- Loonie stumbles as crude oil prices dip and Canadian GDP contracts, diminishing prospects of a Bank of Canada rate hike.
The US Dollar (USD) extends its advance against the Loonie (CAD) as data from both countries, although it remains positive, favors the Greenback. Powell’s saying “higher for longer” in his speeches continues to impact the markets, which remain wary of further tightening, boosting the USD. The USD/CAD is trading at 1.3675 and gains 0.35% after hitting a daily low of 1.3631.
USD/CAD gains momentum amid favorable jobless claims and Fed rate hike speculation despite stable Canadian business activity.
The US Department of Labor showed that Initial Jobless Claims for the week ending September 2 rose by 216K, below estimates of 229K, indicating the jobs market is yet to loosen. This puts pressure on the US Federal Reserve (Fed), which focuses on bringing inflation towards its 2% goal.
Although Fed policymakers have begun to adopt a more cautious stance, the market’s reaction suggests the Fed could increase rates in the future. The CME FedWatch Tool depicts money markets have fully priced in the US central bank would keep rates unchanged in September. But for November, chances of a 25 bps increase lie at 43.5%.
The USD/CAD pair reacted to the upside on the data, even though US Treasury bond yields are unchanged. In the meantime, the US Dollar Index (DXY), a gauge of the buck’s value against a basket of peers, prints modest gains of 0.18
Another reason behind Loonie’s fall is crude oil prices are under pressure, down 0.31%, at $87.27, as the market awaits EIA inventories.
Recently, data from Canada showed that business activity expanded in August following a contraction of 48.6 in July. The Ivey PMI came at 53.5, indicating expansion, as shown by data on Thursday. Some subcomponents of the PMI showed an improvement, like employment and supplier deliveries. Although it paints an improved scenario, the latest Gross Domestic Product (GDP) report for the second quarter contracted -0.2%, denting the Bank of Canada (BoC) of a possible rate hike yesterday as the economy cools down.
What to watch?
The Canadian economic docket would feature employment data, while the US will release Wholesale Inventories and Fed speakers.
USD/CAD Price Analysis: Technical outlook
The pair resumed its uptrend, challenging a major resistance area at 1.3667, April’s 28 daily high. A daily close above the latter would expose the 1.3700 figure and then the March 24 high at 1.3804. Conversely, sellers could remain hopeful of lower prices if USD/CAD ends Thursday’s session below 1.3667. A breach of the latter would expose September’s 6 low of 1.3622 before diving towards September 4 low of 1.3586.
Analysts at Wells Fargo have moved up the commencement of interest rate cuts from the Federal Reserve from May 2024 to March. They look for the FOMC to cut rates by 225 basis points next year.
US economy has remained resilient, but growth outlook appears to be subpar
Last month, we anticipated that the FOMC would begin cutting rates in May 2024. We now look for the Committee to cut rates by 25 bps at its March 2024 meeting.
In total, we look for the FOMC to cut rates by 225 bps next year, a bit less than the 250 bps of easing we had projected last month. This would bring the fed funds target range down to 3.00%-3.25% by the end of 2024.
Increased prospects of a "soft landing," although still not our base-case view, have led us to modestly pare back our forecasted amount of policy easing.
We believe that the Fed's tightening cycle has come to an end. The probability of another rate hike at the Sept. 20 FOMC meeting appears to be low. We acknowledge the FOMC could raise rates again at its meeting on Nov. 1, but we anticipate that the Committee will remain on hold as inflation continues to ease and as the economy decelerates.
- Silver price plummets to $23 as the US labor market remains resilient.
- US Q2 Unit Labor Costs jumped to 2.2% vs. expectations and the former release of 1.6%.
- Silver price corrects vertically to near the 200-day EMA, which trades around $23.30.
Silver price (XAG/USD) corrected significantly to near $23.00 as United States labor market indicators outperformed expectations. The white metal faces selling pressure as the US Department of Labor reported that individuals claiming jobless benefits for the first time dropped to 216K for the week ending September 01 vs. expectations of 234K and the former release of 229K.
Meanwhile, Q2 Unit Labor Costs jumped to 2.2% vs. expectations and the former release of 1.6%. Decent wage growth would keep households’ disposable income higher and might eventually keep inflationary pressures stubborn.
The S&P500 opens on a negative note as the tight US labor market would allow the Federal Reserve (Fed) to keep doors open for further policy tightening. The Fed is widely expected to keep interest rates unchanged in September monetary policy. As per the CME Fedwatch Tool, traders see a 93% chance for interest rates to remain unchanged at 5.25%-5.50% in the September policy meeting.
The US Dollar Index (DXY) edges marginally lower from its five-month high of 105.10. However, the upside bias is still solid as the market mood is quite cautious. For further action, investors will focus on the Consumer Price Index (CPI) for August, which will be released next week.
Silver technical analysis
Silver price corrects vertically to near the 200-day Exponential Moving Average (EMA), which trades around $23.30. The white metal forms a Head and Shoulder chart pattern, which is a bearish reversal pattern. The neckline of the aforementioned formation is placed from June 22 low at $22.18.
The Relative Strength Index (RSI) (14) drops to near 40.00. A bearish impulse would be activated if it breaks below the same.
Silver daily chart
-638296915233165909.png)
- EUR/USD breaks below the key 1.0700 support.
- Next on the downside aligns the May low in the 1.0630 zone.
EUR/USD retreats further and breaches the key support at 1.0700 the figure on Thursday.
The underlying bearish sentiment remains unchanged and leaves the door open to extra pullbacks in the short-term horizon. Against that backdrop, the pair could now embark on a probable visit to the May low of 1.0635 (May 31) ahead of the March low of 1.0516 (March 15).
In the meantime, further losses remain in the pipeline while below the key 200-day SMA, today at 1.0821.
EUR/USD daily chart
- DXY advances further and trespasses 105.00.
- The continuation of the march now targets the YTD highs.
DXY finally manages to surpass the key 105.00 hurdle, up for the third consecutive session on Thursday.
The continuation of the multi-week rally is now expected to shift its attention to the 2023 high of 105.88 (March 8) prior to the round level at 106.00.
While above the key 200-day SMA, today at 103.02, the outlook for the index is expected to remain constructive.
DXY daily chart
Analysts at Danske Bank project a minor contraction in the European economy during the second half of 2023. They argue that the disinflationary process is underway, but not enough for the European Central Bank (ECB) to be confident in the timely return to the 2% target.
Bye-bye two speed economy. Hello contraction
The August PMIs painted a gloomy picture following the also weak July print. Service PMI dropped to a 30-month low of 48.3, entering contractionary territory, while the manufacturing sector continued to register declining activity. The releases conclude the end of the two-speed economy with the service sector paving the way for benign growth, while the manufacturing sector struggled.
The drag in European business activity mainly attributes to the downturn in Europe’s largest economy – Germany - where activity declined at a 3-year high pace. The worsening of euro area activity should be seen as a feature rather than a bug given the ECB’s tightening mode the last year.
The risk is that activity suddenly declines too fast. Going forward, we expect a small contraction in the euro area GDP in H2 2023, partly driven by the gloomy Chinese outlook, persisting monetary headwinds, and the recent service sector weakness signs.
The disinflationary process is underway, but not enough for the ECB to be confident to the timely return to the 2% target.
The worsened economic outlook and markets turning more dovish, we expect the ECB to deliver a 25bp hike at the September meeting, marking a peak in the deposit rate of 4.00%
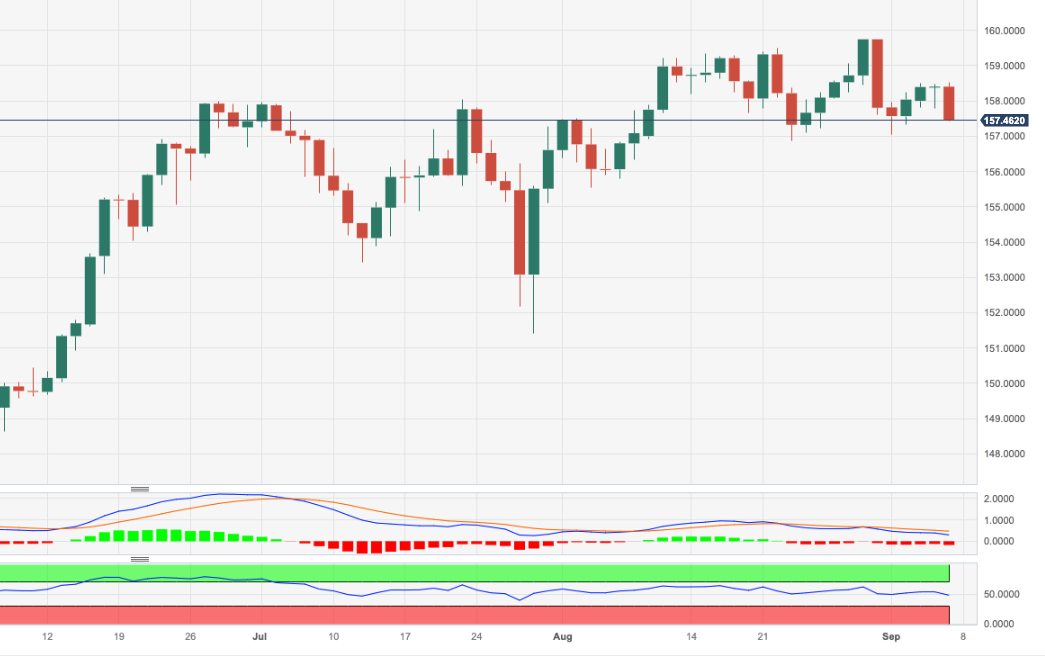
- EUR/JPY halts a three-day positive streak and drops to 157.50.
- The vicinity of 160.00 continues to cap the upside so far.
EUR/JPY comes under some marked selling pressure and recedes to the area of weekly lows in the mid-157.00s.
In the meantime, the cross could move into a consolidative phase ahead of the potential resumption of the uptrend. That said, immediate hurdle emerges at the recent 2023 peak at 159.76 (August 30) prior to the key round level at 160.00. The surpass of the latter should not see any resistance level of note until the 2008 high at 169.96 (July 23).
So far, the longer term positive outlook for the cross appears favoured while above the 200-day SMA, today at 148.33.
EUR/JPY daily chart
The US Bureau of Labor Statistics reported that Unit Labor Cost (ULC) rose 2.2% during the second quarter, a revision from the previous estimate of 1.6%. ULC rose 3.3% during the first quarter (revised from 4.2%).
Nonfarm Productivity increased 3.5%, below the 3.8% of market consensus, and revised from the 3.7% of the preliminary estimate.
Key takeaways from the report:
Unit labor costs in the nonfarm business sector increased 2.2 percent in the second quarter of 2023, reflecting a 5.7-percent increase in hourly compensation and a 3.5-percent increase in productivity. Unit labor costs increased 2.5 percent over the last four quarters.
In the second quarter of 2023, nonfarm business sector productivity increased 3.5 percent--a 0.2-percentage point downward revision from the preliminary estimate of a 3.7-percent increase--reflecting a 0.5-percentage point downward revision to output and a 0.2-percentage point downward revision to hours worked.
In the first quarter of 2023, nonfarm business sector productivity and unit labor costs were not revised. Manufacturing sector productivity was revised down 0.2 percentage point to a decrease of 2.0 percent. As a result, unit labor costs were revised up 0.2 percentage point to an increase of 2.6 percent.
Market reaction
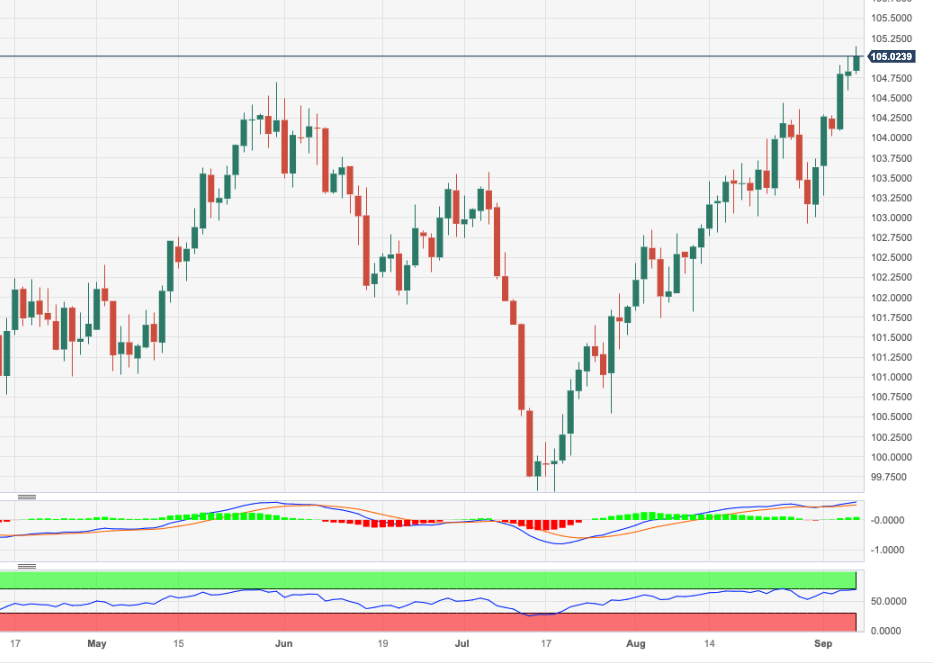
The US Dollar Index rose further above 105.00 after the release of US data that also included the weekly Jobless Claims report.
- Initial Jobless Claims in the US decreased by 13,000 in the week ending September 2.
- US Dollar Index climbed to fresh multi-month highs above 105.00 after the data.
There were 216,000 initial jobless claims in the week ending September 2, the weekly data published by the US Department of Labor (DOL) showed on Thursday. This print followed the previous week's print of 229,000 (revised from 228,000) and came better than the market expectation of 234,000.
Further details of the publication revealed that the advance seasonally adjusted insured unemployment rate edged lower to 1.1% from 1.2% and the 4-week moving average stood at 229,250, a decrease of 8,500 from the previous week's revised average.
"The advance number for seasonally adjusted insured unemployment during the week ending August 26 was 1,679,000, a decrease of 40,000 from the previous week's revised level," the publication further read.
Market reaction
The US Dollar Index continues to push higher after this data and was last seen trading at its highest level since early March at 105.12, rising 0.27% on a daily basis.
- USD/CHF stabilized above 0.8900 due to the strength of the US Dollar.
- European and Asian economies are struggling to sustain economic prospects due to stubborn inflation and higher interest rates.
- The Swiss economy remained stagnant in Q2 while investors anticipated a growth rate of 0.1%.
The USD/CHF pair shifted auction above the round-level resistance of 0.8900 on Thursday, inspired by strength in the US Dollar. The Swiss Franc asset is expected to extend upside as the US Dollar remains resilient due to the risk-off market mood.
S&P500 futures generated significant losses, carry forwarded sell-off propelled on Wednesday due to outperforming service sector. US ISM reported that Services PMI jumped significantly to 54.5 vs. expectations of 52.5 and July’s reading of 52.7. Also, the New Orders Index soared to 57.5 against the former reading of 55.0, which indicates an upbeat demand outlook.
The US Dollar Index (DXY) aims to climb above the crucial resistance of 105.00 as investors continue to pump money due to deepening global uncertainties. European and Asian economies are struggling to sustain economic prospects due to stubborn inflation and higher interest rates by their respective central banks.
Going forward, investors will focus on the April-June quarter Unit Labor Costs data. The economic data is seen unchanged at 1.6%. Stable wage growth would allow the Federal Reserve (Fed) to keep interest rates higher for a longer period. Currently, investors hope that the Fed is done with hiking interest rates due to cooling inflation and higher Unemployment Rate. Apart from the Q2 Unit Labor Costs, commentaries from various Fed policymakers are due, which will bring action to the US Dollar.
On the Swiss Franc front, the currency remained in action due to the release of the Swiss Gross Domestic Product (GDP) data for the April-June quarter. The Swiss economy remained stagnant in Q2 while investors anticipated a growth rate of 0.1%. In the January-March quarter, the Swiss economy grew by 0.3%.
UOB Group’s Senior Economist Julia Goh and Economist Loke Siew Ting assess the latest publication of inflation figures in the Philippines.
Key Takeaways
The Philippines’ headline inflation reverted higher to 5.3% y/y in Aug after easing for six straight months to 4.7% y/y in Jul. The reading defied our expectation of a slowdown to 4.6% and Bloomberg consensus of a steady rate at 4.7%. This outturn was particularly due to a sharp jump in prices of food and fuels following the transitory effects of two super typhoons (Egay and Falcon) striking the country last month. Costlier recreation, sports & culture related goods and secondary education services also contributed to the acceleration in Aug’s headline inflation.
New circumstances such as the event of super typhoons, a further acceleration in global oil price above USD90/bbl, and emerging staple food supply shocks have posed a material change in the near-term inflation trajectory. This is in addition to lingering concerns about additional transport fare hikes, higherthan-expected minimum wage adjustments in other regions, and possible knock-on effects of higher toll rates on prices of key agricultural goods on the local front. Hence, we revise our full-year inflation forecasts back to our initial projections made in Feb, at 6.0% for 2023 (from 5.3% previously, BSP est: 5.6%, 2022: 5.8%) and 3.5% for 2024 (from 2.5% previously, BSP est: 3.3%). This upward revision also pushes back our earlier expectation of inflation returning to BSP’s 2.0%-4.0% medium target range to 1Q24 from 4Q23.
- The US Dollar keeps pressing after upbeat ISM data on Wednesday.
- Surprise rate cuts out of Poland make the ECB, BoE weaker against Fed.
- The US Dollar Index breaks above 105 but takes a small step back on Thursday.
The US Dollar (USD) has another go on Wednesday as markets tremble and crack in every pillar. The bond market sees its yields surge again, with the US 10-year yield on a trajectory to break the monthly high at 4.36%.
Equites took a short nosedive move on Wednesday with the S&P 500 breaking below the 55-day Simple Moving Average (SMA). With the surprise 0.75% rate cut from the Polish Central Bank, analysts are further increasing the rate divergence trade where US rates will remain elevated for longer and Europe, the United Kingdom and Central European countries will have to cut quicker and more aggressively in order to avoid a crashing economy.
While the macroeconomic data points from Wednesday were key and pivotal, there is nothing really important to expect this Thursday. Possibly the Initial and Continuing Jobless Claims might be worth watching in case there is a sudden uptick. Instead, gear up for the afternoon with no less than five US Federal Reserve speakers that might move the needle on making an end to this Indian Summer rally in the US Dollar Index.
Daily digest: US Dollar faces Fed speech
- Around 12:30 GMT, the data calendar for the US kicks off with the Weekly Initial and Continuing Jobless Claims. Expectations are for the Initial claims to jump from 228,000 to 234,000. The Continuing segment is expected to decline from 1,725,000 to 1,715,000.
- At that same time, the Nonfarm Productivity number for Q2 will be published. Expectations are for a small increase from 3.7% to 3.8%. The Unit Labor Costs are not expected to rise any further and should remain steady at 1.6%.
- A chunky batch of US Federal Reserve speakers: Patrick Harkers from Philadelphia is to kick off the headlines at 14:00 GMT. Next Fed member Austan Gooldsbee from Chicago will speak at 15:45 GMT. At 19:30 GMT, John Williams from New York will speak together with Raphael Bostic from Atlanta. Michelle Bowman will deliver the last remarks from Fed members this Thursday around 20:55 GMT.
- Equities in Asia are taking over the negative mood in which the US closed on Wednesday: The Hang Seng Index has fallen over 1% near its closing bell on Thursday. Meanwhile, European equities are firmly in the red but containing losses.
- The CME Group FedWatch Tool shows that markets are pricing in a 93% chance that the Federal Reserve will keep interest rates unchanged at its meeting in September.
- The benchmark 10-year US Treasury bond yield trades at 4.29% and keeps heading higher after the US Treasury issued quite a lot of debt paper on Tuesday. The auctions flooded the markets with supply and saw yields ramping up.
US Dollar Index technical analysis: shifting reality
Taking a step back to the recent turn of events, it becomes clear that this week has already been a seismic shift from this year’s monetary policy for several big central banks. The clear shift in stance can be witnessed with the US Federal Reserve and the Bank Of Canada sticking to the higher for longer timeline concerning interest rates, while Poland and the European Central Bank are seeing EU data signaling distress. This only adds to more fuel in the rate divergence between the two big geographical blocks. Expect to see more gains in the US Dollar Index (DXY) in the fall once the ECB and other Central-European countries start to cut, while the Fed keeps rates steady throughout 2023.
All eyes stay on 105.00 after the DXY briefly broke the level on Wednesday. Only a few cents to go and the DXY will be at a new six-month high. The next levels are at 105.88, the high of March 2023, which would make a new yearly high. If the index reaches this last level, some resistance might kick in.
On the downside, the 104.30 figure is vital to keep the US Dollar Index sustained at these elevated levels. Some room lower, the 200-day Simple Moving Average (SMA) at 103.06 comes into play, which could bring substantially more weakness once the DXY starts trading below it. The double belt of support at 102.42, with both the 100-day and the 55-day SMA, are the last lines of defence before the US Dollar sees substantial and longer-term depreciation.
US Dollar FAQs
What is the US Dollar?
The US Dollar (USD) is the official currency of the United States of America, and the ‘de facto’ currency of a significant number of other countries where it is found in circulation alongside local notes. It is the most heavily traded currency in the world, accounting for over 88% of all global foreign exchange turnover, or an average of $6.6 trillion in transactions per day, according to data from 2022.
Following the second world war, the USD took over from the British Pound as the world’s reserve currency. For most of its history, the US Dollar was backed by Gold, until the Bretton Woods Agreement in 1971 when the Gold Standard went away.
How do the decisions of the Federal Reserve impact the US Dollar?
The most important single factor impacting on the value of the US Dollar is monetary policy, which is shaped by the Federal Reserve (Fed). The Fed has two mandates: to achieve price stability (control inflation) and foster full employment. Its primary tool to achieve these two goals is by adjusting interest rates.
When prices are rising too quickly and inflation is above the Fed’s 2% target, the Fed will raise rates, which helps the USD value. When inflation falls below 2% or the Unemployment Rate is too high, the Fed may lower interest rates, which weighs on the Greenback.
What is Quantitative Easing and how does it influence the US Dollar?
In extreme situations, the Federal Reserve can also print more Dollars and enact quantitative easing (QE). QE is the process by which the Fed substantially increases the flow of credit in a stuck financial system.
It is a non-standard policy measure used when credit has dried up because banks will not lend to each other (out of the fear of counterparty default). It is a last resort when simply lowering interest rates is unlikely to achieve the necessary result. It was the Fed’s weapon of choice to combat the credit crunch that occurred during the Great Financial Crisis in 2008. It involves the Fed printing more Dollars and using them to buy US government bonds predominantly from financial institutions. QE usually leads to a weaker US Dollar.
What is Quantitative Tightening and how does it influence the US Dollar?
Quantitative tightening (QT) is the reverse process whereby the Federal Reserve stops buying bonds from financial institutions and does not reinvest the principal from the bonds it holds maturing in new purchases. It is usually positive for the US Dollar.
- Natural Gas is in the green on Thursday, putting an end to this week's decline.
- The US Dollar strengthens as a substantial monetary shift unfolds in Western and Central Europe.
- Natural gas price could extend upward momentum after support at $2.71 triggered a bounce.
Natural Gas price is trying to push up after its steady three-day decline this week, with benchmark futures rising 2.7% on Thursday. Traders are in the dark on what the current situation is in Australia at Chevron’s LNG facilities. Union representatives are holding discussions on whether to delay partial strike actions by another day later this Thursday. Any headline around that might turn into a headwind (or tailwind) and send Natural Gas futures substantially higher or lower.
Meanwhile, the US Dollar is gaining strength as it turns its summer rally into an extended one. A surprise 0.75% rate cut from the Polish central bank is a telling sign of the monetary policy divergence between the United States and the European bloc. Whereas recent economic US data confirmed good health, data out of the Eurozone and several Central European countries signals distress and an increased chance of a hard landing, forcing local central banks to start cutting interest rates quicker than expected. These moves depreciate local currencies against the Greenback.
At the time of writing, Natural Gas is trading at $2.746 per MMBtu.
Natural Gas news and market movers
- Another sharp drop in Russian gas flows to Europe keeps market supply very tight.
- The elevated level of gas storages in Europe remains a headwind for Natural Gas prices, head of gas and power at Trafigura Richard Holtum said during a Gastech conference in Singapore earlier this Thursday. Holtum said that both the European and global LNG markets have lost flexibility, which means prices are very receptive for sudden and violent price spikes in case of sudden hiccups or shortages caused by either unforeseen bigger demand or supply reductions.
- A Bloomberg analyst report mentioned that China will be jacking up its demand for LNG as it will ramp up its reserves for the winter. The report also mentioned that the country might take in more stockpiles, taking advantage of the current favorable prices in Gas futures and the better-than-expected growth projections.
- In the US, the weekly numbers from the Energy Information Administration (EIA) are due at 14:30 GMT for the Natural Gas Storage Changes. Expectations are for an increase from 32 billion cubic feet to 43 billion cubic feet. The range is for 33 as the lowest and 47 for the highest. Should the number be below 33, expect a firm squeeze higher in Natural Gas prices, where a jump above 47 will likely cause a severe downturn.
Natural Gas Technical Analysis: bounce needs to break higher
Natural Gas is erasing this week all the gains from the previous one. Some support is coming in in the form of the 55-day Simple Moving Average (SMA), which caught the break lower on Wednesday and has been triggering a bounce. In order to confirm the bounce, the high of Wednesday needs to be broken for this turnaround to be viable.
On the upside, $2.83 needs to be taken out in order for this bounce to gain momentum. Once this rebound materialises, look for the the 200-day Simple Moving Average (SMA) near $2.96. In case price starts to break above there and head higher, $3 will be crucial with the high of September at stake.
On the downside, the trend channel has done a massive job underpinning the price action. The 55-day SMA already provided support ahead of any test on the lower end of the trend channel. In case the 55-day SMA breaks, look for support near $2.65.
-638296774371945314.png)
XNG/USD (Daily Chart)
Natural Gas FAQs
What fundamental factors drive the price of Natural Gas?
Supply and demand dynamics are a key factor influencing Natural Gas prices, and are themselves influenced by global economic growth, industrial activity, population growth, production levels, and inventories. The weather impacts Natural Gas prices because more Gas is used during cold winters and hot summers for heating and cooling. Competition from other energy sources impacts prices as consumers may switch to cheaper sources. Geopolitical events are factors as exemplified by the war in Ukraine. Government policies relating to extraction, transportation, and environmental issues also impact prices.
What are the main macroeconomic releases that impact on Natural Gas Prices?
The main economic release influencing Natural Gas prices is the weekly inventory bulletin from the Energy Information Administration (EIA), a US government agency that produces US gas market data. The EIA Gas bulletin usually comes out on Thursday at 14:30 GMT, a day after the EIA publishes its weekly Oil bulletin. Economic data from large consumers of Natural Gas can impact supply and demand, the largest of which include China, Germany and Japan. Natural Gas is primarily priced and traded in US Dollars, thus economic releases impacting the US Dollar are also factors.
How does the US Dollar influence Natural Gas prices?
The US Dollar is the world’s reserve currency and most commodities, including Natural Gas are priced and traded on international markets in US Dollars. As such, the value of the US Dollar is a factor in the price of Natural Gas, because if the Dollar strengthens it means less Dollars are required to buy the same volume of Gas (the price falls), and vice versa if USD strengthens.
- AUD/USD defends the 0.6360 support as China opens for business with Australia.
- The market mood remains cautious as global economies have been exposed to economic turmoil.
- The resilient US service sector indicates a stable consumer spending momentum that might make inflation more stubborn.
The AUD/USD pair attempts recovery after defending the crucial support of 0.6360 after China’s Premier Li Qiang cited that the economy is willing to work with Australia to jointly safeguard peace, and stability in Asia-Pacific. Opening of the Chinese economy to Australia will provide it with a larger market to expand operations.
S&P500 futures demonstrate some losses generated in Europe, portraying a risk-off market mood. US equities were heavily sold on Wednesday after upbeat ISM Services PMI indicates that the Federal Reserve (Fed) is expected to keep interest rates higher for a very long period. In spite of US economic resilience, the Fed is widely expected to keep the monetary policy unchanged for the remaining year.
As per the CME Group’s FedWatch Tool, traders see a 93% chance for interest rates to remain unchanged at 5.25%-5.50% in the September policy meeting.
The US Dollar Index (DXY) trades inside Wednesday’s range but is expected to deliver more gains amid a dampened market mood. Investors are funding into the US Dollar to avoid risks of global economic turmoil. The US service sector which accounts for two-thirds of the economy turned out resilient, which indicates a stable consumer spending momentum that might make inflation more stubborn.
Meanwhile, investors await the April-June quarter Unit Labor Costs data, which will provide more clarity about wage growth. The economic data is seen unchanged at 1.6%. Apart from that, commentaries from Fed policymakers are also due.
The Australian Dollar remains in the spotlight this week as the Reserve Bank of Australia (RBA) keeps its Official Cash Rate (OCR) unchanged at 4.10%. Also, the Australian growth rate in Q2 remained better than expectations. The economy grew at a steady pace of 0.4%, a higher-than-expected growth rate of 0.3%. On an annualized basis, Q2 GDP dropped to 2.1% from the Q1 growth rate of 2.4% but remained higher than expectations of 1.7%.
Economist Lee Sue Ann at UOB Group reviews the latest GDP figures in Australia.
Key Takeaways
Australia’s GDP came in at 0.4% q/q in 2Q23, in line with expectations. This marked the seventh consecutive rise in quarterly GDP. From a year earlier, the economy expanded by 2.1% y/y, above expectations of 1.8% y/y.
The latest GDP print remains in line with our view of growth turning softer. We continue to expect growth to be well below trend at 1.6% in 2023 and 1.2% in 2024. As the economy slows, softening labour demand should see the unemployment rate rise back to 3.8% by end-2023 and around 4.5% by end2024.
Today’s GDP data comes a day after the Reserve Bank of Australia (RBA) held its cash rate target steady at 4.10% for the third consecutive time. Our view remains for the RBA to keep policy unchanged at the next meeting on 3 Oct.
- Gold price stabilizes near a six-day low as the appeal for the US Dollar strengthens.
- The US economy remains resilient while other nations are going through the consequences of restrictive monetary policy.
- Strong demand for the US service sector could allow the Fed to keep doors open for further policy tightening.
Gold price (XAU/USD) consolidates near a six-day low and remains exposed to more falls as investors keep funding the US Dollar due to an infirm global economy. The precious metal fails to capitalize on a widely anticipated unchanged interest rate decision by the Federal Reserve (Fed), which will be announced on September 20. Meanwhile, investors await Q2 US Unit Labor Costs data, which will be published at 12:30 GMT.
With economies like the UK and the Eurozone struggling due to tight monetary policy and high inflationary pressures and China facing deflation risks, the US economy remains resilient. The US economy is expected to avoid recession as inflation starts cooling due to the strict interest rate policy by the Fed, while job growth and consumer spending remain broadly stable.
Daily Digest Market Movers: Gold price edges lower as US economy remains resilient
- Gold price hovers near a six-day low below $1,920.00 as the US Dollar remains resilient due to deepening fears of a slowdown in the global economy.
- The precious metal faces selling pressure as the US gains traction on further data showing a resilient economy. The Institute for Supply Management (ISM) agency reported better-than-anticipated Services PMI data for August.
- The ISM Services PMI landed at 54.5 against expectations of 52.5 and July’s reading of 52.7. As the sector accounts for two-thirds of the economy, the data points to continued strength in the US economic prospects and strong consumer spending.
- Also, the New Orders Index of the Services PMI rose significantly to 57.5 against the 55.0 figure recorded in July, indicating that the demand outlook for the services sector is upbeat.
- Strong demand for services recede fears of a recession in the US economy but it could also contribute to raising consumer inflation expectations. This would allow the Federal Reserve to keep the door open for further policy tightening.
- While the Fed’s Beige Book released on Wednesday reported that the economy grew at a modest pace in the last few weeks, inflationary pressures abated and labor growth remained subdued.
- As per the CME Group’s FedWatch Tool, traders see a 93% chance for interest rates to remain unchanged at 5.25%-5.50% in the September policy meeting. Also, the chances that the central will keep the current monetary policy unchanged for the remainder of the year are stable at around 53%.
- About the interest rate outlook, Boston Fed President Susan Collins said that further action will be based on incoming data. Collins expects a slowdown in the coming months and said that the central bank is far from containing inflation.
- Analysts at Goldman Sachs see a 15% chance that the US economy will slide into a recession as inflation cools down and job growth remains solid. Earlier, expectations of a recession in the US economy were at 20%.
- The US Dollar looks ready to surpass the immediate resistance level of 105.00, capitalizing on fading recession fears in the US economy while other nations are exposed to recession.
- In the Eurozone, the S&P Global Composite PMI dropped to 46.7 in August, the lowest figure since November 2020. Also, the UK Composite PMI dropped to 48.6 in August, the lowest since January. Meanwhile, China continues to face deflation risks due to deteriorating demand.
- Investors shift their focus towards the April-June quarter Unit Labor Costs data, which will be published at 12:30 GMT. Labor costs are expected to have increased by 1.6%, the same pace as in the first quarter. A higher-than-expected reading would demonstrate decent wage growth, which would elevate inflationary pressures.
- Speeches from Fed policymakers are also due: Chicago Fed Bank President Austan Goolsbee, New York Fed Bank President John C. Williams and Atlanta Fed Bank President Raphael Bostic are set to speak.
- On Wednesday, the US Senate confirmed Philip Jefferson as vice chair of the Fed, while Fed Governor Lisa Cook was also confirmed to a fresh 14-year term.
- Market sentiment remains downbeat as China’s exports contracted significantly in August, signaling further vulnerability in the Chinese economy.
Technical Analysis: Gold price stabilizes below $1,920
Gold price consolidates below the crucial support of $1,920.00 amid resilience in the US Dollar due to downbeat market sentiment. The precious metal remains under pressure after failing to sustain above the 20-day and 50-day Exponential Moving Averages (EMAs). The yellow metal is declining toward the 200-day EMA, which trades around $1,910.00. Momentum oscillators indicate a lackluster performance ahead amid uncertainty about the interest rate outlook.
Fed FAQs
What does the Federal Reserve do, how does it impact the US Dollar?
Monetary policy in the US is shaped by the Federal Reserve (Fed). The Fed has two mandates: to achieve price stability and foster full employment. Its primary tool to achieve these goals is by adjusting interest rates.
When prices are rising too quickly and inflation is above the Fed’s 2% target, it raises interest rates, increasing borrowing costs throughout the economy. This results in a stronger US Dollar (USD) as it makes the US a more attractive place for international investors to park their money.
When inflation falls below 2% or the Unemployment Rate is too high, the Fed may lower interest rates to encourage borrowing, which weighs on the Greenback.
How often does the Fed hold monetary policy meetings?
The Federal Reserve (Fed) holds eight policy meetings a year, where the Federal Open Market Committee (FOMC) assesses economic conditions and makes monetary policy decisions.
The FOMC is attended by twelve Fed officials – the seven members of the Board of Governors, the president of the Federal Reserve Bank of New York, and four of the remaining eleven regional Reserve Bank presidents, who serve one-year terms on a rotating basis.
What is Quantitative Easing (QE) and how does it impact USD?
In extreme situations, the Federal Reserve may resort to a policy named Quantitative Easing (QE). QE is the process by which the Fed substantially increases the flow of credit in a stuck financial system.
It is a non-standard policy measure used during crises or when inflation is extremely low. It was the Fed’s weapon of choice during the Great Financial Crisis in 2008. It involves the Fed printing more Dollars and using them to buy high grade bonds from financial institutions. QE usually weakens the US Dollar.
What is Quantitative Tightening (QT) and how does it impact the US Dollar?
Quantitative tightening (QT) is the reverse process of QE, whereby the Federal Reserve stops buying bonds from financial institutions and does not reinvest the principal from the bonds it holds maturing, to purchase new bonds. It is usually positive for the value of the US Dollar.
Further advance could see USD/CNH testing the 7.3500 zone in the short-term horizon according to Economist Lee Sue Ann and Markets Strategist Quek Ser Leang at UOB Group.
Key Quotes
24-hour view: Yesterday, we held the view that USD “is likely to rise further even though it is unlikely to reach 7.3500.” We indicated that “there is another resistance at 7.3300.” USD did not rise much further as it rose to 7.3278, dropped to 7.3000, and then closed at 7.3198 (+0.19%). While there is no further improvement in momentum, we continue to expect USD to rise further. However, 7.3500 is still likely out of reach today. On the downside, if USD breaks below 7.3050, it would indicate that the current upward pressure has faded.
Next 1-3 weeks: We maintain our view from yesterday (06 Sep, spot at 7.3100), wherein the risk for USD has shifted to the upside towards 7.3500. The upside risk is intact as long as USD stays above 7.2800.
Considering advanced prints from CME Group for natural gas futures markets, open interest increased for the second session in a row on Wednesday, this time by around 14.8K contracts. On the other hand, volume remained choppy and dropped by nearly 85K contracts.
Natural Gas seems supported around $2.50
Prices of natural gas retreated for the fourth session in a row on Wednesday, this time revisiting the $2.50 region amidst rising open interest, which is indicative that further gains appear on the cards in the very near term. In the meantime, the provisional 100-day SMA around $2.50 per MMBtu appears as a decent contention for the time being.
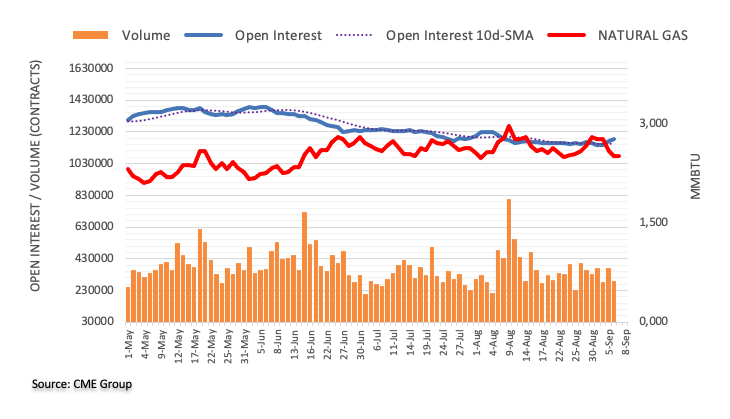
- USD/JPY extends losses on the chatter surrounding stimulus measures by the Japanese government.
- Momentum indicators suggest a favorable trend in the pair's price movement over the short-term period.
- The 147.50 psychological level acts as the immediate resistance, lined up with the weekly high.
USD/JPY extends its losses on the second day, trading around 147.40 below the Year-To-Date (YTD) high during the European session on Thursday. The pair experienced downward pressure after the moderate economic data from the United States (US).
Additionally, Kyodo News citing anonymous sources, the Japanese government is reportedly planning to introduce new economic stimulus measures in October. The primary objectives of these stimulus measures, as mentioned in the news, are to provide support for companies to increase wages and reduce energy costs.
The Moving Average Convergence Divergence (MACD) line stays above the centerline and lies above the signal line. This suggests that the recent momentum is relatively stronger.
The 147.50 psychological level acts as the immediate barrier, followed by the weekly high at 147.87. A break above the latter could support the USD/JPY pair to explore the region around the 148.00 level.
On the downside, the 14-day Exponential Moving Average (EMA) at 146.37 emerges as the key support, following the 21-day EMA at 145.81 aligned to the 23.6% Fibonacci retracement at 145.37 level.
In the short term, the USD/JPY pair remains to be bullish as long as the 14-day Relative Strength Index (RSI) stays above 50.
USD/JPY: Daily Chart
- The Eurozone economy expanded 0.1% in the second quarter.
- EUR/USD attacks 1.0700 on the downbeat Eurozone GDP data.
The Eurozone economy expanded less than expected in the second quarter of 2023, the final estimate published by Eurostat confirmed on Thursday.
The Gross Domestic Product (GDP) in the old continent expanded by 0.1% in the quarter to June of this year when compared to the previous quarter. The preliminary figure showed a 0.3% growth during the reported period. The market estimated a 0.3% figure.
On an annual basis, the bloc’s GDP grew 0.5%, down from the 0.6% expansion initially estimated while below the market expectation of a 0.6% increase.
Eurozone’s Final Employment Change came in at 0.2% and 1.3% on a quarterly and yearly basis respectively.
Market reaction
The Euro is seeing additional selling pressure after the discouraging Eurozone data, with EUR/USD losing 0.14% on the day to trade at 1.0709.
The continuation of the upside momentum could encourage USD/JPY to revisit the 149.00 level in the next few weeks, argue Economist Lee Sue Ann and Markets Strategist Quek Ser Leang at UOB Group.
Key Quotes
24-hour view: We highlighted yesterday that USD “is likely to strengthen further, but it is unlikely to reach 149.00.” We also highlighted that “in order to keep the momentum going, USD must stay above 147.00.” USD did not strengthen further as it traded between 147.00 and 147.81 before ending the day largely unchanged at 147.65 (-0.04%). Despite the relatively stable price action, there appears to be enough momentum to carry USD higher to 148.30. The 149.00 level is still likely out of reach. On the downside, if USD breaks below 147.15 (minor support is at 147.45), it would mean that USD is not strengthening further.
Next 1-3 weeks: We continue to hold the same view as yesterday (06 Sep, spot at 147.70), wherein USD is likely to rise further, probably to 149.00. In order to maintain the rapid buildup in momentum, USD must stay above 146.70 (‘strong support’ level was at 146.45 yesterday).
Analysts at Danske Bank provide a brief overview of Wednesday's release of the US ISM Services PMI, which showed that business activity unexpectedly picked up last month and raised hopes for a soft landing.
Key Quotes:
“Stronger-than-expected ISM services for August reaffirmed the US outperformance narrative, adding broad support to the USD. US ISM services for August printed at 54.5, the highest reading since February with business activity, price pressures and employment growth picking up. Consensus was anticipating ISM Services to signal weakening growth, but the surprising pick-up was broad-based across different sub-indices, with both current and future activity indicators signalling accelerating growth. Markets reacted by sending 2-year US Treasury yield 4-5bp higher and US stocks lower. While we highlight the volatility in ISM figures, we note that it is a clear signal that the US is not on the brink of a recession at least for now.”
According to the latest survey conducted by the Bank of England (BoE) Monthly Decision Maker Panel (DMP) on Thursday, the UK businesses reported year-ahead Consumer Price Index (CPI) inflation sharply lower at 4.8/% in August vs. 5.4% projected in July.
Additional findings
UK businesses see year-ahead output price inflation at 4.9% in 3 months to Aug, down 0.5 percentage points vs 3 months to July.
UK businesses see Aug 3-year-ahead CPI at 3.2% vs July 3.3%.
UK businesses see Aug year-ahead wage growth at 5.0% vs July 5.0%
Market reaction
GBP/USD remains pressured below 1.2500, last seen trading at 1.2467, down 0.30% on the day.
Dr Ralph Solveen, Senior Economist at Commerzbank, offers a brief review of the German macro data released this Thursday, which showed that Industrial Production fell more than anticipated in July and pointed to further weakness in the country’s manufacturing sector.
Key Quotes:
“A closer look at the sectors shows that the decline affected all manufacturing groups. The automotive sector stands out, with output falling by almost 10%. By comparison, the decline in the energy-intensive sectors was very moderate at 0.6%. However, there are no signs that lower energy prices compared to last autumn could spur a recovery here either. On the negative side, output is now also falling in the other sectors. Although output there fell by only 0.4% on average in July. However, this was the third decline in a row for this sub-group, which means that the trend here is also down.”
“Given the weakness in new orders, a further decline is likely in the coming months. The hope in many forecasts that high order backlogs would stabilise production is unlikely to materialise. The results of the Ifo survey show that a clear majority of companies no longer regard their order books as large, but as too small. Given the collapse in new orders, construction output is also likely to fall sharply in the coming months. There is therefore much to suggest that the German economy will contract again in the second half of the year.”
- USD/CAD regains positive traction on Thursday and is supported by a bullish USD.
- The prospects for more Fed rate hikes and a softer risk tone benefit the Greenback.
- Retreating Oil prices undermines the Loonie and supports prospects for further gains.
The USD/CAD pair attracts some dip-buying on Thursday and stalls the previous day's modest pullback from the 1.3675 region, or its highest level since March 28. Spot prices, however, struggle to capitalize on the modest intraday uptick and currently trade around mid-1.3600s during the early part of the European session, up less than 0.10% for the day.
The near-term bias, meanwhile, seems tilted firmly in favour of bullish traders and suggests that the path of least resistance for the USD/CAD pair is to the upside. The US Dollar (USD) stands tall near a six-month peak touched on Wednesday and remains well supported by the prospects for further policy tightening by the Federal Reserve (Fed). In fact, the markets are now pricing in a nearly 50% chance of another 25 bps Fed rate hike move in November and the bets were lifted by the upbeat US ISM Services PMI, which rose to 54.5 last month – the highest reading since February.
Additional details of showed a rise in new orders, pointing to a resilient US economy, while higher Prices Paid sub-component was seen as potential signs of still-elevated inflationary pressures, which should allow the Fed to stick to its hawkish stance. The outlook, meanwhile, allows the yield on the benchmark 10-year US government bond to hold steady just below its highest level since 2008 touched in August. Apart from this, a generally weaker tone around the equity markets, weighed down by China's economic woes, further benefits the Greenback's relative safe-haven status.
This, along with a modest pullback in Crude Oil prices, which tends to undermine the commodity-linked Loonie, validates the near-term positive outlook for the USD/CAD pair. Meanwhile, the Bank of Canada (BoC) signalled on Wednesday that it could raise borrowing costs again to combat inflation. Market participants, however, seem convinced that the BoC will be relatively quick to cut rates in the wake of signs that the Canadian economy is cooling rapidly. This could dent demand for the Canadian Dollar (CAD) and support prospects for a further appreciating move for the major.
Market participants now look to the release of the Weekly Initial Jobless Claims data from the US, which will be followed by the Canadian Ivey PMI later during the early North American session. Traders will further take cues from speeches by FOMC members, which, along with the US bond yields and the broader risk sentiment, will drive the USD demand. Apart from this, Oil price dynamics should contribute to producing short-term trading opportunities around the USD/CAD pair.
Technical levels to watch
- WTI prices trade lower ahead of the EIA Crude Oil stockpiles report.
- API US crude oil inventories declined notably higher than expectations.
- Saudi Arabia's crude output will be closer to 9 million (bpd) through the year 2023.
- China’s gloomy economic situation could limit the upside potential of black gold.
Western Texas Intermediate (WTI), the US crude oil benchmark, snaps a two-day winning streak. Spot price trades lower around $87.20 during the early trading hours in the European session on Thursday. The Crude oil prices experienced upward support due to further decline in US crude oil stock and the supply cut by OPEC+.
Data from the American Petroleum Institute (API) indicates that US crude oil inventories declined by 5.521 million barrels, notably higher than the expectations of a 1.429M decline. The previous week's decline was 11.486 million barrels.
In addition, Saudi Arabia and Russia, two of the world's largest oil-exporting countries, have announced their intention to extend oil production cuts for the entirety of 2023. These measures have bolstered the prices of black gold. It's important to note that this production cut will bring Saudi Arabia's crude output closer to 9 million barrels per day (bpd) for the upcoming months through the year 2023, and it will undergo monthly reviews.
Russia's Deputy Prime Minister, Alexander Novak, has also disclosed that Russia plans to reduce its oil exports by 300,000 barrels per day throughout the remainder of 2023.
Investor confidence continues to be restrained due to ongoing concerns about the worsening economic situation in China and the persistent trade tensions between China and the United States (US) following US Commerce Secretary Gina Raimondo’s statement of anticipating no revisions to the US tariffs.
These risks related to China's economic condition and trade dynamics could limit the potential upside for oil prices, as China holds the position of being the world's largest consumer of oil.
Additionally, the hawkish tone surrounding the US Federal Reserve (Fed) could provide support in undermining the price of the liquid gold. Market participants expect the Fed to maintain interest rates at a higher level for an extended period along with the odds of a 25 basis points (bps) rate hike through the end of the year 2023.
Traders await the upcoming data release of the EIA Crude Oil Stocks Change for the week ending on September 1, scheduled later in the day. This data release has the potential to have a significant impact on the price of WTI crude oil. Oil traders will closely analyze this data to identify trading opportunities and make informed decisions regarding WTI trades.
- The Euro resumes the decline against the US Dollar.
- Stocks in Europe extend their weekly losses on Thursday.
- EUR/USD could visit the 1.0700 region soon.
- The USD Index (DXY) flirts with the key 105.00 zone.
- Another revision of Q2 Eurozone GDP growth rate is due.
- Usual weekly Claims and Fed speakers come next in the US docket.
The Euro (EUR) maintains its bearish stance against the US Dollar (USD) for yet another session, prompting EUR/USD to trade close to key support around the 1.0700 zone on Thursday.
On the USD-side, the Greenback trades in the area of multi-month peaks near the 105.00 hurdle when gauged by the USD Index (DXY) amidst the small knee-jerk move in yields across different maturities. These came against the backdrop of increasing speculation over rate cuts by the Federal Reserve (Fed) around March 2024 and divided opinions around a potential rate hike in November.
Back to the European Central Bank (ECB), consensus among Board members remains pretty divided regarding the interest rate decision due on September 14.
In the domestic calendar, Industrial Production in Germany contracted 0.8% on month in July, while another revision of the Gross Domestic Product (GDP) growth rate in the eurozone for the April-June period will be published later in the European morning.
In the US, all the attention will be on the usual weekly release of Initial Jobless Claims for the week ended on September 2, along with speeches by Philadelphia Fed Patrick Harker (voter, hawk), New York Fed John Williams (permanent voter, centrist), Atlanta Fed Raphael Bostic (2024 voter, hawk), and FOMC Governor Michelle Bowman (permanent voter, centrist).
Daily digest market movers: Euro looks offered amidst firm risk-off mood
- The EUR resumes the selling bias against the USD.
- US yields gives away part of the recent advance.
- Chinese trade surplus shrank in August.
- The ECB’s interest rate decision in September is a close call.
- Markets continue to price in Fed rate cuts in Q2 2024.
- The outlook for the German economy continues to worsen.
Technical Analysis: Euro risks a drop to 1.0630 zone
EUR/USD remains well under pressure near the key contention area around 1.0700. The loss of this zone could open the tap to further retracement in the short-term horizon.
If EUR/USD clears Wednesday's low of 1.0702, it could revisit the May 31 low of 1.0635 prior to the March 15 low of 1.0516. The loss of the latter could prompt a potential test of the 2023 low at 1.0481 seen on January 6.
On the upside, spot is expected to target the critical 200-day Simple Moving Average (SMA) at 1.0821. North from here, bulls should meet the the weekly top of 1.0945 (August 30), which appears reinforced by the provisional 55-day SMA at 1.0948 and comes prior to the psychological 1.1000 barrier and the August 10 top at 1.1064. Once the latter is cleared, spot could challenge the July 27 peak at 1.1149. If the pair surpasses this region, it could alleviate some of the downward pressure and potentially visit the 2023 peak of 1.1275 registered on July 18.
A sustained decline is likely in EUR/USD while it remains below the 200-day SMA.
Euro FAQs
What is the Euro?
The Euro is the currency for the 20 European Union countries that belong to the Eurozone. It is the second most heavily traded currency in the world behind the US Dollar. In 2022, it accounted for 31% of all foreign exchange transactions, with an average daily turnover of over $2.2 trillion a day.
EUR/USD is the most heavily traded currency pair in the world, accounting for an estimated 30% off all transactions, followed by EUR/JPY (4%), EUR/GBP (3%) and EUR/AUD (2%).
What is the ECB and how does it impact the Euro?
The European Central Bank (ECB) in Frankfurt, Germany, is the reserve bank for the Eurozone. The ECB sets interest rates and manages monetary policy.
The ECB’s primary mandate is to maintain price stability, which means either controlling inflation or stimulating growth. Its primary tool is the raising or lowering of interest rates. Relatively high interest rates – or the expectation of higher rates – will usually benefit the Euro and vice versa.
The ECB Governing Council makes monetary policy decisions at meetings held eight times a year. Decisions are made by heads of the Eurozone national banks and six permanent members, including the President of the ECB, Christine Lagarde.
How does inflation data impact the value of the Euro?
Eurozone inflation data, measured by the Harmonized Index of Consumer Prices (HICP), is an important econometric for the Euro. If inflation rises more than expected, especially if above the ECB’s 2% target, it obliges the ECB to raise interest rates to bring it back under control.
Relatively high interest rates compared to its counterparts will usually benefit the Euro, as it makes the region more attractive as a place for global investors to park their money.
How does economic data influence the value of the Euro?
Data releases gauge the health of the economy and can impact on the Euro. Indicators such as GDP, Manufacturing and Services PMIs, employment, and consumer sentiment surveys can all influence the direction of the single currency.
A strong economy is good for the Euro. Not only does it attract more foreign investment but it may encourage the ECB to put up interest rates, which will directly strengthen the Euro. Otherwise, if economic data is weak, the Euro is likely to fall.
Economic data for the four largest economies in the euro area (Germany, France, Italy and Spain) are especially significant, as they account for 75% of the Eurozone’s economy.
How does the Trade Balance impact the Euro?
Another significant data release for the Euro is the Trade Balance. This indicator measures the difference between what a country earns from its exports and what it spends on imports over a given period.
If a country produces highly sought after exports then its currency will gain in value purely from the extra demand created from foreign buyers seeking to purchase these goods. Therefore, a positive net Trade Balance strengthens a currency and vice versa for a negative balance.
- The Pound Sterling faces significant pressure as the BoE appears to be reluctant to raise interest rates further.
- BoE Swati Dhingra said that the current interest rate policy is sufficiently restrictive.
- The UK services sector shrinks after six months of expansion as consumer spending weakens.
The Pound Sterling (GBP) cracked significantly amid increasing risk-aversion and dovish remarks from Bank of England (BoE) Governor Andrew Bailey and policymaker Swati Dhingra about September’s monetary policy decision. The GBP/USD pair is expected to remain on tenterhooks as policy divergence between the BoE and the Federal Reserve (Fed) is likely to persist if the UK’s central bank decides to pause the policy-tightening spell.
Swati Dhingra said Wednesday that the current interest rate policy is sufficiently restrictive and further hikes in interest rates would make the economic outlook vulnerable. Fading consumer spending momentum and a deteriorating demand environment have started impacting the services sector, according to the latest survey data. The UK services PMI, which gauges business activity in the sector, pointed to a contraction in August for the first time since January.
Daily Digest Market Movers: Pound Sterling cracks as BoE casts doubts over further interest rate hikes
- The Pound Sterling oscillates below the psychological support of 1.2500 as Bank of England (BoE) Governor Andrew Bailey casts doubts over further policy tightening.
- BoE Bailey said that the central bank is closer to ending its interest-rate hiking cycle but unlikely to cut rates to ensure squeezing out inflation from the economy.
- About the inflation outlook, Bailey said that many of the indicators are moving in the right direction, signaling that the fall in inflation will continue.
- BoE policymaker Swati Dhingra, who has been voting to keep interest rates unchanged from the past few policy meetings, said that interest rates are already at high levels and that further tightening could hurt the economy.
- The Pound Sterling came under severe pressure as expectations over policy divergence between the Fed and the BoE have increased.
- The UK economy has the highest inflation rate among the G7 economies. Commentary about a steady interest rate policy could elevate consumer inflation expectations.
- The absence of more interest rate hikes might safeguard the economic outlook from further vulnerability, but it could also mean higher inflation ahead, further squeezing households’ real incomes.
- After vulnerable Manufacturing PMI data, a PMI index gauging the country’s services sector also slipped below the 50.0 threshold for the first time since January.
- It seems that the cooling effects of higher interest rates appear to be hitting spending and confidence from both households and corporations in the UK.
- Tim Moore, Economics Director at S&P Global Market Intelligence, said: "Service providers saw customer spending reverse course during August as higher borrowing costs, subdued business confidence, and stretched household finances all acted to curtail sales opportunities.
- After Andrew Bailey’s commentary on interest rates, uncertainty over the monetary policy meeting scheduled for September 21 has increased.
- The market mood remains cautious as the global economy is exposed to higher uncertainty due to rising interest rates by Western central banks.
- The appeal for the US Dollar improves further as fears of a recession in the US economy fade.
- The US service sector turned out to be more resilient than expected in August. The ISM reported that the Services PMI jumped to 54.5 against expectations of 52.5 and July’s reading of 52.7. The services sector accounts for two-thirds of the US economy, so an upbeat service sector indicates economic strength in spite of high-interest rates.
- The New Orders subindex for the services sector rose sharply to 57.5 from 55.0 in July, indicating strong consumer demand ahead, which would keep the economy resilient.
- On Wednesday, Boston Fed President Susan Collins said that further action on interest rates will be based on incoming data. Fed Collins expects a slowdown in the coming months and said that the central bank is far from containing inflation.
Technical Analysis: Pound Sterling corrects to near 200-EMA
Pound Sterling extends its two-day losing streak after dropping below Wednesday’s low of 1.2480. The Cable skids below the psychological support of 1.2500 as market sentiment remains negative and the BoE seems uncertain about further policy tightening. The asset has dropped to near the 200-day Exponential Moving Average (EMA), which trades around 1.2480. Momentum oscillators also indicate that the bearish impulse has strengthened.
Inflation FAQs
What is inflation?
Inflation measures the rise in the price of a representative basket of goods and services. Headline inflation is usually expressed as a percentage change on a month-on-month (MoM) and year-on-year (YoY) basis. Core inflation excludes more volatile elements such as food and fuel which can fluctuate because of geopolitical and seasonal factors. Core inflation is the figure economists focus on and is the level targeted by central banks, which are mandated to keep inflation at a manageable level, usually around 2%.
What is the Consumer Price Index (CPI)?
The Consumer Price Index (CPI) measures the change in prices of a basket of goods and services over a period of time. It is usually expressed as a percentage change on a month-on-month (MoM) and year-on-year (YoY) basis. Core CPI is the figure targeted by central banks as it excludes volatile food and fuel inputs. When Core CPI rises above 2% it usually results in higher interest rates and vice versa when it falls below 2%. Since higher interest rates are positive for a currency, higher inflation usually results in a stronger currency. The opposite is true when inflation falls.
What is the impact of inflation on foreign exchange?
Although it may seem counter-intuitive, high inflation in a country pushes up the value of its currency and vice versa for lower inflation. This is because the central bank will normally raise interest rates to combat the higher inflation, which attract more global capital inflows from investors looking for a lucrative place to park their money.
How does inflation influence the price of Gold?
Formerly, Gold was the asset investors turned to in times of high inflation because it preserved its value, and whilst investors will often still buy Gold for its safe-haven properties in times of extreme market turmoil, this is not the case most of the time. This is because when inflation is high, central banks will put up interest rates to combat it.
Higher interest rates are negative for Gold because they increase the opportunity-cost of holding Gold vis-a-vis an interest-bearing asset or placing the money in a cash deposit account. On the flipside, lower inflation tends to be positive for Gold as it brings interest rates down, making the bright metal a more viable investment alternative.
- USD/MXN scales higher for the sixth straight day and touches a three-month high on Thursday.
- The recent breakout through the 100-day SMA and the 17.40-45 hurdle favour bullish traders.
- The slightly overbought RSI on the daily chart is seen as the only factor capping further gains.
The USD/MXN pair gains strong positive traction for the sixth successive day on Thursday and jumps to over a three-month top during the early part of the European session. Spot prices, however, retreat a few pips in the last hour and currently trade near the 17.65 region, still up nearly 0.40% for the day.
From a technical perspective, this week's sustained move and acceptance above the 100-day Simple Moving Average (SMA), for the first time since September 2022, was seen as a fresh trigger for bullish traders. A subsequent breakout through the 17.40-17.45 strong horizontal barrier prompted some follow-through technical buying and might have already set the stage for a further near-term appreciating move.
That said, the Relative Strength Index (RSI) on the daily chart is already flashing overbought conditions and makes it prudent to wait for some near-term consolidation or a modest pullback before placing fresh bets. Nevertheless, the USD/MXN pair seems poised to build on its sharp rise witnessed over the past week or so and aim to challenge the very important 200-day SMA, currently around the 18.00 mark.
The said handle coincides with a downward sloping trend-line extending from the September 2022 swing high and should act as a key pivotal point, which if cleared decisively should pave the way for additional gains.
On the flip side, any meaningful corrective slide below the daily trough, around the 17.60-17.55 region, could be seen as a buying opportunity and remain limited near the 17.45-17.40 resistance breakpoint. This is closely followed by the 100-day SMA, around the 17.30-17.25 zone. Failure to defend the said support levels might prompt some technical selling and drag the USD/MXN pair back towards the 17.00 round figure.
USD/MXN daily chart
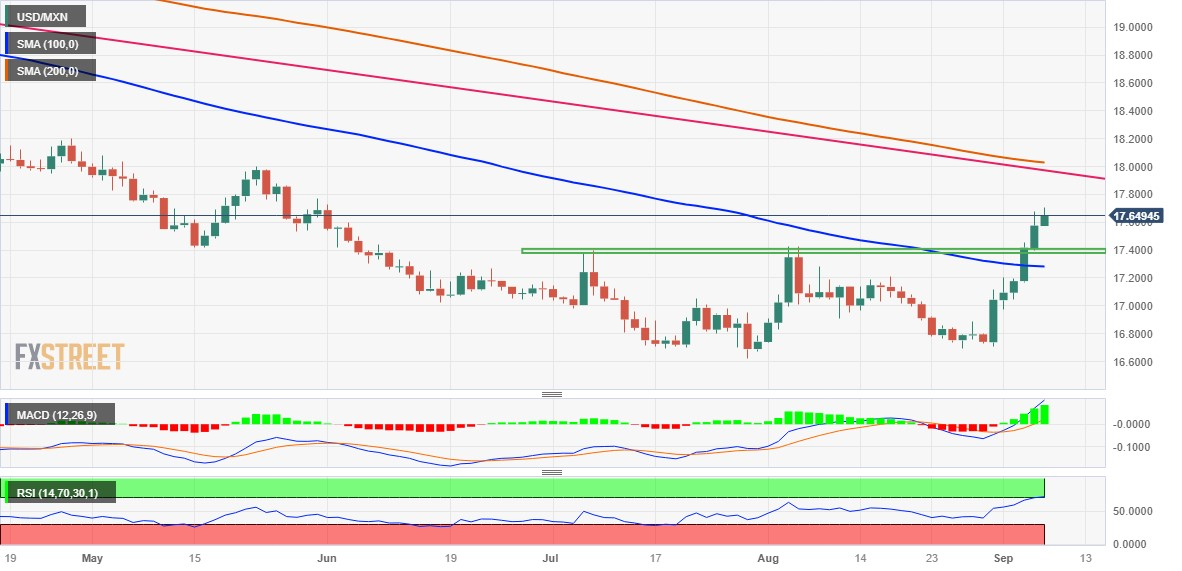
Technical levels to watch
Open interest in crude oil futures markets extended the uptrend on Wednesday, this time by more than 40K contracts according to preliminary readings from CME Group. Volume, instead, shrank markedly by around 308.3K contracts after five consecutive daily pullbacks.
WTI keeps the initial focus on $90.00
Prices of the barrel of WTI revisited the $88.00 region on Wednesday amidst decent gains. The move was on the back of increasing open interest, which hints at the idea that further gains remain on the cards and with the immediate target at the key round level at $90.00.
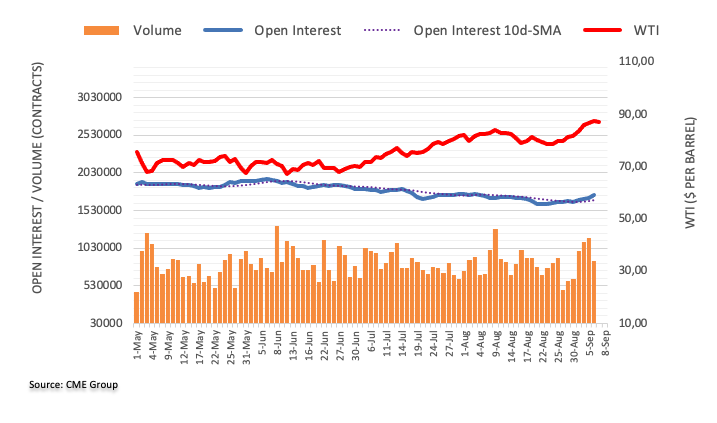
In the view of Economist Lee Sue Ann and Markets Strategist Quek Ser Leang at UOB Group, NZD/USD faces extra weakness in the next few weeks.
Key Quotes
24-hour view: We indicated yesterday that “barring a break above 0.5910, NZD could drop to 0.5840 before stabilisation is likely.” However, NZD traded in a range between 0.5860 and 0.5903. The weakness in NZD does not appear to have stabilised. We continue to hold the view that NZD could drop to 0.5840 before stabilisation is likely. Only a break above 0.5900 (minor resistance is at 0.5885) would mean that the weakness in NZD has stabilised.
Next 1-3 weeks: Our update from yesterday (06 Sep, spot at 0.5875) still stands. As highlighted, the rapid increase in momentum after the sharp drop on Tuesday is likely to lead to further NZD weakness. That said, it remains to be seen if the major support at 0.5800 is within reach this time around. The downside risk is intact as long as NZD stays below 0.5945 (no change in ‘strong resistance’ level from yesterday).
Chinese state media reported on Thursday, China’s Premier Li Qiang met with Australia's Prime Minister Anthony Albanese in Jakarta.
Following their meeting, China’s Premier Li said that “we hope Australia will adopt an objective, fair attitude towards investment and operation of Chinese firms in Australia.”
Additional comments
China will further open up and offer bigger market for countries including Australia.
Both sides should properly handle differences in spirit of mutual respect.
China willing to work with Australia to jointly safeguard peace, stability in Asia-Pacific.
China-Australia relations have continued to show positive momentum in the past year.
China will continue to expand high-level opening up to outside world and provide larger market for countries including Australia.
Market reaction
AUD/USD is holding the rebound toward 0.6400 on the renewed Sino-Australian optimism. The pair is modestly flat on the day at 0.6383, as of writing.
- The index extends the march north and targets 105.00.
- Usual weekly Initial Claims next on tap in the docket.
- Fed’s Harker, Williams, Bostic and Bowman speak later.
The USD Index (DXY), which tracks the greenback vs. a bundle of its main competitors, keeps the buying pressure well in place and approaches the 105.00 region on Thursday.
USD Index shifts the attention to Fedspeak
The index advances for the third session in a row so far on Thursday, always helped by the equally strong move higher in US yields seen in past days.
The recent price action around the dollar also comes amidst increasing market chatter surrounding the Federal Reserve and the probability that it might start cutting rates at some point in Q2 2024.
In addition, according to CME Group’s FedWatch Tool, investors see the Fed keeping rates unchanged for the remainder of the year, although a rate hike in November appears not fully ruled out in light of the persistent upside surprises in the US docket.
Later in the session, the only release of note will be the usual weekly Initial Claims seconded by speeches by Philly Fed P. Harker (voter, hawk), NY Fed J. Williams (permanent voter, centrist), Atlanta Fed R. Bostic (2024 voter, hawk) and FOMC Governor M. Bowman (permanent voter, centrist).
What to look for around USD
The recent strong recovery in the index has opened the door to a potential visit to the 105.00 region sooner rather than later.
In the meantime, support for the dollar keeps coming from the good health of the US economy, which seems to have reignited the narrative around the tighter-for-longer stance from the Federal Reserve.
Running on the opposite side of the road, the idea that the dollar could face headwinds in response to the data-dependent stance from the Fed against the current backdrop of persistent disinflation and cooling of the labour market appears to have regained some traction as of late.
Key events in the US this week: Initial Jobless Claims (Thursday) – Wholesale Inventories, Consumer Credit Change (Friday).
Eminent issues on the back boiler: Persistent debate over a soft or hard landing for the US economy. Incipient speculation of rate cuts in H1 2024. Geopolitical effervescence vs. Russia and China.
USD Index relevant levels
Now, the index is advancing 0.07% at 104.91 and faces the next up barrier at 105.02 (monthly high September 6) ahead of 105.88 (2023 high March 8) and finally 106.00 (round level). On the downside, the breach of 103.02 (200-day SMA) would open the door to 102.93 (weekly low August 30) and then 102.56 (55-day SMA).
Here is what you need to know on Thursday, September 7:
The policymaker Swati Dhingra capitalized on upbeat US data midweek, with the USD (DXY) touching its highest level since mid-March above 105.00. Early Thursday, DXY consolidates its gains as investors await weekly Initial Jobless Claims data and a revision to the second-quarter Unit Labor Costs print. Market participants will also pay close attention to comments from Federal Reserve (Fed) policymakers.
The ISM Services PMI report showed on Wednesday that the business activity in the US service sector continued to expand at an accelerating pace in August. Underlying details survey showed that employment in the sector grew at a healthy pace, while input price pressures gathered strength. The benchmark 10-year US Treasury bond yield climbed to 4.3% and provided a boost to the USD after this data as investors reassessed the possibility of the Fed raising the policy rate one more time before the end of the year.
US Dollar price this week
The table below shows the percentage change of US Dollar (USD) against listed major currencies this week. US Dollar was the strongest against the New Zealand Dollar.
| USD | EUR | GBP | CAD | AUD | JPY | NZD | CHF | |
| USD | 0.51% | 0.73% | 0.28% | 0.96% | 0.97% | 0.89% | 0.68% | |
| EUR | -0.50% | 0.22% | -0.23% | 0.47% | 0.47% | 0.38% | 0.16% | |
| GBP | -0.74% | -0.23% | -0.46% | 0.24% | 0.24% | 0.15% | -0.07% | |
| CAD | -0.29% | 0.22% | 0.45% | 0.70% | 0.68% | 0.60% | 0.40% | |
| AUD | -0.97% | -0.46% | -0.22% | -0.69% | 0.01% | -0.08% | -0.29% | |
| JPY | -0.97% | -0.47% | -0.22% | -0.72% | 0.01% | -0.09% | -0.28% | |
| NZD | -0.96% | -0.42% | -0.20% | -0.66% | 0.04% | 0.03% | -0.25% | |
| CHF | -0.67% | -0.19% | 0.05% | -0.42% | 0.30% | 0.28% | 0.24% |
The heat map shows percentage changes of major currencies against each other. The base currency is picked from the left column, while the quote currency is picked from the top row. For example, if you pick the Euro from the left column and move along the horizontal line to the Japanese Yen, the percentage change displayed in the box will represent EUR (base)/JPY (quote).
EUR/USD came within a touching distance of 1.0700 for the second day in a row on Wednesday but managed to find support. The pair was last seen moving sideways slightly above that level. Eurostat will s release revisions to second-quarter Employment Changed and Gross Domestic Product (GDP) data later in the session.
GBP/USD dropped to its lowest level since June 12 below 1.2500 on Wednesday. Although the pair recovered modestly toward the end of the day, it failed to stabilize above that level in the Asian session on Thursday. In addition to the broad-based USD strength, cautious comments from Bank of England officials caused the pair to stay under bearish pressure. While testifying before the UK Treasury Select Committee, Bank of England Governor Andrew Bailey noted that many indicators are pointing to a fall in inflation and added that they were "much nearer of peak rates." Additionally, BoE policymaker Swati Dhingra noted that the BoE's policy was already "sufficiently restrictive."
The data from China showed in the Asian session that the trade surplus narrowed to $68.36 billion in August from $80.6 billion. In the meantime, Australia's Exports declined 2% in July, while Imports rose 3%. Following Wednesday's indecisive action, AUD/USD continues to move sideways at around 0.6400 early Thursday. Outgoing Reserve Bank of Australia (RBA) Governor Philip Lowe reiterated that a tighter monetary policy would be required if inflation became sticky.
USD/CAD advanced to its highest level since March above 1.3670 but retreated below 1.3650 on Thursday. The Bank of Canada (BoC) announced on Wednesday that it left the policy rate unchanged at 5% as widely expected. BoC Governor Tiff Macklem will deliver the Economic Progress Report later in the day.
USD/JPY lost its bullish momentum and went into a consolidation phase at around 147.50. "Further tweak to YCC cannot be ruled out as option if inflation expectations heighten more, but this is not an imminent issue now," Bank of Japan (BoJ) board member Junko Nakagawa said on Thursday.
Gold price registered losses for the fifth straight day on Friday and dropped below $1,920 for the first time in September. With 10-year US yield holding steady early Thursday, XAU/USD trades in a tight channel slightly below $1,920.
- Gold Price portrays corrective bounce at one-week low amid lackluster markets.
- Broad US Dollar strength, risk aversion prod XAU/USD rebound from key support confluence.
- Hawkish Fed talks, concerns about US economic strength keep Gold sellers hopeful of breaking immediate support.
Gold Price (XAU/USD) struggles to defend the first daily gains in six at the lowest level in more than a week as market players seek additional clues to defend the previous bearish bias about the bullion. In doing so, the XAU/USD traders reassess the latest United States (US) data and Federal Reserve (Fed) clues amid hopes of witnessing a soft landing in the US despite higher rates. The same joins fears of economic slowdown in other major countries to propel the Greenback and exert downside pressure on the Gold Price.
Elsewhere, grim concerns about China, one of the world’s biggest Gold customers, join the Sino-American tussles and upbeat yields to also increase the hardships for the XAU/USD recovery.
That said, a one-week-long European Central Bank (ECB) policymakers’ blackout period and a likely improvement in the second-tier US employment clues seem to highlight today’s Fed talks as the key catalysts.
Also read: Gold Price Forecast: XAU/USD could test $1,900 if key support confluence fails
Gold Price: Key levels to watch
Our Technical Confluence indicator suggests that the Gold Price prods the lower end of the short-term trading range while fading the bearish bias after five-day losing streak. That said, the XAU/USD remains within a strong trading range between $1,935 and $1,915 despite falling in recent days.
That said, the middle band of the Bollinger on one-day joins Fibonacci 38.2% on one-month to highlight $1,915 as the key support.
On the contrary, Fibonacci 61.8% on one-month suggests the $1,935 is an important upside hurdle for the buyers.
It should be noted that the middle band of the Bollinger on four-hour (4H) joins the 50-DMA to highlight $1,930-31 as an extra filter towards the north.
In the same way, the 200-DMA joins the Pivot Point one-week S1 and Fibonacci 23.6% on one-day to signal $1,918 as immediate support.
It’s worth observing that the Fibonacci 38.2% on one-week and 161.8% on one-day also acts as an upside filter near $1,938 before directing the Gold buyers toward the $1,950 hurdle.
Meanwhile, Fibonacci 23.6% on one-month prods the XAU/USD sellers near $1,905 before directing them to the Pivot Point one-week S2 and one-month S1, around $1,895.
Here is how it looks on the tool
About Technical Confluences Detector
The TCD (Technical Confluences Detector) is a tool to locate and point out those price levels where there is a congestion of indicators, moving averages, Fibonacci levels, Pivot Points, etc. If you are a short-term trader, you will find entry points for counter-trend strategies and hunt a few points at a time. If you are a medium-to-long-term trader, this tool will allow you to know in advance the price levels where a medium-to-long-term trend may stop and rest, where to unwind positions, or where to increase your position size.
- NZD/USD struggles to recover from its lowest since November 2022.
- Fed is expected to adopt a hawkish stance; contributing to the strength of the US Dollar (USD).
- Higher US Treasury yields reinforce the Greenback’s winning streak.
- China-related concerns are weighing on the Kiwi pair.
NZD/USD trades around 0.5890 during the Asian session on Thursday, recovering from the lowest level since November 2022. However, the pair is facing downward pressure as investors price in the odds for a quarter basis points (bps) interest rate hike by the US Federal Reserve (Fed) through the end of the year 2023.
Additionally, the US Dollar (USD) is strengthening due to increasing acknowledgment that the Federal Reserve (Fed) intends to maintain higher interest rates for an extended period. This hawkish tone surrounding the central bank has emerged as a significant factor influencing the pair negatively.
Market sentiment is currently leaning towards the belief that the US Fed will adhere to its hawkish policy stance. This conviction has been further reinforced by positive US economic data released on Wednesday, which revealed an unexpected acceleration in business activity within the US services sector during August.
US ISM Services PMI exceeded expectations in August by reaching a six-month high reading of 54.5, surpassing the anticipated figure of 52.5 and the previous reading of 52.7. However, the S&P Global Composite and Services PMIs declined to 50.2 and 50.5, respectively, falling short of market estimates of 50.4 and 51.0.
It's noteworthy that the moderate performance of US economic indicators seems to provide downward pressure for the Kiwi pair.
US Dollar Index (DXY), which gauges the value of the US Dollar (USD) against six other major currencies, is hovering around 104.80. The prevailing hawkish sentiment regarding the Fed policy decision in the upcoming September meeting continues to bolster US Treasury yields.
The higher yields reinforce the confidence of buyers in the Greenback. At the time of writing, the 10-year US bond yield has climbed to 4.29%, marking a 0.23% increase.
Investor confidence remains subdued as concerns persist about the deteriorating economic conditions in China and the ongoing trade tensions between the United States and China. These China-linked risks are exerting downward pressure on the New Zealand Dollar (NZD) owing to the strong trade ties between the two nations.
- EUR/GBP trades within a descending trend channel on the four-hour chart.
- The key resistance level is seen at 0.8600; the initial support level is located at 0.8563.
- Relative Strength Index (RSI) and MACD stand in bullish territory.
The EUR/GBP cross gains momentum above the mid-0.8500s during the early European session on Thursday. The cross currently trades near 0.8576, unchanged for the day.
The latest data revealed on Thursday that German Industrial Production (IP) for July fell -2.1% YoY from a 1.5% drop (revised from a 1.5% drop) in the previous month. On a monthly basis, the figure dropped 0.8% versus a 1.4% decline in June and below the expectation of a 0.5% drop. However, the Pound Sterling (GBP) is weakened against the Euro as the Bank of England (BoE) Governor Andrew Bailey's dovish remark on Wednesday that the central bank is much closer to ending its hiking cycle.
From a technical perspective, EUR/GBP trades within a descending trend channel since the middle of June on the four-hour chart. That said, That said, the path of least resistance for the cross is to the upside as EUR/GBP holds above the 50- and 100-hour Exponential Moving Averages (EMAs).
The critical resistance level for the cross is seen at 0.8600, representing a psychological round mark and a high of August 28. The next barrier to watch is 0.8626 (the upper boundary of a descending trend channel) en route to a high of August 11 at 0.8670 and finally near a high of July 19 at 0.8700.
On the flip side, the initial support level is seen at 0.8563 (50-hour EMA). The next downside stop is located at 0.8540 (a low of September 4). The additional downside filter is located at 0.8524 (a low of September 5). The key contention will emerge at 0.8500, portraying a lower limit of a descending trend channel and a psychological figure.
It’s worth noting that the Relative Strength Index (RSI) and Moving Average Convergence/Divergence (MACD) stand in bullish territory, supporting the buyers for now.
EUR/GBP four-hour chart

FX option expiries for Sept 7 NY cut at 10:00 Eastern Time, via DTCC, can be found below.
- EUR/USD: EUR amounts
- 1.0675 410m
- 1.0700 1.9b
- 1.0810 335m
- 1.0885 404m
- GBP/USD: GBP amounts
- 1.2700 999m
- 1.2750 561m
- 1.2795 602m
- USD/CHF: USD amounts
- 0.8650 400m
- AUD/USD: AUD amounts
- 0.6330 541m
- 0.6350 360m
- 0.6405 419m
- 0.6480 1.8b
- 0.6520 449m
- 0.6560 510m
- 0.6590 595m
- EUR/GBP: EUR amounts
- 0.8630 320m
- 0.8705 386m
Economist Lee Sue Ann and Markets Strategist Quek Ser Leang at UOB Group suggest GBP/USD risks a deeper retracement in the short-term horizon.
Key Quotes
24-hour view: Yesterday, when GBP was trading at 1.2565, we indicated that “as long as GBP stays below 1.2615 (minor resistance is at 1.2590), it might drop further.” We added, “in view of the oversold conditions, a clear break of 1.2500 is unlikely.” In line with our expectations, USD weakened even though it broke below 1.2500 and reached 1.2484 before recovering slightly. While conditions remain oversold, the weakness in GBP has not stabilised. In other words, GBP is likely to continue to drop. That said, this time around, a sustained break below 1.2470 is unlikely (the next major support at 1.2400 is highly likely to be out of reach today). Resistance is at 1.2525, followed by 1.2555.
Next 1-3 weeks: On Monday (04 Sep), when GBP was trading at 1.2590, we held the view that the risk for GBP had shifted to the downside. However, we indicated that “any weakness is likely to face solid support at 1.2545 and 1.2500.” After GBP broke below 1.2545, we highlighted yesterday (06 Sep, spot at 1.2565) that GBP “is likely to break 1.2500, but there is another strong support at 1.2470.” In NY trade, GBP cracked 1.2500 and dropped to 1.2484. We continue to expect GBP to weaken. That said, oversold short-term conditions could slow the pace of any further decline, and the next major support at 1.2400 might not come into view so soon. Overall, only a breach of 1.2605 (‘strong resistance’ level was at 1.2640) would suggest that GBP is not weakening further.
CME Group’s flash data for gold futures markets noted traders scaled back their open interest positions for the fourth consecutive session on Wednesday, now by nearly 2K contracts. Volume followed suit and shrank by nearly 48K contracts after two daily builds in a row.
Gold meets contention around the 200-day SMA
Gold prices dropped for the third straight session on Wednesday amidst shrinking open interest and volume, hinting at the likelihood that a deeper pullback is not favoured in the very near term. In the meantime, the 200-day SMA around $1917 emerges as a decent contention for the time being.
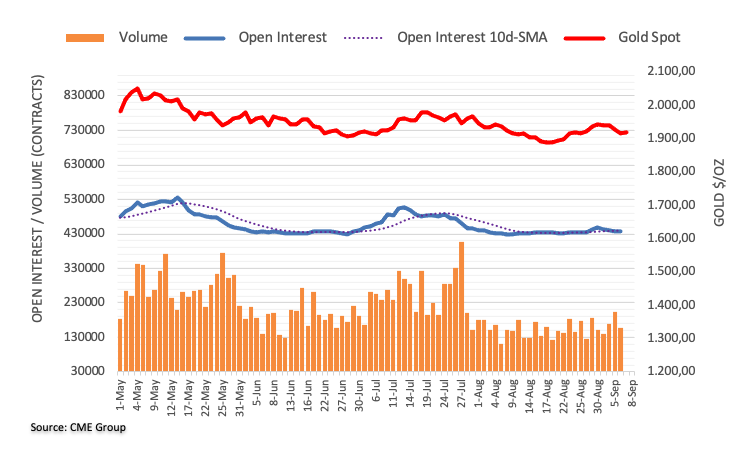
Bank of Japan (BoJ) board member Junko Nakagawa said on Thursday, “most important is for FX moves to reflect economic, financial fundamentals and move stably.”
Further comments
See equal degree of upside, downside inflation risks.
Can exit negative rate policy when economy is strong enough to weather headwinds, demand strengthens on prospects of sustained wage growth.
Don't have any preset idea on order, timing and interval on how to phase out ycc, negative rate as that will depend on financial developments at the time.
Can't say now how long it will take to judge whether sustained achievement of 2% inflation can be foreseen.
Won't comment on FX levels.
Monetary policy doesn't directly target FX, cannot do so.
As central bank, BoJ will communicate closely with govt and scrutinize market, FX moves and their impact on japan's economy.
We are controlling yield curve so any improvement in bond market function would be constrained to some extent.
Further tweak to YCC cannot be ruled out as option if inflation expectations heighten more, but this is not an imminent issue now.
Strong outcome in next year's wage talks would be a necessary condition, but not sufficient one, to contemplate ending negative rates.
Want to look at various factors beyond wages in deciding future policy change.
Market reaction
USD/JPY is off the lows, trading at 147.50 on the BoJ commentary. The pair is down 0.09% so far.
- EUR/JPY remains on the back foot around intraday low while snapping three-day winning streak.
- German Industrial Production for July slides to -2.1% YoY versus -1.5% prior.
- Sluggish yields, ECB blackout join hawkish BoJ concerns to lure sellers.
- Eurozone Q2 GDP, risk catalysts eyed for clear directions.
EUR/JPY holds lower grounds near the intraday bottom of around 158.20 while printing the first daily loss in four amid the early hours of Thursday’s European trading. In doing so, the cross-currency pair justifies downbeat prints of the German Industrial Production (IP), as well as the hawkish bias about the Bank of Japan (BoJ), amid sluggish Treasury bond yields and the European Central Bank (ECB) policymakers’ blackout period.
Germany’s Industrial Production (IP) for July dropped to -2.1% YoY versus upwardly revised -1.5% prior while the monthly IP figures dropped below -0.5% market forecasts to -0.8%, versus -1.4% previous readings (revised from -1.5%).
The latest German numbers join the mostly downbeat prints of the Eurozone statistics and unimpressive comments from the ECB policymakers to propel the economic slowdown woes for the Old Continent, which in turn weighs on the EUR/JPY pair. Among the data, German Factory Orders and Eurozone Retail Sales recently disappointed the bloc’s currency while raising doubts about ECB President Christine Lagarde’s defense of hawkish bias. It’s worth noting that a slew of ECB Officials crossed wires on Wednesday to mark the last-ditched efforts to showcase their capacity to lift the rates but the markets couldn’t believe them more.
Elsewhere, BoJ policymaker Junko Nakagawa crossed wires earlier in the day while defending the easy monetary policy by stating that it is appropriate to maintain the easy monetary policy for the time being. The policymaker, however, also added that they’re still not at the stage where they can say Japan has stably, sustainably achieved the BoJ price target. On the contrary, BoJ’s Nakagawa also highlighted the various side-effects of the monetary easing.
It should be noted that the market’s fears of global economic slowdown ex-US seem to propel the Treasury bond yields and weigh on the Yen prices. However, the same triggers the fears of Japanese policymakers’ market intervention to defend the currency, which in turn seemed to have prod the JPY of late.
That said, the US 10-year Treasury bond yields seesaw near the two-week high registered the previous day around 4.30%, near 4.29% at the latest, whereas the two-year counterpart prints the first daily loss in four by retreating from the weekly top to 5.01% as we write.
Looking ahead, the final readings of the Eurozone Gross Domestic Product (GDP) for the second quarter (Q2) will be eyed ahead of Friday’s Japan Q2 GDP for clear directions.
Technical analysis
Despite the EUR/JPY pair’s latest weakness, a one-month-old ascending support line, around 157.90 by the press time, appears the key to the seller’s conviction.
The official data showed on Thursday that the German Industrial Production fell more than expected in July, pointing to further weakness in the country’s manufacturing sector activity.
Industrial output in the Eurozone’s economic powerhouse dropped 0.8% MoM, the federal statistics authority Destatis said in figures adjusted for seasonal and calendar effects, vs. -0.5% expected and -1.4% previous.
Annually, Germany’s Industrial Production declined 2.1% in July when compared to a 1.5% drop in June.
FX implications
The shared currency remains vulnerable against the US Dollar after weak German industrial figures. The pair is losing 0.07% on the day to trade at 1.0719, as of writing.
EUR/USD is now seen navigating within the 1.0700-1.0750 range in the next few weeks, note Economist Lee Sue Ann and Markets Strategist Quek Ser Leang at UOB Group.
Key Quotes
24-hour view: Yesterday, we held the view that EUR “could dip below 1.0700 first before the risk of a rebound increases.” Our expectation did not quite materialise as it dipped to 1.0701 before recovering slightly to end the day little changed at 1.0727 (+0.07%). The price movement appears to be part of a consolidation phase. In other words, USD is likely to trade in a range today, probably between 1.0700 and 1.0750.
Next 1-3 weeks: Our update from yesterday (06 Sep, spot at 1.0725) still stands. As highlighted, EUR is likely to continue to weaken, and the next level to watch is May’s low of 1.0635. However, if EUR breaks above the ‘strong resistance’ at 1.0785 (level was at 1.0800 yesterday), it would mean that the EUR weakness that started early this week has stabilised. Meanwhile, oversold shortterm conditions could lead to a couple of consolidation first.
- AUD/USD reverses the previous day’s corrective bounce off yearly low despite lacking momentum of late.
- Six-month-old descending trend line challenges Aussie bears amid oversold RSI.
- Recovery remains elusive below 0.6460 resistance confluence; 0.6500 adds to the upside filters.
AUD/USD holds lower grounds near 0.6375-70 amid the early hours of Thursday’s European session, fading the previous day’s rebound from a 10-month low.
That said, the mixed trade numbers from Australia and China jostle with a lack of hawkish aura in the Reserve Bank of Australia (RBA) Governor Philip Lowe’s last statements as the Aussie central bank leader seem to weigh on the Aussie pair of late.
However, the nearly oversold RSI (14) line suggests limited downside room for the AUD/USD pair, which in turn highlights a downward-sloping support line from early March, close to 0.6330 at the latest.
In a case where the Aussie bears ignore the RSI conditions and break the stated key support line, the November 2022 bottom of around 0.6272 will act as the final defense of the pair buyers before highlighting the odds of witnessing a fall towards the last yearly trough of 0.6170.
Meanwhile, the AUD/USD pairs’ recovery remains unimpressive below a convergence of the 21-day Exponential Moving Average (EMA) and a downward-sloping resistance line from July 13, close to 0.6460 at the latest.
Following that, multiple levels marked since late May surrounding 0.6500 could check the AUD/USD bulls before giving them control.
Overall, the AUD/USD pair remains on the bear’s radar even as the downside room appears limited.
AUD/USD: Daily chart
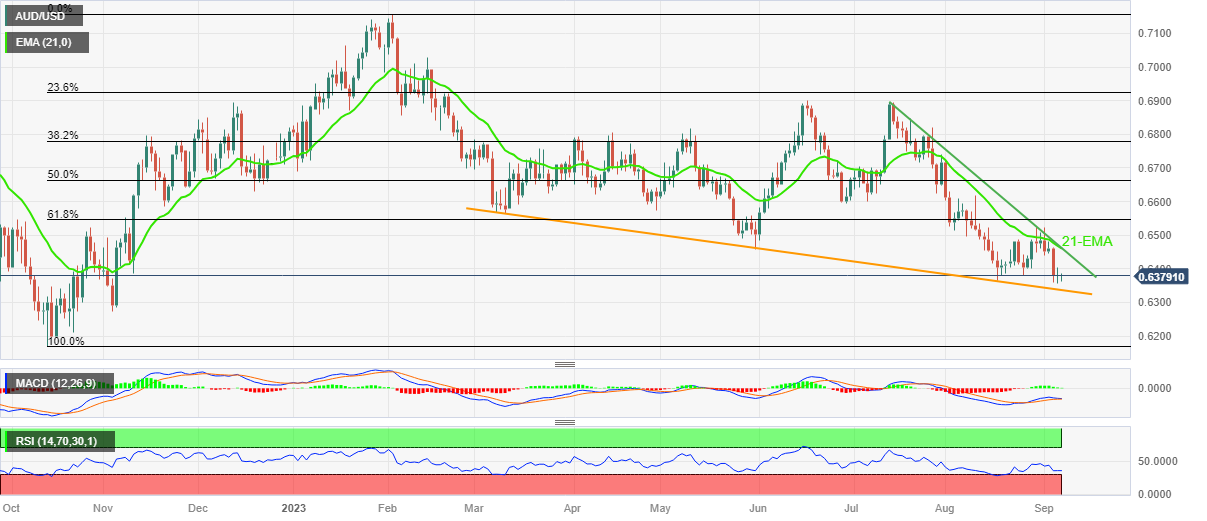
Trend: Limited downside expected
- Asian stock markets trade in negative territory on Thursday amid the concern about potential higher interest rates.
- China’s Exports and Imports came in better than estimated.
- Japanese policymakers said it is appropriate to maintain an easy monetary policy.
Asian equities edges lower on Thursday as investors are concerned about inflationary pressures in the US, which could convince the Federal Reserve (Fed) to keep interest rates high for longer than expected.
At press time, China’s Shanghai is down 0.58% to 3,139, the Shenzhen Component Index dips 1.24% to 10,385, Hong Kong’s Hang Sang declines 1.01% to 18,264, South Korea’s Kospi is down 0.77% and Japan’s Nikkei is down 0.67%.
In China, the latest data showed on Thursday that the nation’s Exports fell 8.8% YoY in August from a 14.5% drop in the previous month, a better-than-expected 9.5% drop. On the same line, Imports contracted 7.3% from a 12.4% drop prior and beat the market consensus of a 9.4% drop. Additionally, China registered a trade surplus of $68.36B in August, compared to $73.80B estimated and $80.6B in July.
Japanese stocks loses ground as Bank of Japan (BoJ) policymaker Junko Nakagawa said that it is appropriate to maintain an easy monetary policy for the time being. However, new economic stimulus measures offset some selling pressure. Kyodo News cites anonymous sources on Wednesday to affirm that the Japanese government is likely to launch a stimulus plan in October to support companies' wage increases and to lower energy bills.
Thailand's inflation, measured by the headline Consumer Price Index (CPI) rose 0.88% YoY in August from 0.38% in the previous reading. While Philippine’s Consumer Price Index increased 5.3% YoY in August from the previous reading of a 4.7% increase in July.
Looking ahead, the US weekly Initial Jobless Claims and Unit Labor Costs for Q2 will be due on Thursday. The attention will shift to the Japanese Gross Domestic Product (GDP) for Q2 on Friday. The quarterly growth number is expected to grow by 1.3%.
- EUR/USD fades bounce off three-month low, renews intraday bottom of late.
- Divergence between Eurozone and US data joins stark difference of ECB vs. Fed talks to weigh on Euro pair.
- German Industrial Production, Final readings of EU Q2 GDP and mid-tier US employment data will decorate calendar.
- Fed talks will be in the spotlight as ECB policymakers’ ‘quiet’ period begins, US soft landing concerns gain acceptance.
EUR/USD takes offers to refresh intraday low near 1.0718 but posts mild losses while reversing the previous day’s corrective bounce off a multi-day bottom heading into Thursday’s European session. I
The Euro pair retreats towards the lowest level in three months marked on Wednesday as the bloc’s currency remains pressured amid the European Central Bank’s (ECB) silence period ahead of next week’s monetary policy meeting. Apart from that, fears of Eurozone recession contrast with the US soft landing concerns, as well as the hawkish Federal Reserve (Fed) talks to also keep the major currency pair depressed as traders await German Industrial Production (IP) for July and the final readings of the Eurozone Gross Domestic Product (GDP) for the second quarter (Q2).
Mostly downbeat prints of the Eurozone statistics joined unimpressive comments from the ECB policymakers to propel the economic slowdown woes for the Old Continent, which in turn weighs on the Euro prices. Among the data, German Factory Orders and Eurozone Retail Sales recently disappointed the bloc’s currency while raising doubts about ECB President Christine Lagarde’s defense of hawkish bias. It’s worth noting that a slew of ECB Officials crossed wires on Wednesday to mark the last-ditched efforts to showcase their capacity to lift the rates but the markets couldn’t believe them more.
On the other hand, a surprise positive in ISM Services PMI and an absence of negative details of S&P Global PMIs for August joined hawkish Fed talks to defend the US Dollar amid hopes that the world’s largest economy can withstand higher rates. On the same line could be the Fed’s Beige Book suggesting a soft landing in the US.
Elsewhere, the US-China tension surrounding the trade conditions and Taiwan, as well as chatters that most other major economies outside the US will witness softer economic performance, also weighed on the sentiment and the EUR/USD pair, via the US Dollar’s haven demand.
Amid these plays, S&P 500 Futures remain pressured at the lowest level in a week, down for the fourth consecutive day while posting mild losses around 4,468 by the press time. That said, the US 10-year Treasury bond yields seesaw near the two-week high registered the previous day around 4.30%, near 4.29% at the latest, whereas the two-year counterpart prints the first daily loss in four by retreating from the weekly top to 5.01% as we write. With this, the US Dollar Index (DXY) remains firmer at the highest level in six months, mildly bid near 104.93 at the latest.
To sum up, the EUR/USD justifies the market’s preference for the US Dollar, especially when the ECB policymakers are barred from public speeches, which in turn highlights today’s US catalysts for clear directions.
Technical analysis
A two-month-old previous support line joins a support-turned-resistance line stretched from March to restrict short-term EUR/USD upside near 1.0755 and 1.0785 respectively. It’s worth noting, however, that the 1.0700 round figure joins nearly oversold RSI (14) to test the Euro bears before directing them to May’s bottom of 1.0635.
- USD/JPY retraces from the yearly high amid the stronger Dollar.
- Japanese government is likely to implement new economic stimulus measures in October.
- Markets anticipate that the Federal Reserve (Fed) will hold rates above 5% for a longer period.
- Japanese Gross Domestic Product (GDP) for Q2 will be a closely watched event.
The USD/JPY pair retreats from a Year-To-Date (YTD) high of 147.87 and currently trades around 147.50 during the Asian session on Thursday. The better-than-expected US data lift the US Dollar (USD) against its rivals.
Wednesday's Kyodo News cites anonymous sources to affirm that the Japanese government is likely to implement new economic stimulus measures in October, per Reuters. The news mentioned that the key goals of the stimulus are to support companies' wage increases and to lower energy bills.
Additionally, Bank of Japan (BoJ) policymaker Junko Nakagawa stated that it is appropriate to maintain an easy monetary policy for the time being. He added that Japan has not yet attained the BoJ's price target stably. It's worth noting that the monetary policy divergence between the US and Japan might cap the upside of the Japanese Yen and act as a tailwind for USD/JPY for the time being.
Earlier this week, Japanese Household Spending fell 5.0% year on year in July, below the market expectation of a 2.5% drop. This figure indicated the sixth straight month of decline.
Apart from this, Japan's top currency diplomat Masato Kanda stated a willingness to closely monitor Foreign Exchange movements with a sense of urgency while adding that all the options are on the table.
Across the pond, markets anticipate that the Federal Reserve (Fed) will maintain interest rates above 5% for a longer period. The Fed Governor Christopher Waller said that the Fed has extra room to raise interest rates, but the data will determine it. While, Fed Boston President Susan Collins pointed out the risk of an inappropriately restrictive monetary policy stance and called for a patient and careful, but deliberate policy.
About the data, the Institute for Supply Management (ISM) reported on Wednesday that the US ISM Services PMI rose to 54.5 in August from 52.7 the previous month, above the market consensus of 52.5. This figure is the highest since February. Furthermore, the S&P Global Composite's final readings fell to 50.2 in August from 50.4 in July. In response to the upbeat data, the US Dollar Index (DXY) climbed to a near six-month high above 105.00 on Wednesday.
Looking ahead, market participants will closely watch the Japanese Gross Domestic Product (GDP) for the second quarter due on Friday. Also, Labor Cash Earnings for July and Current Account will be released from the Japanese docket. Traders will take cues from these data and find the trading opportunity around the USD/JPY pair.
- USD/CHF bulls struggle to keep the reins at two-month high.
- Overbought RSI (14) line joins three-week-old ascending trend line to challenge buyers.
- Swiss Franc pair sellers need validation from 0.8780 support confluence, previous resistance line to retake control.
USD/CHF clings to mild gains around the highest levels in two months, lacks momentum near 0.8920 heading into Thursday’s European session during a three-day winning streak.
In doing so, the Swiss Franc (CHF) pair portrays the pair buyer’s struggle with a three-week-old rising resistance line amid the overbought RSI (14). However, a successful trading beyond the previous resistance line stretched from late May, as well as the 200-SMA keeps the bulls hopeful.
With this, the pair’s pullback towards the 0.8900 and then to the 50% Fibonacci retracement of May-July downside, near 0.8850 appears imminent.
A convergence of the 200-SMA and 38.2% Fibonacci ratio surrounding 0.8780 appears a tough nut to crack for the USD/CHF bears past 0.8850, a break of which will highlight the multi-day-old resistance-turned-support line of around 0.8720 as the last defense of the buyers.
On the flip side, a clear break of the aforementioned resistance line, close to 0.8930 needs validation from the recent peak surrounding 0.8945, as well as the Swiss Unemployment Rate for August, to convince the USD/CHF buyers.
Following that, a run-up towards the 0.9000 psychological magnet can’t be ruled out. Even so, the late June swing high of around 0.9020 may act as an extra filter toward the north.
USD/CHF: Four-hour chart
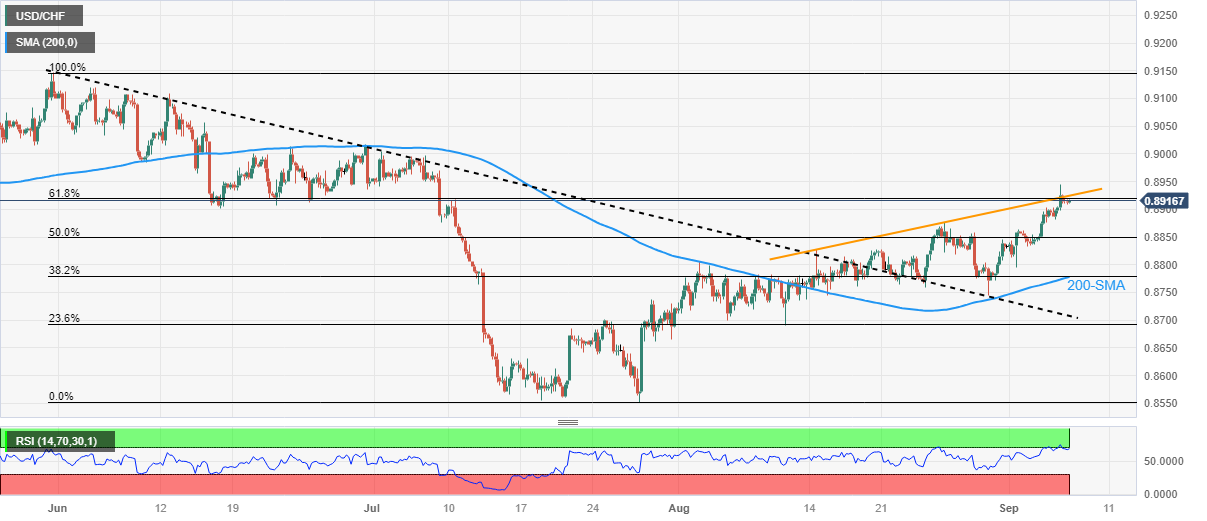
Trend: Pullback expected
- Gold price trades higher despite firmer US Dollar (USD).
- Upbeat US Treasury yields support the Greenback’s run-up.
- China-linked fear weighs on the price of bright metal.
Gold price snaps five-day losing streak, trading higher around $1,920, up by 0.20% during the Asian session on Thursday. However, the bright metal is facing downward pressure as traders factor in the odds for a 25 basis points (bps) interest rate hike by the US Federal Reserve (Fed) through the end of the year 2023.
The hawkish sentiment surrounding the Fed policy decision in the upcoming meeting in September, is continues to support the US Treasury yields. This reinforces the confidence of US Dollar (USD) bulls. The 10-year US bond yield rose to 4.28%, up by 0.05% at the time of writing. US Dollar Index (DXY) hovers around 104.80, which measures the value of the Greenback against the six other major currencies.
Additionally, US ISM Services PMI rose to a six-month high reading of 54.5 in August against the expectations of 52.5 and 52.7 prior. While the S&P Global Composite and Services PMIs fell to 50.2 and 50.5 compared to the market consensus of 50.4 and 51.0. It is worth noting that moderate US data provided support in underpinning the buck.
Investor sentiment remains dampened due to worries over the deteriorating economic situation in China and the ongoing trade tensions between the United States and China. These factors are casting a shadow over the minds of investors and undermining the Gold price.
However, it is worth noting that the bearish tone prevailing in the equity markets might offer some limited support to the price of precious metal, given a safe-haven status.
The trade tensions between the US and China escalated, which could act as headwinds for the price of yellow metal. As per Reuters, US Commerce Secretary Gina Raimondo said no revision is expected on US tariffs which were imposed on China during Trump's administration, until the ongoing review by the US Treasury Office is completed.
- USD/CAD regains positive traction and seems poised to prolong its near-term uptrend.
- The RSI on the daily chart is on the verge of oversold territory and warrants some caution.
- Any corrective decline to the 1.3600 mark could attract fresh buyers and remain limited.
The USD/CAD pair attracts some dip-buying during the Asian session on Thursday and stalls the overnight modest pullback from the 1.3675 region, or its highest level since March 28. Spot prices currently trade just below mid-1.3600s, up less than 0.10% for the day, though seem poised to extend the recent well-established uptrend witnessed over the past month or so.
The underlying strong bullish sentiment surrounding the US Dollar (USD), bolstered by rising bets for one more rate hike by the Federal Reserve (Fed) in 2023, validates the positive outlook for the USD/CAD pair. In contrast, the Bank of Canada (BoC), though signalled on Wednesday that it could raise borrowing costs again to combat inflation, is expected to be relatively quick to cut rates in the wake of signs that the Canadian economy is cooling rapidly. This, along with retreating Crude Oil price, could undermine the commodity-linked Loonie and suggests that the path of least resistance for the major is to the upside.
From a technical perspective, this week's sustained move beyond the 1.3600 mark was seen as a fresh trigger for bulls. That said, repeated failures to find acceptance above the 1.3645-1.3650 horizontal barrier warrant some caution before positioning for any further appreciating move for the USD/CAD pair. Moreover, the Relative Strength Index (RSI) on the daily chart has moved on the verge of breaking into the overbought territory and suggests that spot prices could consolidate in a range. Nevertheless, any corrective slide is likely to find support and attract fresh buyers near the 1.3600 resistance breakpoint.
Some follow-through selling, however, might expose the next relevant support near the 1.3525 region. This is closely followed by the 1.3500 psychological mark, below which the USD/CAD pair could accelerate the fall towards testing the very important 200-day Simple Moving Average (SMA), currently around the 1.3460 area. The latter should act as a pivotal point, A convincing break below will negate the positive outlook and shift the near-term bias in favour of bearish traders.
On the flip side, the 1.3670-1.3675 area, or the overnight swing high, could act as an immediate resistance, which if cleared should allow the USD/CAD pair to reclaim the 1.3700 mark. The momentum could get extended further towards the 1.3730 resistance zone en route to the 1.3800 round figure and the YTD peak, around the 1.3860 region touched in March.
USD/CAD daily chart
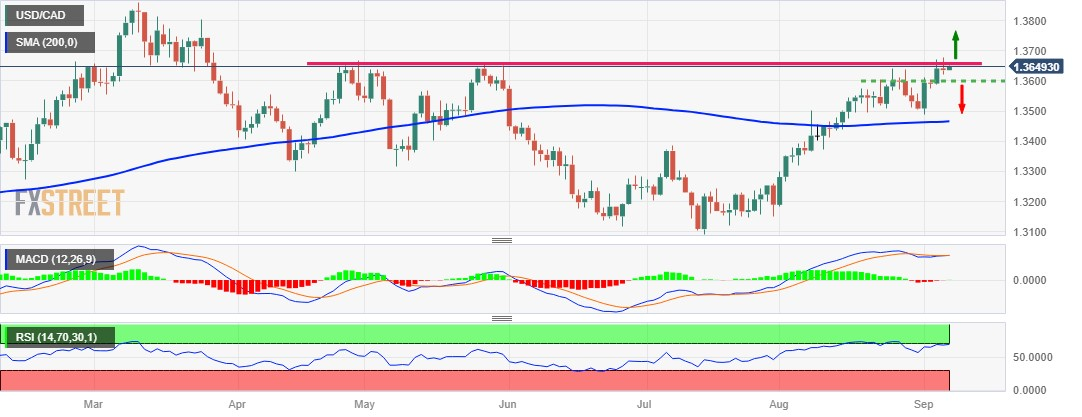
Technical levels to watch
António Guterres, the ninth Secretary-General of the United Nations (UN), said on Thursday, “there is a real risk of fragmentation in world economic and financial systems.”
Additional quotes
Diverging strategies on AI, conflicting security frameworks.
Developed countries must deliver on climate commitments to developing countries.
Need to establish effective debt workout mechanism to support payment suspensions, longer lending terms, lower rates.
Need to increase liquidity by rechanneling $100 bln of unused special drawing rights through multilateral development banks.
-
S&P 500 Futures, yields portray cautious mood as Fed talks eyed to confirm US soft landing
- GBP/USD remains flat around 1.2500, near a three-month low hit on Wednesday.
- The pair holds below the 50- and 100-hour EMAs on a one-hour chart.
- The first support level is located at 1.2465; immediate resistance level is seen at 1.2515.
The GBP/USD pair consolidates its recent losses around 1.2500 during the Asian session on Thursday. Meanwhile, the US Dollar Index (DXY), a measure of the value of USD against six other major currencies, hovers around 104.80 after retreating from the highest level since March. The strength of the Greenback is bolstered by the upbeat US ISM Services PMI, which came in better than expected and improved to a six-month high level of 54.5 in August.
On the other hand, the Pound Sterling (GBP) was weakened by Bank of England (BoE) Governor Andrew Bailey's dovish remark on Wednesday. He stated that BoE is much closer to ending its hiking cycle.
From the technical perspective, GBP/USD holds below the 50- and 100-hour Exponential Moving Averages (EMAs) with a downward slope on the one-hour chart, which means further downside looks favorable. Meanwhile, the Relative Strength Index (RSI) stands below 50, within bearish territory, suggesting that sellers are likely to retain control in the near term.
Any extended weakness below the lower limit of the Bollinger Band at 1.2465 will challenge the next contention at 1.2440 (a low of May 12) en route to 1.2390 (a low of June 6) and finally at 1.2350 (a low of May 31).
On the upside, the middle line of the Bollinger Band at 1.2515 acts as an immediate resistance level for GBP/USD. The additional upside filter is located at 1.2545 (50-hour EMA). Further north, the 1.2565-2575 zone appears a tough nut to crack for the Pound Sterling bears. The mentioned level represents the upper boundary of the Bollinger Band and the 100-hour EMA. The next barrier is seen near a psychological round mark at 1.2600.
GBP/USD one-hour chart
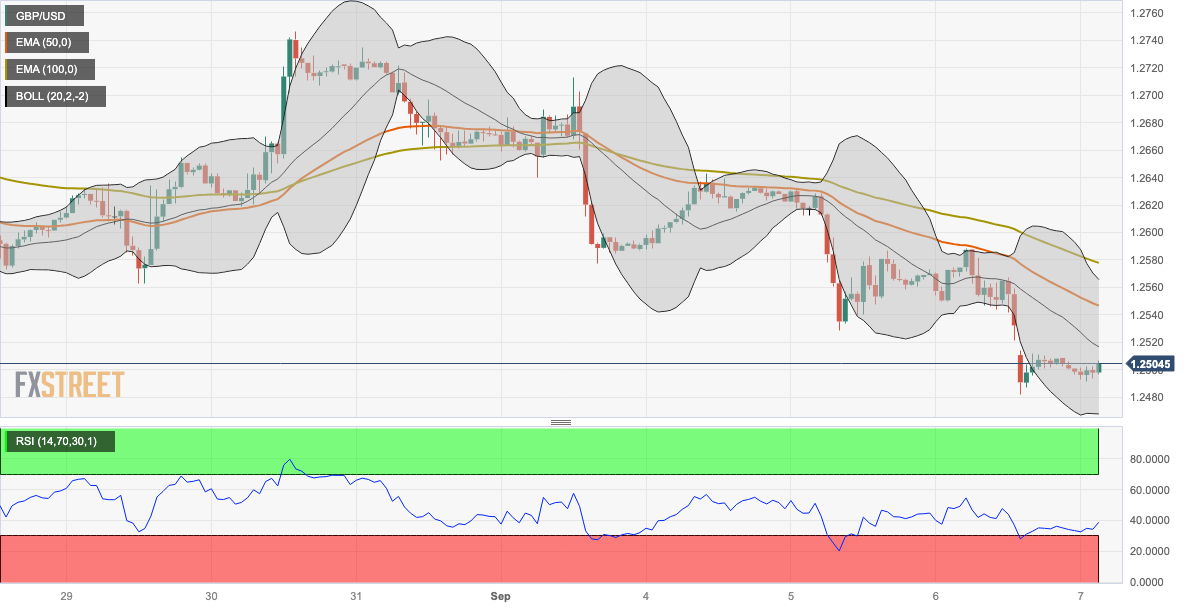
- AUD/USD remains depressed near the YTD low and is undermined by a combination of factors.
- Weaker Australian Trade Balance data and China's economic woes continue to weigh on the pair.
- The USD consolidates near a six-month high and holds back bearish traders from placing bets.
The AUD/USD pair struggles to gain any meaningful traction during the Asian session on Thursday and hovers just above its lowest level since November 2022 touched earlier this week. Spot prices currently trade around the 0.6370-0.6365 area and seem vulnerable to prolonging the recent well-established downtrend witnessed over the past two months or so.
The Australian Dollar (AUD) is undermined by weaker domestic data, which showed trade surplus shrank to $8.039 Billion in July as compared to $11.321 Billion in the previous month and $10.00 billion anticipated. Additional details revealed that Australia's Goods/Services Exports declined by 2% on a monthly basis, while Imports rose by 3% in July as compared to the 4% fall recorded in the previous month. The data, meanwhile, fails to impress bulls or lend support to the AUD/USD pair amid concerns about the worsening economic conditions in China – Australia's bigger trading partner.
The fears were further fueled by Chinese Trade Balance data for August, indicating that imports and exports fell 7.3% and 8.8% year on year, respectively, highlighting that manufacturers remain under pressure. The AUD/USD pair also reacts little to comments by the Reserve Bank of Australia (RBA) Governor Philip Lowe, reiterating the need to raise rates further if inflation becomes sticky. That said, the RBA's on-hold decision for the third straight meeting on Tuesday and lack of fresh hawkish signals now seem to have convinced that the central bank is down with the policy tightening.
The US Dollar (USD), on the other hand, is seen consolidating its recent rally to a six-week high and holding back traders from placing fresh bearish bets around the AUD/USD pair. The near-term bias, however, remains tilted in favour of the USD bulls in the wake of rising bets for one more 25 bps rate hike by the Federal Reserve (Fed) in 2023. The bets were lifted by the upbeat US ISM Services PMI on Wednesday. This remains supportive of elevated US Treasury bond yields and validates the positive outlook for the USD, suggesting that the path of least resistance for the pair is to the downside.
Technical levels to watch
- USD/INR eases from a three-week high while snapping two-day winning streak.
- Sluggish US Dollar, mixed China data allow Indian Rupee to pare weekly losses.
- Cautious mood in Asia, pullback in Oil Price prod pair buyers amid anxiety ahead of US data, Fed talks.
USD/INR takes offers to extend the early-day reversal from a three-week high to 83.10 heading into Thursday’s European session. In doing so, the Indian Rupee (INR) pair prints the first daily loss in three amid a mixed cautious mood ahead of a slew of US data and Federal Reserve (Fed) policymakers’ speeches.
It’s worth noting, however, that the Indian Rupee (INR) pair remains on the way to posting the biggest weekly loss in five despite the latest retreat amid the firmer US Dollar and strong Oil Price. That said, the mixed China foreign trade numbers seemed to have allowed the USD/INR pair buyers to take a breather.
China’s headline Trade Balance eased to $68.3 billion in August from $80.6 billion, versus $73.9 billion prior whereas the Exports and Imports for the said month improved to -8.8% YoY and -7.3% YoY respectively versus -14.5% and -12.4% priors in that order.
On the other hand, the US Dollar Index (DXY) struggled at the highest level in six months, indecisive at 104.85 at the latest whereas WTI crude oil eased from a 10-month high, marked earlier in the week, to $86.75 by the press time.
Despite the recently mixed China data, pessimism surrounding the Asian leaders remains in the spotlight amid the early-week disappointment via China Caixin Services PMI, as well as the market’s lack of confidence in the Dragon Nation’s stimulus. The same contrasts with mostly upbeat US data and hawkish Fed talk to propel the US Dollar’s haven demand.
Additionally, favoring the Greenback and the USD/INR pair could be the US-China tension surrounding the trade conditions and Taiwan, as well as concerns favoring the soft landing in the US. The strong US activity and output data join the hawkish Federal Reserve (Fed) signals to highlight the US Dollar as the market’s favorite. On the same line could be the Fed’s Beige Book suggesting a soft landing in the US.
It should be observed that a surprise output cut extension by Russia and Saudi Arabia contrasts with a slightly lower inventory draw to prod the Oil buyers at the highest level since November 2022. That said, India relies heavily on energy imports and strong WTI crude oil prices keep weighing on the Rupee.
Looking forward, the USD/INR pair traders should watch Chinese catalysts for immediate directions ahead of the weekly US Initial Jobless Claims and the quarterly readings of Nonfarm Productivity, as well as the Unit Labor Costs for the second quarter (Q2) will decorate the calendar and should also be important to watch for clear directions. Furthermore, there are multiple Fed officials scheduled to deliver speeches and will provide fresh impulse.
Technical analysis
USD/INR pullback remains elusive unless it stays beyond the 21-day SMA support of 82.95.
- EUR/GBP extends gains after the Eurozone’s moderate Retail Sales.
- BoE Governor Bailey advocated nearing the end of the interest rate-hike cycle.
- Investor sentiment is mixed regarding the ECB policy decision.
EUR/GBP extends its gains on the second day, trading higher around 0.8580 during the Asian session on Thursday. The pair experienced upward support after the release of the Eurozone’s moderate Retail Sales for July on Wednesday.
However, the Pound Sterling (GBP) is under pressure due to the Bank of England (BoE) Governor Andrew Bailey’s statement that the central bank is nearing the end of its series of interest rate increases. During his testimony to Parliament, Bailey and two members of the Monetary Policy Committee (MPC) expressed concerns that further tightening of monetary policy could potentially lead to an unnecessarily severe economic recession.
As mentioned earlier, Eurostat showed the performance of the retail sector remained consistent at -1% against the expectations of -1.2%. The monthly rate reported a decline of -0.2% as expected, swinging from the 0.2% growth prior.
Investor sentiment regarding the European Central Bank (ECB) is currently divided on the policy decision by the European Central Bank (ECB) in the upcoming meeting. Furthermore, Klaas Knot, a member of the ECB Governing Council, shared his perspective with Bloomberg, suggesting that market participants are underestimating the likelihood of an interest rate hike in the coming week. This implies that there is a degree of uncertainty in the market regarding the ECB's upcoming interest rate decisions.
It's worth noting that another ECB Governing Council member, Francois Villeroy de Galhau, has reiterated the idea that the ECB is approaching the peak of interest rates. Villeroy also mentioned that the ECB's decisions regarding interest rates are still open for discussion at the next few rate meetings. This implies that the ECB is carefully considering its options for future monetary policy, and the timing and direction of interest rate changes remain subjects of deliberation within the central bank.
Investors will likely watch the upcoming data releases, including Germany’s Industrial Production for July and the final readings of the Eurozone Gross Domestic Product (GDP) for the second quarter (Q2). These datasets may provide clearer directions to the EUR/GBP pair.
- USD/CNH remains firmer at two-week high despite upbeat Imports, Exports as Trade Balance deteriorates.
- Broad US Dollar strength, fears surrounding China economic growth propel offshore Yuan prices.
- Mid-tier US data, Federal Reserve policymakers speeches eyed for clear directions.
USD/CNH rises to 7.3265 while picking up bids to revisit the fortnight high marked earlier in the day after China reported mixed foreign trade data for August on early Thursday.
That said, China’s headline Trade Balance eased to $68.3 billion in August from $80.6 billion, versus $73.9 billion prior whereas the Exports and Imports for the said month improved to -8.8% YoY and -7.3% YoY respectively versus -14.5% and -12.4% priors in that order.
With this, the Chinese trade numbers join the early-week disappointment via China Caixin Services PMI, as well as the market’s lack of confidence in the Dragon Nation’s stimulus, to propel the offshore Chinese Yuan (CNH) pair. On the same line could be the US-China tension surrounding the trade conditions and Taiwan. Furthermore, the latest economics from the Eurozone and the UK, as well as statements from the European Central Bank (ECB) and the Bank of England (BoE) officials, have been portraying a downbeat economic picture of the Eurozone and Britain and contributing to the risk aversion, which in turn propels the US Dollar.
On the contrary, strong US activity and output data join the hawkish Federal Reserve (Fed) signals to highlight the US Dollar as the market’s favorite. On the same line could be the Fed’s Beige Book suggesting a soft landing in the US.
Against this backdrop, S&P 500 Futures remain pressured at the lowest level in a week, down for the fourth consecutive day while posting mild losses around 4,468 by the press time. That said, the US 10-year Treasury bond yields seesaw near the two-week high registered the previous day around 4.30%, near 4.29% at the latest, whereas the two-year counterpart prints the first daily loss in four by retreating from the weekly top to 5.01% as we write. With this, the US Dollar Index (DXY) struggled at the highest level in six months, indecisive at 104.85 at the latest
Having witnessed another downbeat clue for China's economy, the USD/CNH traders should wait for the second-tier US employment and activity data, as well as speeches from a slew of Fed policymakers for clear directions.
Technical analysis
USD/CNH remains on the way to refreshing the yearly top marked in August surrounding 7.3500 unless it drops below a three-week-long previous resistance line of near 7.2830.
Outgoing Reserve Bank of Australia (RBA) Governor Philip Lowe delivers his final speech titled ‘Some Closing Remarks’ at the Anika Foundation, Sydney, on Thursday.
Key quotes
My recent focus is risk wages, profits run ahead of rates consistent with return to inflation target.
If this risk materialised and inflation became sticky, would require tighter monetary policy.
Will be difficult to return to the earlier world in which inflation tracked in a very narrow range.
Inflation is likely to be more variable around target.
Australia has been well served by a flexible inflation target.
Possible that australia can sustain unemployment rates below what we have had over the past 40 years.
Now in an environment of stronger growth in nominal wages, which is positive.
The recent productivity record isn’t encouraging; solution fundamentally a political problem.
Interest rates influence housing prices, but are not reason australia has some of the highest prices in the world.
Issue that defined my term more than any other was forward guidance on rates during the pandemic.
Guidance was widely interpreted as a commitment, rather than a conditional statement.
With the benefit of hindsight, my view is that we did do too much during pandemic.
Market reaction
AUD/USD failed to find any inspiration from Governor Lowe’s farewell speech. The pair is trading 0.20% lower on the day at 0.6359, at the time of writing.
- NZD/USD languishes near the YTD trough and is pressured by a bullish USD.
- Bets for more Fed rate hikes and a softer risk tone continue to underpin the buck.
- The pair seems vulnerable to prolonging a nearly two-month-old descending trend.
The NZD/USD pair remains on the defensive through the Asian session on Thursday and currently trades around the 0.5865-0.5860 region, or its lowest level since November 2022.
The US Dollar (USD) stands tall near a six-month peak in the wake of growing acceptance that the Federal Reserve (Fed) will keep rates higher for longer and turns out to be a key factor weighing on the NZD/USD pair. The markets now seem convinced that the US central bank will stick to its hawkish stance and the bets were reaffirmed by Wednesday's upbeat US macro data, indicating that business activity in the US services sector unexpectedly picked up pace in August.
In fact, the US ISM Non-Manufacturing PMI rose from 52.7 in July to 54.5 last month – the highest level since February. Additional details of the report showed a rise in new orders, pointing to a resilient US economy, and higher Prices Paid sub-component, which was seen as potential signs of still-elevated inflation pressures. This, in turn, increases the odds for one more 25 bps Fed rate hike move by the end of this year and continues to act as a tailwind for the Greenback.
The outlook, meanwhile, remains supportive of elevated US Treasury bond yields, which, along with a softer tone around the equity markets benefits the safe-haven buck and does little to provide any respite to the risk-sensitive Kiwi. Market participants now seem worried about economic headwinds stemming from rising borrowing costs. This comes on the back of a slowdown in China – the world's second-largest economy – and tempers investors' appetite for riskier assets.
The aforementioned fundamental backdrop suggests that the path of least resistance for the NZD/USD pair is to the downside. That said, the Relative Strength Index (RSI) on the daily chart has moved on the verge of breaking into the oversold territory and holds back bearish traders from placing fresh bets. This makes it prudent to wait for some near-term consolidation before positioning for an extension of the well-established downtrend witnessed over the past two months or so.
Traders now look to the release of the Weekly Initial Jobless Claims data from the US, which, along with speeches by influential FOMC members and the US bond yields, will influence the USD price dynamics and provide some impetus to the NZD/USD pair. Apart from this, the broader risk sentiment might further contribute to producing short-term trading opportunities around the major.
Technical level to watch
China's Trade Balance for August, in Chinese Yuan terms, came in at CNY488 billion versus CNY575.70 billion previous.
Exports dropped 3.2% in the reported period vs. -9.2% last. The country’s imports fell 1.6% vs. -6.9% prior.
In US Dollar terms, China’s trade surplus shrunk more than expected in August.
Trade Balance came in at +68.36B versus +73.90B expected and +80.60B previous.
Exports (YoY): -8.8% vs. -9.5% exp. and -14.5% prior.
Imports (YoY): -7.3% vs. -9.4% exp. and -12.4% last.
Additional takeaways
China Jan-Aug dollar-denominated exports -5.6% YoY.
China Jan-Aug Dollar-Denominated Imports -7.6% YoY.
China Jan-Aug Trade Balance +$553.4 Bln.
FX implications
AUD/USD is testing lows near 0.6365 on dismal China’s trade figures. The spot is down 0.20% on the day, trading at 0.6368, as of writing.
- Risk profile remains downbeat amid hawkish Fed concerns, China woes.
- US data advocates soft landing but more clues, multiple Fed policymakers’ speeches eyed for confirmation.
- China figures remain dismal and weigh on sentiment even as stimulus hopes prod bears of late.
- Fears of witnessing slower economic growth, recession in China, UK and Eurozone spread pessimism of late.
The market sentiment remains downbeat despite lacking momentum during early Thursday.
While portraying the mood, S&P 500 Futures remain pressured at the lowest level in a week, down for the fourth consecutive day while posting mild losses around 4,468 by the press time. That said, the US 10-year Treasury bond yields seesaw near the two-week high registered the previous day around 4.30%, near 4.29% at the latest, whereas the two-year counterpart prints the first daily loss in four by retreating from the weekly top to 5.01% as we write.
With this, the US Dollar Index (DXY) struggled at the highest level in six months, indecisive at 104.85 at the latest, whereas prices of Gold and WTI Crude Oil trade mixed.
The traders wait for China’s headline foreign trade numbers for August and multiple Federal Reserve (Fed) officials’ speeches seem to restrict the market’s momentum of late. However, fears about the economic slowdown in China, the Eurozone and the UK contrast with the US soft landing concerns to defend the risk-off mood.
China’s early-week disappointment via China Caixin Services PMI joined the market’s lack of confidence in the Dragon Nation’s stimulus to weigh on the concerns about Beijing. On the same line could be the US-China tension surrounding the trade conditions and Taiwan. Furthermore, the latest economics from the Eurozone and the UK, as well as statements from the European Central Bank (ECB) and the Bank of England (BoE) officials, have been portraying a downbeat economic picture of the Eurozone and Britain and contributing to the risk aversion.
On the contrary, strong US activity and output data join the hawkish Federal Reserve (Fed) signals to highlight the US Dollar as the market’s favorite. On the same line could be the Fed’s Beige Book suggesting a soft landing in the US.
Looking ahead, the weekly US Initial Jobless Claims and the quarterly readings of Nonfarm Productivity, as well as the Unit Labor Costs for the second quarter (Q2) will decorate the calendar and should also be important to watch for clear directions above all, headlines about China, Federal Reserve (Fed) and soft landing will be crucial to watch for a clear guide.
Also read: Forex Today: US Dollar holds firm on risk aversion and US figures; China trade data next
- EUR/USD weakened due to the hawkish tone surrounding the US Fed.
- Momentum indicators suggest that the pair remains to be fragile in the short term.
- Weekly low aligned to 1.0700 psychological level could act as key support.
EUR/USD treads waters to extend its gains for the second consecutive day, trading slightly higher around 1.0730 during the Asian session on Thursday. The firmer US Dollar (USD) is weighing on the EUR/USD pair as the investors seem to cheer up the hawkish tone surrounding the Federal Reserve (Fed) to maintain interest rates at a higher level for an extended period.
The Moving Average Convergence Divergence (MACD) line stays below the centerline and shows divergence below the signal line. This suggests that the recent momentum is relatively bearish.
The pair could meet the immediate support around the weekly low at 1.0702 lined up with the 1.0700 psychological level. A firm break below the latter could open the doors for the EUR/USD pair to navigate the area around June’s low at 1.0661 level.
On the upside, the nine-day Exponential Moving Average (EMA) emerges as the key resistance, followed by the 1.0800 psychological level.
In case the Euro bulls become active, the pair could break above that level, leading to exploring the area around the 14-day EMA at 1.0810 aligned to 23.6% Fibonacci retracement at 1.0838 level.
The 14-day Relative Strength Index (RSI) stays below 50, which suggests the EUR/USD pair remains to be bearish in the short term.
EUR/USD: Daily Chart
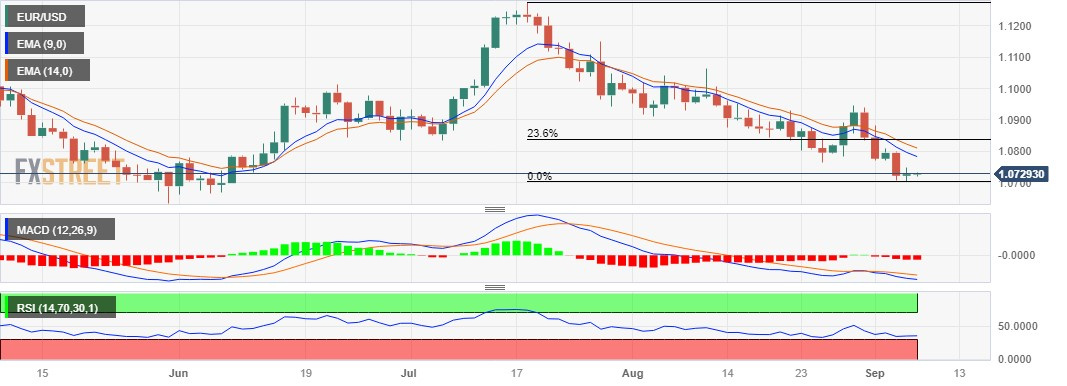
- Silver Price remains depressed at the lowest level in two weeks.
- Clear downbeat break of 200-EMA, bearish MACD signals direct XAG/USD sellers toward six-month-old rising support line.
- Multiple hurdles stand tall to challenge Silver Price recovery even as RSI conditions suggest limited downside room.
Silver Price (XAG/USD) dropped for the seventh consecutive day while fading the previous day’s corrective bounce off a two-week low by declining to $23.10 early Thursday morning. In doing so, the bright metal justifies the bearish MACD signals and a clear downside break of the 200-day Exponential Moving Average (EMA).
In addition to the technical signals, the market’s downbeat sentiment and the broadly firmer US Dollar also keep the XAG/USD sellers hopeful.
However, the RSI (14) line is below 50.0 and suggests bottom-picking of the commodity, which in turn highlights an ascending support line from early March, close to $22.60 as the key level to watch for the bears.
It’s worth noting that the precious metal’s failure to rebound from $22.60, will make it vulnerable to test a one-year-long rising trend line, close to $22.10, quickly followed by the $22.00 threshold.
In a case where the Silver Price remains bearish past $22.00, the odds of witnessing a gradual downside toward March’s low of around $19.90 can’t be ruled out. During the likely fall, the 50.0% and 61.8% Fibonacci ratios of September 2022 to May 2023 upside, respectively near $21.85 and $20.80, as well as the $20.00 psychological magnet, can test the XAG/USD sellers.
Alternatively, a daily closing beyond the 200-EMA level of $23.25 isn’t an open invitation to the Silver buyers as multiple levels around $24.00 and $24.20 may test the Silver Price recovery before highlighting the key resistance line stretched from May, close to $24.70 at the latest.
Silver Price: Daily chart
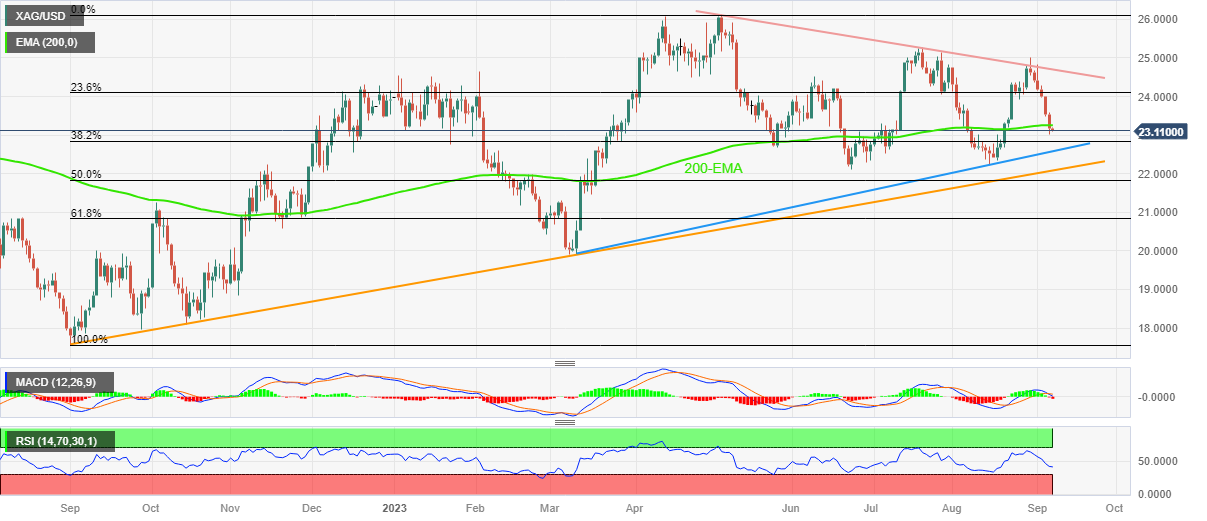
Trend: Limited downside expected
| Raw materials | Closed | Change, % |
|---|---|---|
| Silver | 23.16 | -1.61 |
| Gold | 1916.146 | -0.53 |
| Palladium | 1217.28 | -0.04 |
- Gold price gains some positive traction on Thursday, albeit lacks follow-through.
- A softer risk tone benefits the safe-haven XAU/USD amid subdued USD demand.
- Bets for more Fed rate hikes to act as a tailwind for the buck and cap the upside.
Gold price shows some resilience near the very important 200-day Simple Moving Average (SMA) and attracts some buying during the Asian session on Thursday. The XAU/USD currently trades just below the $1,920 level, up nearly 0.15% for the day, and for now, seems to have snapped a three-day losing streak to over a one-week low touched on Wednesday.
Concerns about the worsening economic conditions in China, along with persistent US-China trade tensions, continue to weigh on investors' sentiment. This is evident from a generally weaker tone around the equity markets and turns out to be a key factor that benefits the precious metal's safe-haven status. Apart from this, subdued US Dollar (USD) price action lends additional support to the Gold price, though any meaningful appreciating move still seems elusive.
The prospects for further policy tightening by the Federal Reserve (Fed), bolstered by the upbeat US macro data on Wednesday, should limit any meaningful USD corrective decline and cap gains for the XAU/USD. The Institute for Supply Management (ISM) reported that business activity in the US services sector unexpectedly picked up pace in August and its non-manufacturing PMI rose from 52.7 in July to 54.5 last month – the highest reading since February.
Additional details of the report showed a rise in new orders, pointing to a resilient US economy, and higher Prices Paid sub-component, which was seen as potential signs of still-elevated inflation pressures. This increased the odds for one more 25 basis points (bps) Fed rate hike move by the end of this year, which, in turn, pushed the yield on the benchmark 10-year US government bond closer to the August 23 peak and the USD to its highest level since March 9.
The aforementioned fundamental backdrop makes it prudent to wait for some follow-through buying around the Gold price before confirming that the recent pullback from a one-month peak, around the $1,953 area touched last Friday, has run its course. On the flip side, acceptance below the technically significant 200-day SMA is needed to reaffirm the negative bias. Traders now look to the US Weekly Initial Jobless Claims data to grab short-term opportunities.
Technical levels to watch
- WTI prices hold above the $87.00 mark, supported by draws on US crude oil inventory.
- API showed that US crude oil inventories fell 5.521M barrels compared to -11.486M barrels prior.
- The fear of the economic slowdown in China and more rate hikes by the Federal Reserve (Fed) might limit WTI prices.
Western Texas Intermediate (WTI), the US crude oil benchmark, is trading around the $87.00 mark so far on Thursday. WTI prices gain momentum due to further draws on US crude oil inventory and the voluntary supply cut by Saudi Arabia and Russia.
The data released by the American Petroleum Institute (API) showed that US crude oil inventories fell 5.521M barrels compared to the previous week’s -11.486M barrels.
Furthermore, Saudi Arabia and Russia, the world’s major oil exporters stated that they will extend oil production cuts for the rest of 2023. The actions boosted WTI prices, which have been rising in recent weeks. That said, the cut will bring Saudi crude output closer to 9 million barrels per day in October, November, and December, and will be reviewed monthly. Russia's Deputy Prime Minister Alexander Novak said that the nation would reduce its exports by 300,000 barrels per day through the end of 2023.
However, The fear of the economic slowdown in China might limit the WTI's upside potential as China is the world's largest oil importer. Oil traders await China’s Trade data for fresh impetus. Earlier this week, Caixin reported that the Chinese Services Purchasing Managers' Index (PMI) fell to 51.8 in August from 54.1 in July.
Additionally, Markets expect the Federal Reserve (Fed) will keep interest rates over 5% for a longer period. According to the World Interest Rates Probabilities (WIRP) tool, market participants speculate a 25 basis point (bps) rate increase from the Fed for the entire year. It’s worth noting that higher interest rates raise borrowing costs, which can slow the economy and diminish oil demand.
Looking ahead, oil traders await the EIA Crude Oil Stocks Change data for the week ending September 1 due on Thursday at 15:00 GMT. These events could significantly impact the USD-denominated WTI price. Oil traders will take cues from the data and find trading opportunities around the WTI prices.
- AUD/JPY reverses from intraday high to print three-day losing streak.
- Australia Trade Surplus shrinks in July, BoJ’s Nakagawa defends easy monetary policy but sounds slightly hawkish.
- Sour sentiment, sluggish yields also weigh on risk-barometer pair.
AUD/JPY justifies downbeat Australia data, as well as slightly hawkish bias about the Bank of Japan (BoJ), amid early Thursday’s risk aversion as it drops to 94.10 by the press time. In doing so, the cross-currency pair prints a three-day losing streak while also justifying the sluggish yields.
Australia’s trade surplus shrinks to 8,039M versus 10,000 expected and 11,321M prior. Further details reveal that Australia's July Goods/Services Exports reprint -2.0% figures on a monthly basis. That said, the country’s July Goods/Services Imports rose 3% MoM vs. -4.0% booked in June.
On the other hand, BoJ policymaker Junko Nakagawa initially defended the easy monetary policy by stating that it is appropriate to maintain the easy monetary policy for the time being while adding that they’re still not at the stage where we can say Japan has stably, sustainably achieved BoJ price target.
It’s worth noting that the fears about China's slowdown and optimism surrounding the US and Japan, not to forget concerns suggesting economic fears for Australia, together weigh on the sentiment and the AUD/JPY prices due to the quote’s risk-barometer status.
On Wednesday, Australia’s second quarter (Q2) Gross Domestic Product (GDP) rose to 0.4% QoQ versus 0.3% marked expectation and 0.2% prior readings but the yearly figures eased to 2.1% YoY from 2.3% previous readouts, versus the analysts’ estimations of 1.7%.
China’s early-week disappointment via China Caixin Services PMI joined the market’s lack of confidence in the Dragon Nation’s stimulus to weigh on the concerns about Beijing. On the same line could be the US-China tension surrounding the trade conditions and Taiwan.
On the other hand, Japan’s top currency diplomat Masato Kanda and Chief Cabinet Secretary Hirokazu Matsuno both mentioned watching the moves with a high sense of urgency on Wednesday. The policymakers also added that they would respond to the moves appropriately if necessary without ruling out any option.
Further, Bank of Japan (BoJ) board member Hajime Takata defended the central bank’s easy policy by citing very high uncertainty on the outlook. “BoJ will closely watch market developments to achieve bond market stability with eye on benefits, de-merits of YCC,” added the policymaker. BoJ’s Takata also cited stronger-than-expected US economic growth to justify the US Dollar strength while adding that there’s a certain distance to the ditching of negative rate policy.
Against this backdrop, the US 10-year Treasury bond yields struggle to extend the previous day’s run-up at a two-week high while the S&P 500 Futures remain pressured at the latest.
Moving on, China trade numbers for August and Philip Lowe’s last speech as the Reserve Bank of Australia (RBA) Governor will be important to watch for clear directions.
Technical analysis
AUD/JPY remains pressured between a one-week-old descending resistance line and an ascending support line stretched from late July, respectively near 94.55 and 93.75.
- AUD/USD struggles around 0.6380 after Australia’s downbeat trade data.
- Upbeat US Treasury yields continue to support the US Dollar (USD).
- US-China trade tension exerts downward pressure on the AUD/USD pair.
AUD/USD hovers near 0.6380 during the Asian session on Thursday, trading near the Year-To-Date (YTD). The firmer US Dollar (USD) is contributing support to undermine the AUD/USD pair as market participants anticipate the Federal Reserve (Fed) to maintain interest rates at a higher level for an extended period. Additionally, Australia’s downbeat Trade Balance (MoM) for July is reduced to 8,039M against the 10,000M expected. The balance was reported at 11,321M in the previous month.
The Australian Dollar (AUD) experienced minor support due to Australia’s upbeat Gross Domestic Product (GDP) for the second quarter released on Wednesday. GDP (YoY) grew at 2.1%, better than expectations of 1.7%. The growth rate was 2.4% in the previous quarter. GDP (QoQ) growth remained consistent at 0.4%, against the market consensus of 0.3%.
However, the Australian Treasurer, Jim Chalmers stated, "The slowdown in China's economy and higher interest rates at home will put significant pressure on the Australian economy." Chalmers also expressed confidence that Australia could steer clear of a recession.
The trade tensions between the US and China escalated, which could act as headwinds for the AUD/USD pair. The US Commerce Secretary Gina Raimondo’s statement as per Reuters. Raimondo expects no revisions to the US tariffs on China, which were imposed during Trump's administration until the ongoing review by the US Treasury Office is completed.
Conversely, US ISM Services PMI improved to a six-month high reading of 54.5 in August against the expectations of 52.5 and 52.7 prior. Further, the S&P Global Composite and Services PMIs eased to 50.2 and 50.5 versus the market consensus of 50.4 and 51.0. It is worth noting that moderate US data provided support in underpinning the Greenback.
Additionally, the investors are pricing in the possibility of a 25 basis points (bps) interest rate hike through the end of the year 2023. This hawkish sentiment continues to support the US Treasury yields, bolstering the confidence of US Dollar (USD) bulls. The 10-year US bond yield rose to 4.29%, up by 0.23%. US Dollar Index (DXY) hovers around 104.90, which measures the value of the Greenback against the six other major currencies.
Investors await China’s trade data for August ahead of the Reserve Bank of Australia (RBA) Governor Philip Lowe’s speech for guidance on the market. However, the prevailing risk-averse sentiment and the strength of the US Dollar pose significant challenges for AUD/USD bulls.
Early Thursday morning in Asia, Bank of Japan (BoJ) policymaker Junko Nakagawa crossed wires via Reuters while defending the Japanese central bank's current monetary policy.
BOJ’s Nakagawa initially defended the easy monetary policy by stating that it is appropriate to maintain easy monetary policy for time being while adding that they’re still not at stage where we can say japan has stably, sustainably achieved BoJ price target.
The policymaker highlighted the various side-effects of the monetary easing while also saying that the BoJ will conduct flexible market operation when 10-year Japanese Government Bond (JGB) yield moves in range of 0.5-1.0% range with eye on interest rate levels and speed of moves.
“BoJ's July decision has heightened sustainability of its monetary easing framework,” added BoJ’s Nakagawa while highlighting expectations of witnessing moderate economic recovery at home and fears of further slowdown in the global growth.
The policymaker showed indecision about inflation conditions while saying that there is chance inflation could accelerate more than expected, though there is also chance pass-through of costs could moderate.
USD/JPY retreats
Following the comments from BoJ policymaker Nakagawa, the USD/JPY pair retreats from the yearly high of 147.87 to 147.57 by the press time.
Also read: USD/JPY prints fresh YTD peak around 147.85, intervention fears might cap gains
- GBP/USD remains on the defensive near a three-month low touched on Wednesday.
- Bets for more Fed rate hikes continue to underpin the USD and weigh on the major.
- The BoE's signal that rate hikes may be nearing an end contributes to the softer tone.
The GBP/USD pair enters a bearish consolidation phase during the Asian session on Thursday and oscillates in a range just above a three-month low touched the previous day. Spot prices currently trade around the 1.2500 psychological mark and seem vulnerable to prolonging a nearly two-month-old descending trend.
The US Dollar (USD) takes a brief pause following the recent rally to its highest level since March 9 and turns out to be a key factor lending some support to the GBP/USD pair. Any meaningful USD corrective slide, meanwhile, still seems elusive in the wake of firming expectations that the Federal Reserve (Fed) will keep interest rates higher for longer. The bets were reaffirmed by the overnight release of the upbeat US ISM Services PMI, which surpassed even the most optimistic estimates and rose to a six-month high level of 54.5 in August.
Additional details of the report showed a rise in new orders and pointed to a resilient US economy. Furthermore, the higher Prices Paid sub-component was seen as a potential signs of still-elevated inflation pressures. This should allow the Fed to stick to its hawkish stance and increase the odds of an interest rate hike in November. The outlook, meanwhile, remains supportive of elevated US Treasury bond yields, which, along with a generally weaker risk tone, supports prospects for a further appreciating move for the safe-haven buck.
The British Pound (GBP), on the other hand, is undermined by the Bank of England (BoE) Governor Andrew Bailey's dovish signal on Wednesday, saying that the central bank is much nearer to ending its run of interest rate increases. Testifying to Parliament, Bailey and two MPC members said that the BoE is worried that further tightening could cause an unnecessarily harsh recession. This, along with the aforementioned USD supportive fundamental backdrop, suggests that the path of least resistance for the GBP/USD pair is to the downside.
Moving ahead, there isn't any relevant market-moving economic data due for release from the UK on Thursday, leaving spot prices at the mercy of the USD price dynamics. Later during the early North American session, traders will take cues from the Weekly Initial Jobless Claims data from the US and speeches by influential FOMC members. This, along with the US bond yields and the broader risk sentiment, will influence the USD price dynamics and produce short-term trading opportunities around the GBP/USD pair.
Technical levels to watch
According to the latest Aussie foreign trade data published by the Australian Bureau of Statistics, Australia’s trade surplus shrinks to 8,039M versus 10,000 expected and 11,321M prior.
Further details reveal that Australia July Goods/Services Exports reprint -2.0% figures on a monthly basis.
That said, the country’s July Goods/Services Imports rose 3% MoM vs. -4.0% booked in June.
AUD/USD remains pressured
AUD/USD remains on the back foot around 0.6380 while fading the late Wednesday’s corrective bounce off the yearly low.
Also read: AUD/USD stays defensive near yearly low beneath 0.6400, Australia/China trade data, RBA’s Lowe eyed
About Australia Trade Balance
The trade balance released by the Australian Bureau of Statistics is the difference in the value of its imports and exports of Australian goods. Export data can give an important reflection of Australian growth, while imports provide an indication of domestic demand. Trade Balance gives an early indication of the net export performance. If a steady demand in exchange for Australian exports is seen, that would turn into a positive growth in the trade balance, and that should be positive for the AUD.
- GBP/JPY lacks clear directions by sticking to mild gains as it snaps two-week downtrend.
- Bearish MACD signals suggest further consolidation of weekly gains.
- Convergence of 200-SMA, bottom line of the two-week-long symmetrical triangle appears a tough nut to crack for bears.
GBP/JPY treads water around 184.60 during the early hours of Thursday’s Asian session, after snapping a two-day winning streak the previous day. Even so, the cross-currency pair remains on the way to posting the first weekly gain in three as softer yields propel the Japanese Yen (JPY) despite hawkish Bank of Japan (BoJ) concerns, as well as fears of policy pivot at the Bank of England (BoE).
That said, the quote remains steady within a two-week-old symmetrical triangle but bearish MACD signals suggest further consolidation of the weekly gains, which in turn highlights the 184.00 as an immediate support to watch for the pair sellers.
However, the GBP/JPY bears should remain cautious unless they witness a clear downside break of the 183.70–60 support confluence comprising the aforementioned triangle’s bottom line and the 200-SMA.
Following that, a quick fall towards the late August swing low of around 183.35 can’t be ruled out while the early August peak of near 183.20 can prod the GBP/JPY bears afterward.
On the contrary, the 185.00 round figure guards the immediate recovery of the cross-currency pair ahead of the triangle’s top line, close to 185.65 at the latest.
Following that, a horizontal area comprising multiple levels marked since mid-August, around 186.30-35 will precede the latest peak, which is also the yearly high, of near 186.70 to challenge the GBP/JPY bulls.
GBP/JPY: Four-hour chart
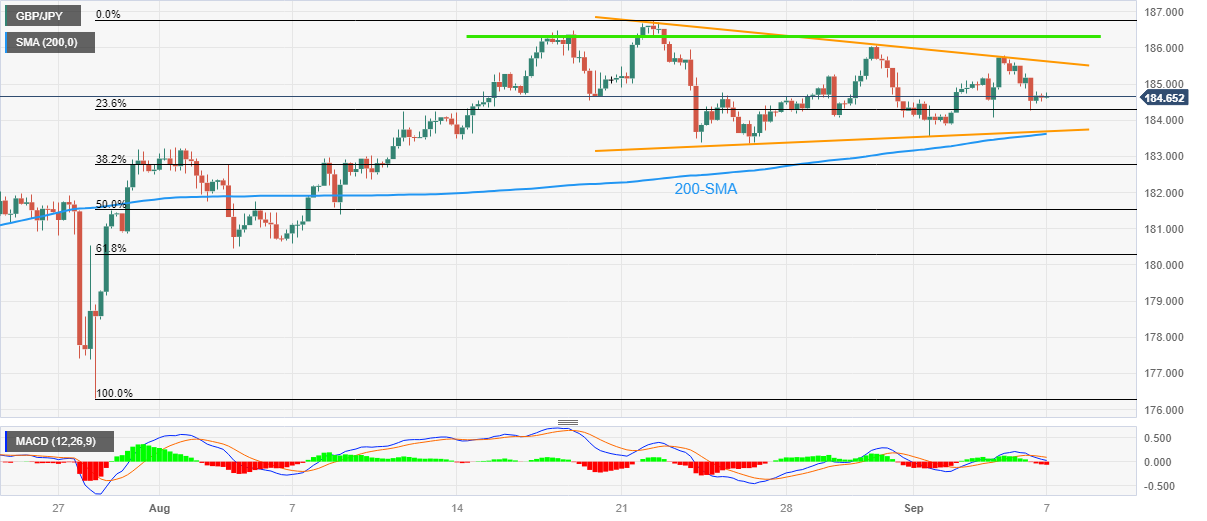
Trend: Limited downside expected
People’s Bank of China (PBoC) set the USD/CNY central rate at 7.1986 on Thursday, versus the previous fix of 7.1969 and market expectations of 7.3121. It's worth noting that the USD/CNY closed near 7.3184 the previous day.
Apart from the USD/CNY fix, the PBoC also unveiled details of its Open Market Operations (OMO) while saying that the Chinese central bank injects 330 billion Yuan via 7-day reverse repos (RRs) at 1.80% vs. prior 1.80%.
However, with the 209 billion Yuan of RRs maturing today, there prevails a net injection of around 12 billion Yuan on the day in OMO.
About PBOC fix
China maintains strict control of the yuan’s rate on the mainland.
The onshore yuan (CNY) differs from the offshore one (CNH) in trading restrictions, this last one is not as tightly controlled.
Each morning, the People’s Bank of China (PBOC) sets a so-called daily midpoint fix, based on the yuan’s previous day's closing level and quotations taken from the inter-bank dealer.
- USD/CHF trades in positive territory for the third consecutive day.
- US ISM Services PMI rose to 54.5 in August vs. 52.7 prior, above the market consensus of 52.5.
- The US will extend China's "Section 301" tariff exemptions on some imports until December 31.
- Market players will monitor US weekly Initial Jobless Claims, Unit Labor Costs for Q2.
The USD/CHF pair gains momentum near 0.8915 during the early Asian session on Thursday. The major pair attracts some buyers close to the monthly highs since July following the upbeat US economic data. Meanwhile, the US Dollar Index (DXY), a measure of the value of USD against six other major currencies, hovers around 104.85 after retreating from a six-month high of 105.02.
Markets expect the Federal Reserve (Fed) will keep interest rates over 5% for a longer period. The Federal Reserve (Fed) Governor Christopher Waller stated that they have further room to increase interest rates, but the data will determine whether the Fed needs to hike rates again and if it is done hiking rates. While, Fed Boston President Susan Collins pointed out the risk of an inappropriately restrictive monetary policy stance and called for a patient and careful, but deliberate policy.
Institute for Supply Management (ISM) reported on Wednesday that the US ISM Services PMI rose to 54.5 in August from 52.7 the previous month, above the market consensus of 52.5. This figure is the highest since February. Furthermore, the S&P Global Composite's final readings fell to 50.2 in August from 50.4 in July.
On the other hand, The office of US Trade Representative Katherine Tai extended China's "Section 301" tariff exemptions on 352 Chinese imports and 77 COVID-19-related categories until December 31, which were supposed to expire on September 30, per Reuters. This action will allow for more consideration under a statutory four-year review That said, the negative development or the renewed trade war tension between the US and China might benefit the traditional safe-haven CHF and act as a headwind for USD/CHF.
Furthermore, the downbeat Swiss economic data weigh on the Swiss France (CHF) this week. That said, the Swiss economy remained stagnant in the second quarter. The nation’s Gross Domestic Product (GDP) Q2 dropped to 0.0% QoQ, below the market consensus of 0.1% and the previous quarter's reading of 0.3%. On an annual basis, the growth number remained at 0.5% as expected, the Swiss Statistics reported on Monday.
Later this week, the US weekly Initial Jobless Claims and Unit Labor Costs for Q2 will be due. These figures could give a clear direction for the USD/CHF pair. In the absence of top-tier economic data releases from Switzerland later this week, the USD price dynamic will be the main driver for the USD/CHF pair.
- Natural Gas Price prints the first daily gains in four while bouncing off fortnight low.
- US Dollar bulls take a breather amid a light calendar in Asia.
- Upbeat US data, hawkish Fed talks and fears of China economic slowdown weigh on energy prices.
- US economic calendar, EIA Natural Gas Storage Change eyed for clear XNG/USD directions.
Natural Gas Price (XNG/USD) picks up bids to $2.75 early Thursday morning in Asia as energy traders await more clues to defend the previous losses, posting a corrective bounce off the short-term key moving average of late.
That said, a light calendar in Asia and a lack of major news allow the US Dollar bulls to take a breather. Also likely to have triggered the XNG/USD recovery is the cautious mood ahead of Thursday’s official weekly Natural Gas storage change data from the US Energy Information Administration (EIA).
Above all, fears of witnessing a softer economic transition in China, one of the world’s biggest commodity users, as well as receding supply-crunch fears of the energy instruments, seem to weigh on the Natural Gas Price.
Furthermore, the strong US Dollar has inverse ties with the XNG/USD and keeps the commodity sellers hopeful of late. It should be observed that the US Dollar Index (DXY) rose to a fresh high since March 15 on Wednesday while flashing a figure close to the 105.00 threshold before retreating to 104.85 afterward, around 104.90 by the press time. Even so, the Greenback’s gauge versus the six major currencies remains on the way to posting an eighth consecutive weekly gain amid economic optimism.
While trading the key catalysts, upbeat US activity and output data join the hawkish Federal Reserve (Fed) signals to defend the rate hikes and gain major attention. On the same line could be the Fed’s Beige Book suggesting a soft landing in the US and China woes that favor the Greenback’s haven demand.
Amid these plays, S&P 500 Futures remain depressed after Wall Street benchmarks closed in the red for the second consecutive day. That said, the US 10-year Treasury bond yields rose to a two-week high of around 4.30% and the two-year refreshed weekly top above 5.0%, which in turn offered notable strength to the US Dollar.
Looking ahead, multiple Fed policymakers are scheduled for speeches and can direct the XNG/USD prices. On the same line could be the second-tier clues of the US employment and activity numbers, as well as the weekly Natural Gas inventories.
Technical analysis
Natural Gas Price (XNG/USD) bounces off the 50-DMA support of around $2.71 to aim for a $2.80 upside hurdle. However, the 200-DMA level of near $2.97 and the three-month-old rising support line surrounding $2.69 appear more important levels to watch for clear directions of the XNG/USD price.
- USD/JPY refreshes YTD peak during the Asian session, albeit lacks follow-through buying.
- The USD stands tall near a six-month top amid more Fed rate hike bets and lends support.
- Intervention fears, a softer risk tone benefits the safe-haven JPY and caps any further gains.
The USD/JPY pair edges higher during the Asian session on Thursday and touches a fresh high since November 2022, around the 147.80-147.85 region in the last hour, albeit lacks follow-through.
The US Dollar (USD) stands tall near a six-month peak touched on Wednesday in the aftermath of the upbeat US macro data, which, in turn, is seen as a key factor acting as a tailwind for the USD/JPY pair. In fact, the US ISM Services PMI surpassed even the most optimistic estimates and rose to 54.5 in August, or the highest since February. Additional details of the report showed a rise in new orders and businesses paying higher prices, pointing to a resilient US economy and persistent inflation pressure. This increases the odds of an interest rate hike by the Federal Reserve (Fed) in November.
The view that the US central bank will keep rates elevated for longer remains supportive of elevated US Treasury bond yields and acts as a tailwind for the Greenback. The Japanese Yen (JPY), on the other hand, continues with its relative underperformance in the wake of a dovish stance adopted by the Bank of Japan (BoJ), which is expected to stick to its ultra-loose policy settings. That said, fears that Japanese authorities will intervene in the foreign exchange markets to prop up the domestic currency hold back traders from placing fresh bullish bets around the USD/JPY pair.
It is worth recalling that Japan's top currency diplomat Masato Kanda warned against the recent sell-off in the JPY and said on Wednesday that authorities won't rule out any options if speculative moves in the currency market persist. This, along with a generally weaker tone around the equity markets, is seen underpinning the JPY's safe-haven status and contributing to capping the upside for the USD/JPY pair. Worries about economic headwinds stemming from rising borrowing costs come on top of concerns about a slowdown in China and temper investors' appetite for riskier assets.
The aforementioned mixed fundamental backdrop warrants some caution before positioning for a further near-term appreciating move, though any meaningful corrective decline still seems elusive. This, in turn, suggests that the USD/JPY pair is more likely to extend its subdued/range-bound price action. Traders now look to the release of the Weekly Initial Jobless Claims data from the US for short-term opportunities later during the early North American session. The focus will then shift to the Japanese economic data dump, including the final Q2 GDP print on Friday.
Technical levels to watch
- USD/MXN remains firmer at the highest level in three months despite latest inaction, up for the sixth consecutive day.
- Firmer US data, hawkish Fed signals join upbeat yields to underpin US Dollar strength.
- Lack of Mexican catalysts keeps Peso on the back foot.
- Mexican inflation clues, US data and Fed talks eyed for clear directions.
USD/MXN remains on the front foot for the sixth consecutive day despite making rounds to a three-month high marked the previous day during the early hours of Thursday’s Asian session. That said, the Mexican Peso (MXN) pair prints mild gains around 17.60 by the press time, picking up bids of late to reverse the late Wednesday’s retreat from the multi-day high of 17.67.
Broad US Dollar strength amid optimism about the US economy, contrasts with the fears of recession elsewhere, and joins the Federal Reserve signals to defend the USD/MXN bulls even as the Peso has the higher yields.
The US Dollar Index (DXY) rose to a fresh high since March 15 on Wednesday while flashing a figure close to the 105.00 threshold before retreating to 104.85 afterward, around 104.90 by the press time. Even so, the Greenback’s gauge versus the six major currencies remains on the way to posting an eighth consecutive weekly gain amid economic optimism.
That said, the US ISM Services PMI rose to a six-month high of 54.5 in August versus 52.5 expected and 52.7 prior. Further, the final readings of the S&P Global Composite and Services PMIs eased to 50.2 and 50.5 for the said month compared to the initial estimations of 50.4 and 51.0 in that order. It should be noted that all three major constituents of the ISM Services PMI, namely Employment, New Orders and Prices Paid rose notably beyond the previous readings and helped the US Dollar to reverse early-day pullback. Earlier in the week, the US Factory Orders for July dropped to the lowest since mid-2020 but the details about the orders excluding transport, shipments of goods and inventories were impressive to defend the hawkish Fed bias.
Given the mostly upbeat US data, Federal Reserve (Fed) Governor Christopher Waller defended hawkish monetary policy during a CNBC interview while Cleveland Federal Reserve President Loretta Mester ruled out rate cuts. However, Federal Reserve Bank of Boston President Susan Collins cited the risk of an overly restrictive stance on monetary policy to suggest the need for a patient and careful, but deliberate, approach. It should be noted, however, that the Fed’s Beige Book pushed back expectations of witnessing either a policy pivot or rate cut from the Fed while stating, “US economic growth was modest amid a cooling labor market and slowing inflation pressures in July and August,” which in turn fuels the yields and the US Dollar.
Additionally fueling the US Dollar, as well as the USD/MXN pair could be the downbeat concerns about China, the world’s second-largest economy. That said, China’s Caixin Services PMI joined the market’s lack of confidence in the Dragon Nation’s stimulus to spoil the concerns about Beijing. On the same line could be the US-China tension surrounding the trade conditions and Taiwan.
Against this backdrop, S&P 500 Futures remain depressed after Wall Street benchmarks closed in the red for the second consecutive day. That said, the US 10-year Treasury bond yields rose to a two-week high of around 4.30% and the two-year refreshed weekly top above 5.0%, which in turn offered notable strength to the US Dollar.
Moving on, Mexico’s Headline Inflation, 12-month Inflation and Core Inflation details for August will precede the weekly US Initial Jobless Claims and the quarterly readings of Nonfarm Productivity, as well as the Unit Labor Costs for the second quarter (Q2), to decorate the calendar and should be watched carefully for clear directions.
Technical analysis
A daily closing beyond the 17.42-43 horizontal resistance, now support, keeps the USD/MXN buyers hopeful of approaching the 18.00 threshold.
| Index | Change, points | Closed | Change, % |
|---|---|---|---|
| NIKKEI 225 | 204.26 | 33241.02 | 0.62 |
| Hang Seng | -6.93 | 18449.98 | -0.04 |
| KOSPI | -18.84 | 2563.34 | -0.73 |
| ASX 200 | -57.2 | 7257.1 | -0.78 |
| DAX | -30.34 | 15741.37 | -0.19 |
| CAC 40 | -60.63 | 7194.09 | -0.84 |
| Dow Jones | -198.78 | 34443.19 | -0.57 |
| S&P 500 | -31.35 | 4465.48 | -0.7 |
| NASDAQ Composite | -148.48 | 13872.47 | -1.06 |
Early Thursday morning in Asia, Reuters released details of a survey conducted during September 1–6 with around 53 Forex strategists to confirm the US Dollar’s firmer dominance in 2023 before easing in the next year.
“The dollar's strength will be difficult to overcome for most major currencies by year-end,” said the poll while adding that the risks to the analysts’ greenback outlook were skewed to the upside.
The poll signals the Euro (EUR) to have gained 2.7% to $1.10 and 4.6% to $1.12 in six and 12 months, respectively whereas the Japanese Yen (JPY) is likely to pare back all of the current year's losses and change hands at 132/Dollar in the next 12 months.
It should be noted that the British Pound (GBP) is expected to gain another 3% to 1.29 per the US Dollar in a year but the Asia currencies are anticipated to seesaw during the next year, staying within a range or gaining a little versus the Greenback at best.
Also read: US Dollar Index: DXY flirts with yearly peak near 105.00 on hawkish Fed, US soft landing concerns
- USD/CAD gains ground near 1.3642 amid the US Dollar demand.
- Bank of Canada (BoC) holds its key overnight interest rate at 5%, as expected.
- US ISM Services PMI rose to 54.5 in August vs. 52.7 prior, better than estimated.
- Investors will monitor the weekly US Initial Jobless Claims, Canadian labor data.
The USD/CAD pair gains momentum below the mid-1.3600s during the early Asian trading hours on Thursday. Meanwhile, the US Dollar Index (DXY) hovers around 104.85, retreating from 105.00 following the release of the US ISM Services PMI. The major pair currently trades near 1.3642, up 0.04% on the day.
On Wednesday, the Bank of Canada (BoC) maintained its key overnight interest rate unchanged at 5%, as anticipated by the market. The BoC Governing Council stated that the central bank leaves the door open for another rate rise as core inflation measures remain elevated. BoC policymakers added that the economy has entered a period of slower expansion, which is required to alleviate inflationary pressures.
About last week’s data, Canadian real Gross Domestic Product (GDP) Annualized for the second quarter contracted at 0.2% YoY against the previous reading of 2.6%. The growth number was worse than expected with a 1.2% expansion. Meanwhile, the rally in oil prices might lift the Loonie as Canada is the largest exporter of crude to the US.
On the other hand, the US Dollar edges higher amid the cautious mood in the market as investors await China’s Trade Data. Meanwhile, markets expect the Federal Reserve (Fed) will keep interest rates over 5% for a longer period. The Federal Reserve (Fed) Governor Christopher Waller stated that they have further room to increase interest rates, but the data will determine whether the Fed needs to hike rates again and if it is done hiking rates.
Data released from the Institute for Supply Management (ISM) showed on Wednesday that the US ISM Services PMI rose to 54.5 in August from 52.7 the previous month, above the market consensus of 52.5. This figure is the highest since February. Furthermore, the S&P Global Composite's final readings fell to 50.2 in August from 50.4 in July.
Looking ahead, the weekly US Initial Jobless Claims, quarterly Nonfarm Productivity data, and Unit Labour Costs for the second quarter (Q2) will be released. On the Canadian docket, Canada’s labor market data for August will be closely watched. The Unemployment Rate is expected to rise 5.6%. These data could give a clear direction for the USD/CAD pair.
| Pare | Closed | Change, % |
|---|---|---|
| AUDUSD | 0.6382 | 0.04 |
| EURJPY | 158.277 | -0.07 |
| EURUSD | 1.07237 | -0.01 |
| GBPJPY | 184.541 | -0.58 |
| GBPUSD | 1.25016 | -0.52 |
| NZDUSD | 0.58689 | -0.27 |
| USDCAD | 1.36352 | -0.02 |
| USDCHF | 0.89099 | 0.19 |
| USDJPY | 147.607 | -0.06 |
Japanese media Kyodo News cites anonymous sources to confirm on Wednesday that the government in Tokyo appears set to roll out fresh economic stimulus in October.
Reuters quotes the Japanese media while stating the main aims of the stimulus as “To support companies' wage hikes and mitigate energy bills.”
“Prime Minister Fumio Kishida is expected to order his government agencies to draft the package by the end of September, with an aim of compiling an extra budget to fund the measures,” the news mentioned.
It should be noted that Reuters came out with the analysis suggesting the burden of the nation’s debt due to the stated stimulus within the news. The calculations signal Japan’s debt, which is already double the size of GDP, to reach a record high of 112 trillion yen ($760 billion) for the next fiscal year.
USD/JPY grinds higher
USD/JPY remains on the front foot around 147.70 as Tokyo opens for Thursday, after reversing from a 10-month high the previous day, despite lacking bearish momentum during late Wednesday.


© 2000-2026. Sva prava zaštićena.
Sajt je vlasništvo kompanije Teletrade D.J. LLC 2351 LLC 2022 (Euro House, Richmond Hill Road, Kingstown, VC0100, St. Vincent and the Grenadines).
Svi podaci koji se nalaze na sajtu ne predstavljaju osnovu za donošenje investicionih odluka, već su informativnog karaktera.
The company does not serve or provide services to customers who are residents of the US, Canada, Iran, The Democratic People's Republic of Korea, Yemen and FATF blacklisted countries.
Izvršenje trgovinskih operacija sa finansijskim instrumentima upotrebom marginalne trgovine pruža velike mogućnosti i omogućava investitorima ostvarivanje visokih prihoda. Međutim, takav vid trgovine povezan je sa potencijalno visokim nivoom rizika od gubitka sredstava. Проведение торговых операций на финанcовых рынках c маржинальными финанcовыми инcтрументами открывает широкие возможноcти, и позволяет инвеcторам, готовым пойти на риcк, получать выcокую прибыль, но при этом неcет в cебе потенциально выcокий уровень риcка получения убытков. Iz tog razloga je pre započinjanja trgovine potrebno odlučiti o izboru odgovarajuće investicione strategije, uzimajući u obzir raspoložive resurse.
Upotreba informacija: U slučaju potpunog ili delimičnog preuzimanja i daljeg korišćenja materijala koji se nalazi na sajtu, potrebno je navesti link odgovarajuće stranice na sajtu kompanije TeleTrade-a kao izvora informacija. Upotreba materijala na internetu mora biti praćena hiper linkom do web stranice teletrade.org. Automatski uvoz materijala i informacija sa stranice je zabranjen.
Ako imate bilo kakvih pitanja, obratite nam se pr@teletrade.global.
транcфери