- TeleTrade
- Cooperación
- Noticias
- Classic Triangle Patterns and How to Trade Them
Classic Triangle Patterns and How to Trade Them
 A standard price channel involves parallel lines of support and resistance. In such cases, investors place their positions only at the points of rebound. There are common situations, however, where the lines are not parallel, converging or diverging over time. These distinct formations by non-parallel support and resistance lines are called chart patterns and traders should observe them closely, as they create trading signals.
Ιn this article we look at the classic triangle patterns and how to trade them.
Triangles
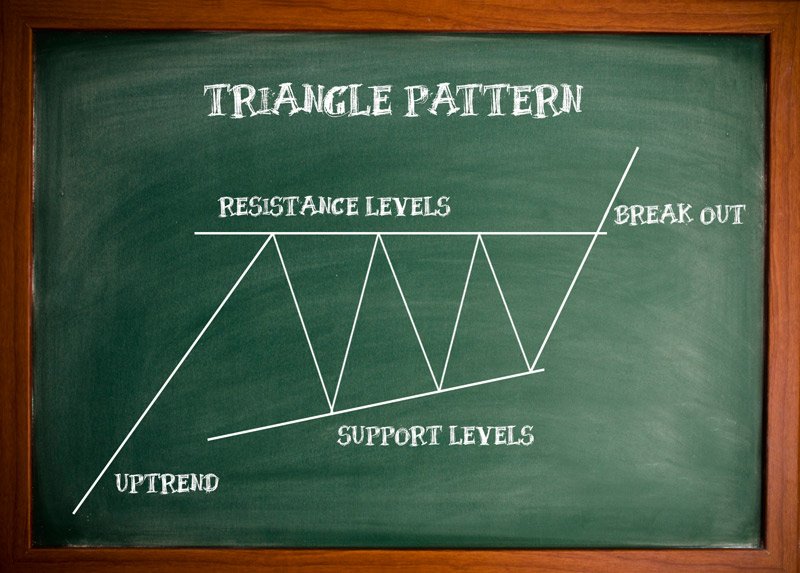
Triangle patterns, as their name clearly implies, have the shape of a triangle. They are formed when the lines of support and resistance converge, with the price of the financial instrument bouncing between the two lines. Traders recognise three standard types of triangle patterns, which differ in structure and importance; the symmetrical, the ascending and the descending triangle. In these formations, the point at which the two trend lines extend and intersect is called the apex. The distance between the first high reversal point and the first low reversal point within the triangle is known as the base.
Symmetrical Triangle
A symmetrical triangle is usually regarded to be a continuation pattern, indicating a consolidation period during an upward trend or a downward trend, which is frequently followed by a continuance of the previous trend. This pattern is shaped with a support line that slopes upwards and a line of resistance that slopes downwards. From the unavoidable convergence of the lines at some point, the price is forced to penetrate one of them. The trading signal to open a trade will be given after a real breakout. In case that the breakout does not result in the continuation of the previous trend, but moves in the opposite direction, it indicates the generation of a new trend.
Let’s take as an example the real breakout of a resistance line, where the candlestick closes above the resistance level. The target must be determined using previous peaks shaped by the triangle. A trader may set several price targets, usually 2 or 3. The horizontal line from the nearest peak would be the most direct target, which can be reached 95% of the times. The second target can be determined by using the next peak, although it will take more time to be reached than the first one. Moreover, the possibilities of attaining it will be lower, as the higher the target, the lower the probability of reaching it, mostly 80% of times. Consequently, the third target would be the most remote one, with the lowest probability of attainment – approximately 65% of success. The same reasoning applies for cases of real penetration of the support line.
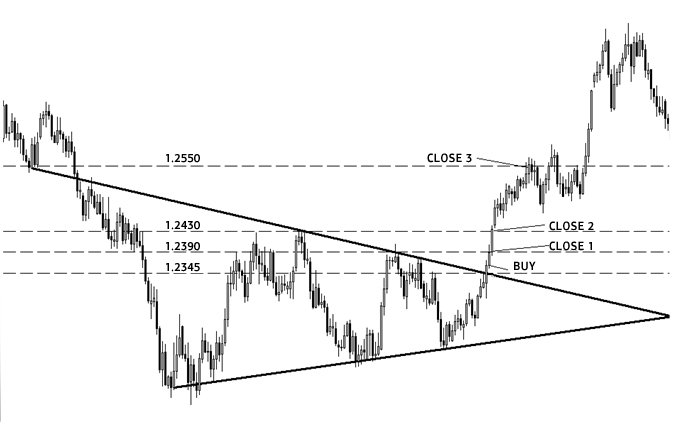
As you can tell from the above, the symmetrical triangle is a flexible pattern that serves all traders’ types. The ones searching for a moderate, but sure profit will opt to close their positions at the closest peak, while those with higher risk tolerance will close their positions at a higher peak.
Ascending Triangle
An ascending triangle is generally considered to be a bullish signal, indicating that the instrument price is moving to the north upon completion of the pattern. It is generated when a price bounces between a resistance line that is relatively flat or horizontal and a support line that is sloping upwards. As the two lines eventually converge, the probability of an upward breakout increases. This formation is generally regarded as a continuation pattern, as it usually follows an uptrend. There are cases, however, that you can find it after a downtrend.
The rising support line signifies that sellers are beginning to abandon the instrument. When they are eventually out of the game, the buyers will take the reins, pushing the price above the resistance line and continue moving upward.
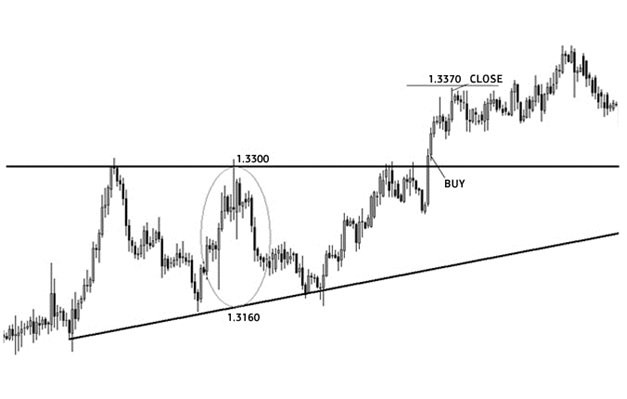
A buy signal is created after a real breakout has taken place. Price targets are determined through a more complex process than with a symmetrical triangle, by first using the middle part of the triangle and calculating its height in pips, then dividing that figure by 2. In our example, the height is equal to 1.3300-1.3160= 140 pips. Therefore, the maximum target is 70 pips (140/2), and the price target equals to the breakout point of 1.3300 plus the 70 pip target appreciation or 1.3370.
Descending Triangle
A descending triangle is the exact opposite pattern of the previous one. It transmits a bearish indication to traders, implying that the instrument price will attempt a downside breakout upon completion. In a descending triangle, the support line is flat and the resistance line is descending. The descending triangle is also regarded to be a continuation pattern, as it usually follows a downward trend line. But again, there are cases that you can detect it after an uptrend.
This pattern suggests that buyers are attempting to push the price higher, but keep on finding resistance. Following their attempts to send the price higher, the buyers get weakened and the sellers overshadow them, a fact that drives the price lower.
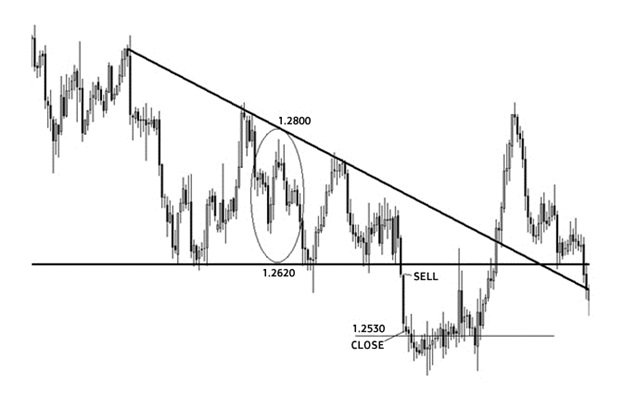
Again, the operating principle is similar to that of the ascending triangle. The sell signal is given after a real breakout has occurred and the price target is set by using the middle part of the triangle and calculating its height in pips, then dividing that number by 2. In our case, the height is equal to 1.2800 – 1.2620= 180 pips. Thus, the maximum target is 90 pips (180/2), and the price target is equal to the breakout point of 1.2620 minus the 90 pips target or 1.2530.
Tip for traders
When trading chart patterns, traders have to be aware of a hidden risk. In technical analysis, chart lines are drawn by traders themselves and this human factor places a certain degree of inaccuracy. While an error equal to several pips on a one-hour chart wouldn’t be so important, an error equal to 15 – 20 pips on a daily chart could have significant financial consequences. Therefore, a trader must take into consideration all possible inaccuracies. In order to avoid such situations, a trader should under-shoot his targets by 5-10%. If, for instance, your anticipated target is 60 pips, enter your trade at the 50-55 level. By doing so, you will give yourself some room for error and keep your greed under control. This tip will pay off in the future and help you take control of your negative emotions.


©2000-2026. Todos los derechos reservados.
El sitio es administrado por Teletrade D.J. LLC 2351 LLC 2022 (Euro House, Richmond Hill Road, Kingstown, VC0100, St. Vincent and the Grenadines).
La información presentada en el sitio, no es una base para tomar decisiones de inversión y es proporcionada sólo con fines informativos.
La empresa no atiende ni presta servicio a clientes residentes en Estados Unidos, Canadá y los países incluidos en la lista negra del FATF.
La realización de operaciones comerciales en los mercados financieros con instrumentos financieros de margen, abre grandes oportunidades y permite a los inversores que estén dispuestos a correr riesgos a obtener altos rendimientos, pero al mismo tiempo conlleva un nivel de riesgo de pérdidas potencialmente alto. Por lo tanto, antes de comenzar a comercializar, se debe tomar de manera responsable a la cuestión de elegir la estrategia de inversión correspondiente, teniendo en cuenta los recursos disponibles.
Uso de información: al usar completamente o parcialmente los materiales del sitio, el enlace a TeleTrade como fuente de información es obligatorio. El uso de materiales en Internet debe ir acompañado de un hipervínculo al sitio teletrade.org. Importación automática de materiales e información del sitio está prohibida.
Para cualquier duda o pregunta, póngase en contacto con pr@teletrade.global.
bancarias