- TeleTrade
- Cooperación
- Noticias
- The ABCs of Continuation Patterns That Work
The ABCs of Continuation Patterns That Work
 Knowing how to use chart patterns is a trader’s bread and butter. Here we look into some of the most popular of them – continuation patterns. Continuation patterns signify that a trend is likely to continue after the pattern is complete. They are formed in the middle of a trend and constitute a pause of varying duration in the price movement. A continuation pattern is deemed complete once the formation has been shaped and breaks out of the pattern, resuming the previous trend. Apart from triangles, the most popular continuation patterns include flags, pennants, rectangles and cup and handles.
Let’s jump right in to learn a bit more about these effective continuation patterns and how to put them into use:
Flags and Pennants
The flag and pennant are two continuation patterns that look a lot like each other, differing only in their shape during the consolidation period. These patterns can be observed when there is a strong, sharp price action followed by sideways movement. The formations are complete when a real breakout occurs in the same direction of the initial trend. The following move will be a similarly sharp move in the same direction as the previous steep move.
Flags and pennants are usually short-term patterns, which can be observed frequently. They indicate a consolidation in the market, suggesting that the previous trend is strong. At the time of formation, the majority of investors continue holding their positions, with almost no exits, a fact that urges more investors to join in the direction of the previous trend.
The Flag
The flag pattern has a rectangular shape, which is formed by two parallel trend lines that operate as support and resistance lines. It represents a short channel, with the trend lines sloping in the opposite direction to that of the prior trend. Therefore, if the initial movement was going up, the flag should be sloping downwards. Volume generally reduces during the formation of the flag. The trading signal is given once the price breaks through the support or resistance level, with the trend continuing in the previous direction. Upon breakout, investors can observe an increase in volume.
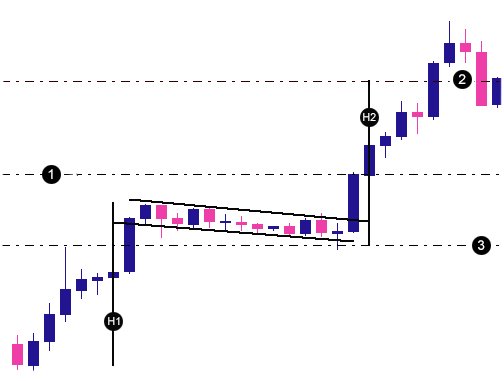
1: Long entry
2: Take profit
3: Stop loss
H1 is the same as H2
The Pennant
A pennant has the same attributes with a flag, with a strong move preceding the formation. The main difference of the two lies in their construction, as the trend lines of a pennant converge, forming a mini triangle, while the trend lines of flags are parallel. In addition, pennants form in a shorter amount of time than flags. A pennant’s sloping trend lines are usually in the opposite direction compared to that of the previous trend and upon breakout, volume increases.
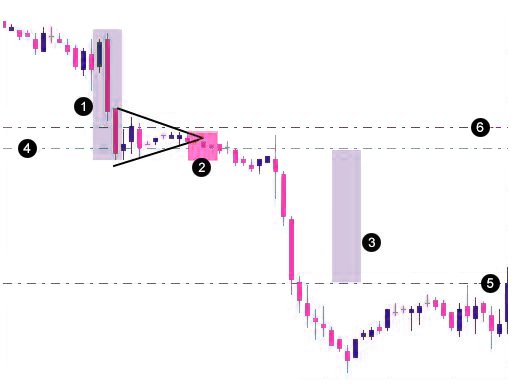
1. Height of the pattern
2. Breakout area
3. Distance from entry to take profit
4: Short entry
5: Take profit
6: Stop loss
In both formations, after a real breakout takes place, price action usually runs immediately, with few throwbacks or pullbacks being present. In an upward trend, the profit target is set by calculating the distance from the beginning of the sharp move to the first reversal point and projecting this distance from the breakout point upwards. A buy position must be opened when the price breaks through the resistance line. The stop loss can be set just below the support line.
Similarly, the target in a downward trend is determined by measuring the distance from the beginning of the steep move to the first reversal point and projecting it from the breakout point downwards. A sell position needs to be opened when the price penetrates the support line. The stop loss can be set just above the resistance line.
Rectangles
Rectangles are shaped when the price moves between two parallel lines that act as support and resistance levels. The price must reach both the support and resistance line at least two times in order to form a rectangle. This is what separates rectangles from double tops and double bottoms, which require the occurrence of only three price reversals. The formation may be slightly sloping upwards or downwards, but the two lines are always parallel, thus appearing like horizontal channels. The pattern is complete when a breakout occurs in line with the initial trend. Rectangles represent traders’ indecisiveness, thus it is highly important to observe the direction of the breakout.
The price may not always touch the support and resistance lines, generating instead shortfalls. At times, the shortfalls may suggest what the direction of the actual breakout could be. Rectangles could also result in fakeouts that mostly occur in the opposite direction to the direction of the real breakout. Rectangles have two types; the bearish and the bullish rectangle.
Bearish rectangle
A bearish rectangle is formed when the pattern is preceded by a downward trend. The price consolidates inside the formation for a certain time period, after which the downward trend resumes. Consolidation appears, probably because a number of sellers lock in their profits, while others wait for small pullbacks to occur in order to enter the market.
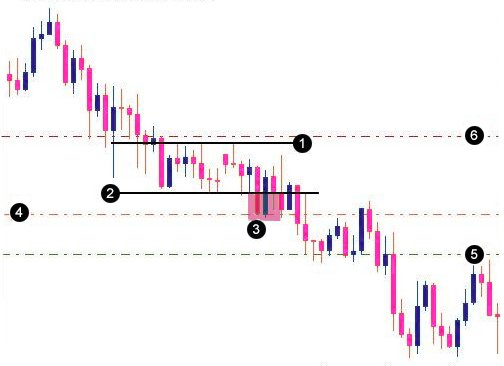
1. Resistance line
2. Support line
3. Breakout area
4. Short entry
5. Take profit
6. Stop loss
Bullish rectangle
The bullish rectangle appears when the price has been trending upwards before the emergence of the formation. The price consolidates for a certain time period and then the upward trend continues. Consolidation emerges as part of the buyers lock in their earnings, while other players wait for small throwbacks to take place in order to open their positions.
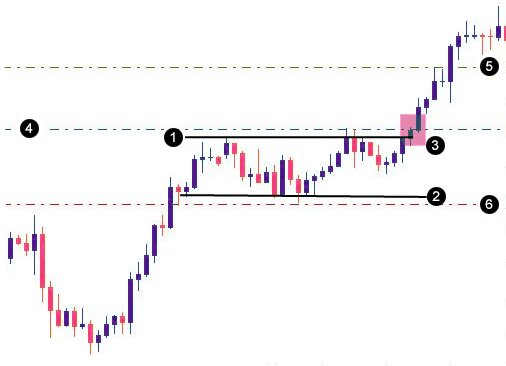
1. Resistance line
2. Support line
3. Breakout area
4. Long entry
5. Take profit
6. Stop loss
Upon real breakout, the target is determined by measuring the distance between the support and resistance line and projecting it in the direction of the breakout. When it comes to bearish rectangles, the distance should be placed below the support line in order to set the profit target, while stop loss could be placed just above the resistance line. In the case of a bullish rectangle, the distance should be set above the resistance line to determine the target, whereas stop loss should be set just below the support line.
Cup and Handle
The cup and handle pattern looks like a tea cap. It is a bullish formation, preceded by an upward move that pauses and trades down for an extended period of time with no clear trend. After that, the price makes an upward move back towards the highs of the prior upward move. Then, it makes a smaller downward move, before moving higher and continuing the initial upward trend.
The first part of the pattern, which is the cup, has a rounding downward turn and the second part – the handle – has a slight downward drift. The handle has low trading volume. As the price attempts to test the old highs, it encounters selling pressure by traders who bought at or near the old high. The selling pressure forces the price to trade sideways with an inclination towards a downtrend for a certain period of time and then it takes off.
There are some tips to help you identify a cup and handle and evaluate the potential trading signal. The first one is length. In general, cups with longer and more “U” shaped bottoms tend to send stronger signals. Cups with steep “V” bottoms should be avoided. Moreover, a trader should pay attention to the depth of the shapes. Handles, as well as cups, should not be too deep. In fact, handles should form in the top half of the cup.
Another indicator is volume. Volume should weaken on decline and remain lower than the average in the base of the cup. Then, when the price starts moving back up to test the old high, it should become stronger. The final thing to take into consideration is retest of the old high. Retest does not need to touch the old high. Nevertheless, the further the top of the handle is away from the highs, the more important the breakout needs to be.
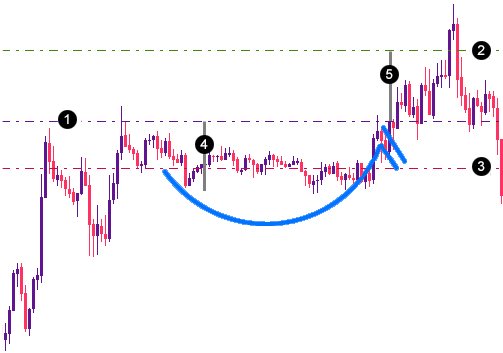
1. Long entry
2. Take profit
3. Stop loss
4. Distance from base to breakout point
5. Same as distance number 4
The signal to open a trade is given after a real breakout above the handle’s resistance line, which is formed by the peaks of the cup. There should be a considerable volume increase upon breakout. The profit target can be set by calculating the distance from the bottom of the cup to the breakout point and projecting it upwards. The stop loss can be set just below the lower bound of the handle.
Summing-up…
Continuation patterns provide some reasoning with regard to the future price movement. They are found mid-trend and signal a continuation of the trend, once the pattern is complete. Knowing how to identify and use these patterns can help an investor to make informed trading decisions and attain considerable profits.


©2000-2026. Todos los derechos reservados.
El sitio es administrado por Teletrade D.J. LLC 2351 LLC 2022 (Euro House, Richmond Hill Road, Kingstown, VC0100, St. Vincent and the Grenadines).
La información presentada en el sitio, no es una base para tomar decisiones de inversión y es proporcionada sólo con fines informativos.
La empresa no atiende ni presta servicio a clientes residentes en Estados Unidos, Canadá y los países incluidos en la lista negra del FATF.
La realización de operaciones comerciales en los mercados financieros con instrumentos financieros de margen, abre grandes oportunidades y permite a los inversores que estén dispuestos a correr riesgos a obtener altos rendimientos, pero al mismo tiempo conlleva un nivel de riesgo de pérdidas potencialmente alto. Por lo tanto, antes de comenzar a comercializar, se debe tomar de manera responsable a la cuestión de elegir la estrategia de inversión correspondiente, teniendo en cuenta los recursos disponibles.
Uso de información: al usar completamente o parcialmente los materiales del sitio, el enlace a TeleTrade como fuente de información es obligatorio. El uso de materiales en Internet debe ir acompañado de un hipervínculo al sitio teletrade.org. Importación automática de materiales e información del sitio está prohibida.
Para cualquier duda o pregunta, póngase en contacto con pr@teletrade.global.
bancarias