- TeleTrade
- Cooperación
- Noticias
- How to trade support and resistance
How to trade support and resistance
 The concepts of support and resistance are without a doubt two of the most significant features of technical analysis that both technicians and fundamentalists take into serious consideration. You will often hear traders discuss about the constant battle between bulls and bears, or the struggle between buyers and sellers. In terms of Forex, this is depicted by the prices an instrument moves above (resistance) or below (support).
This article will attempt to explain the mechanism of these concepts and how to trade them, by highlighting the basics that Forex traders need to know.
What is support and resistance?
As we have learned, the market moves in waves, so every chart will have several tops and bottoms. Technical analysis is based on examining tops and bottoms in quest of support and resistance levels to disclose where and how the instrument is likely to travel. The terms of support and resistance are used by the Forex world to refer to price levels on charts that have a tendency to operate as barriers from impeding the price of an instrument from getting pushed in a certain direction.
The line of support is formed by linking bottoms (support levels), while the line of resistance by connecting tops (resistance levels). In general, these lines can be formed from at least two support and resistance levels (S/R), where their connection generates a price channel. It is a rule of thumb that the more S/R levels form the price channel, the more firm the trend is.
The price will head north until it reaches the line of resistance, at which the price will bounce off and start heading south. The line of resistance prevents the price from going any higher, resisting it and pushing it back. Conversely, the line of support retains a declining price, providing support to it and holding it from falling further. S/R lines act as safety mechanisms to constrain price fluctuations on either side.
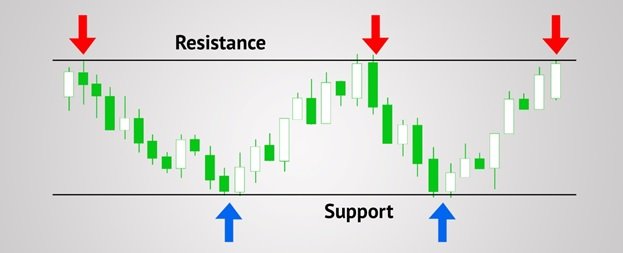
Fig.1: Support and resistance levels
What does support and resistance mean for the market?
A support line acts as a floor, representing the lowest level of a price’s downward movement. It is a level at which selling meets buying activity, as buyers come into the market and price movement loses its dynamic. At this point the buyers’ momentum equals the one of sellers. As buyers become stronger and ultimately overpower the sellers, the price will reverse and rebound back up. These frequently repeated events are regarded by most traders as a signal to open a buy (long) position or as a suitable price target for a formerly opened sell (short) position.
Moving on, as the price continues to climb it will ultimately reach a “ceiling”- the resistance level- , which is the point where the number of buyers equals the number of sellers. Once the sellers overcome the buyers, the price will bounce off the resistance level. As with the support line, but the other way around, this would mark a signal for a sell (short) entry or will indicate a good price target for a previously opened buy (long) position.
S/R levels are based on technical analysis’ most significant premise, which is “history repeats itself”. In a nutshell, support and resistance operation is based on the fact that the market “remembers” prices where the buyers and sellers have a tendency to crowd together. If, for instance, EUR/USD rises to 1.4000 repeatedly and then bounces off lower, the next time it hits that level, the market will remember what happened previously, and buyers and sellers will start opening trades in anticipation of another bounce.
How to trade them?
What history teaches us is that from the line of support the price will go up, while from the line of resistance the price will go down. When translated to trading, this means that a trader should buy from the line of support and sell from the line of resistance. In the event that the price is 30 pips away from the line of support, it might be too early to open a position. It is better to wait until it touches the line or it approaches it by a few pips.
So, if we know where to open a position, we should also know where to close it. Lines of S/R constitute a price range that traders should operate within. If we open a buy position at the line of support, we should lock the profit at the point where the price approaches the line of resistance, as that is where the price will stop rising and reverse direction. The same applies in the opposite scenario; if we sell at resistance, we shall be locking the profit at support.
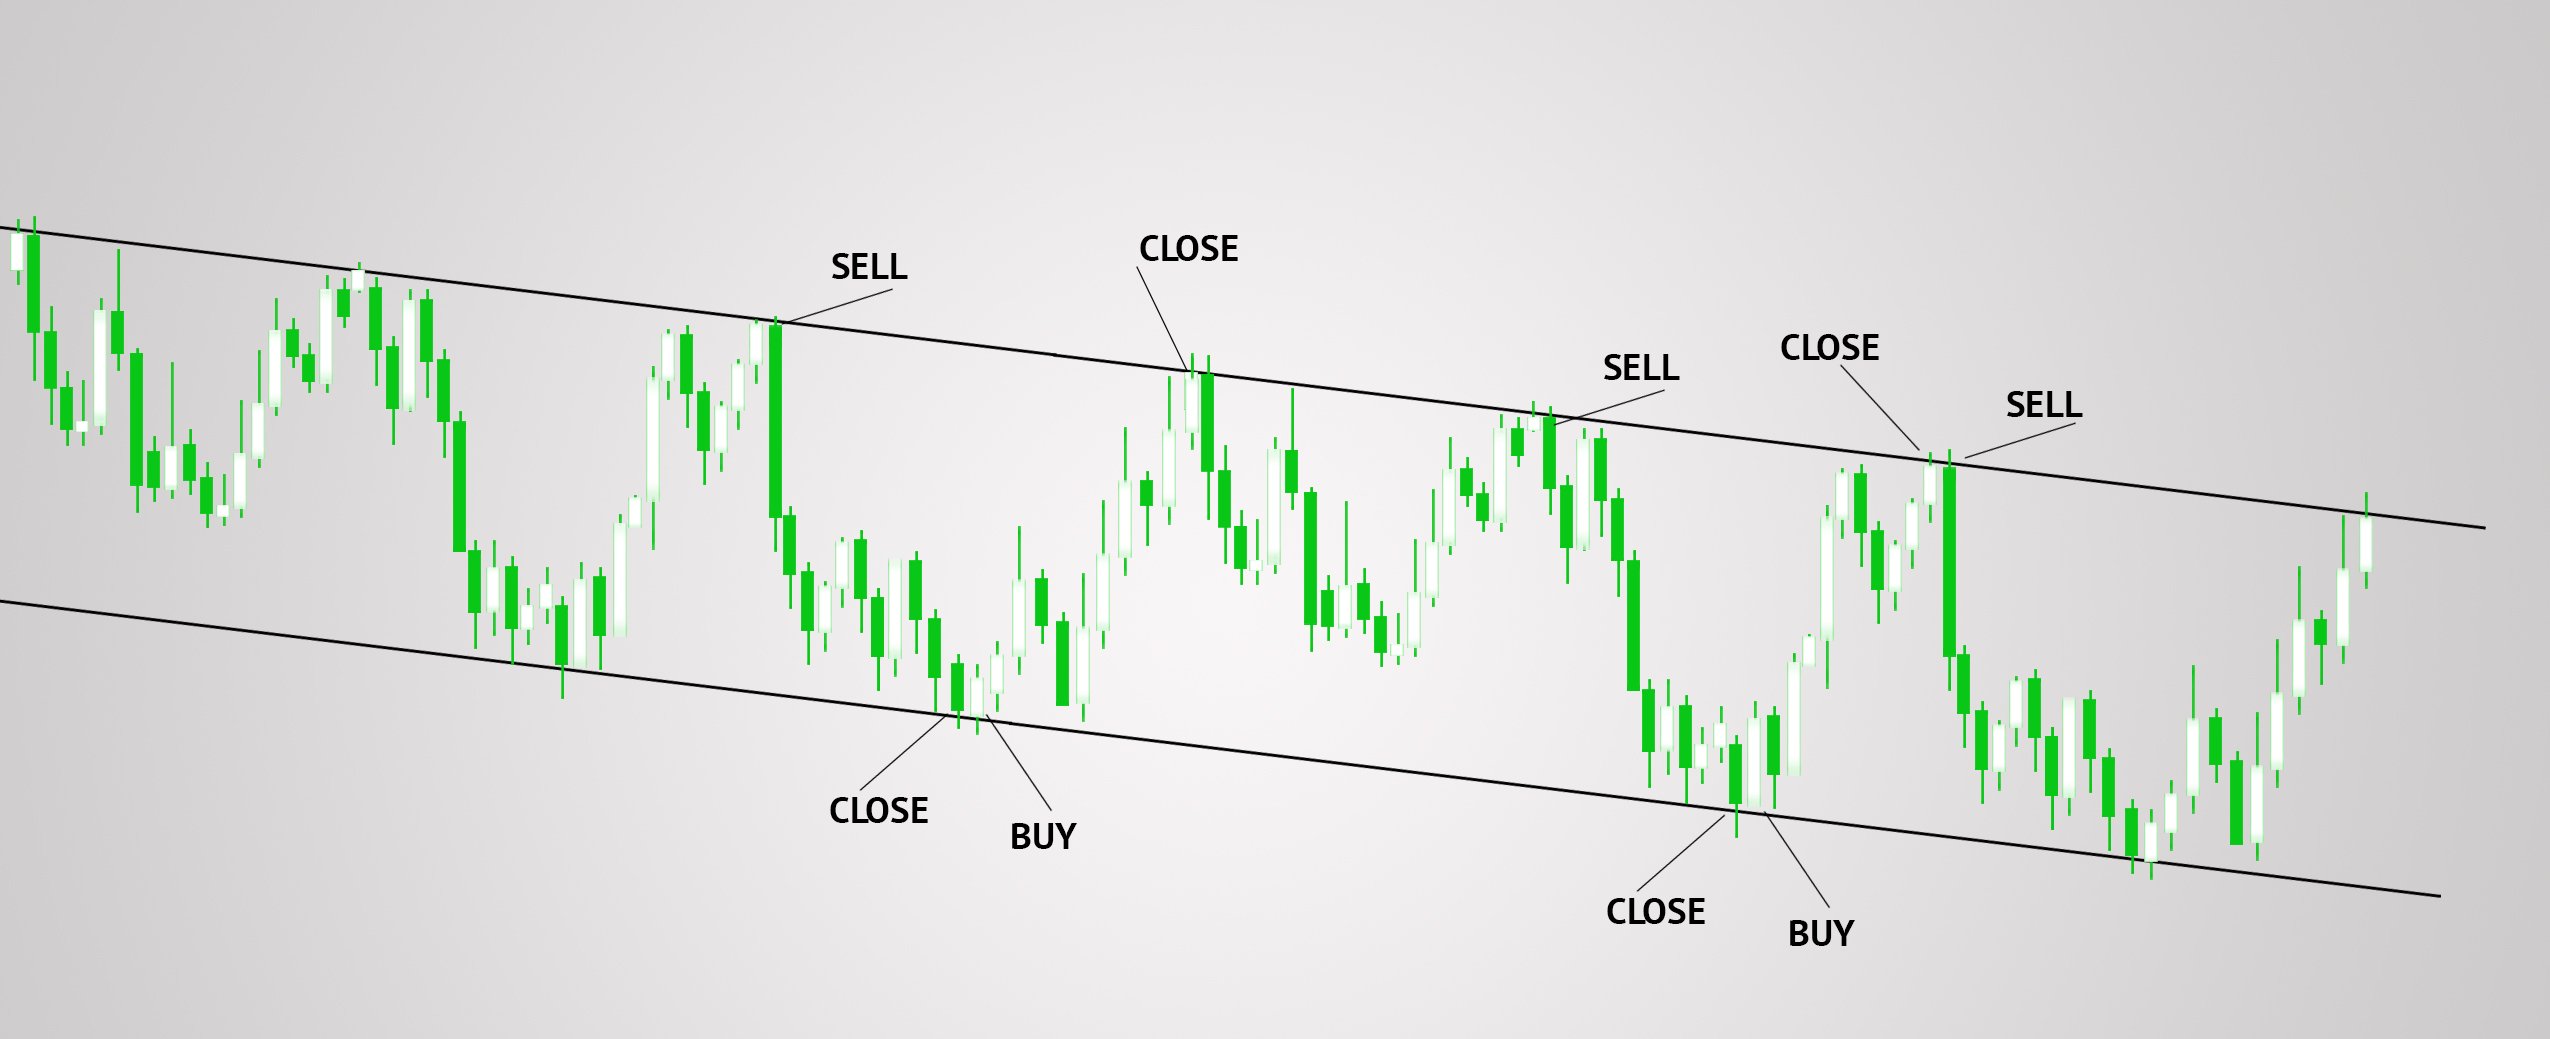
Fig.2: Trades within the price channel
Let us look at an example of trading support and resistance:
The current price is 1.2460 and is touching the resistance line, thus marking a sell signal. Our trader, Jim, who implicitly follows the axiom that history repeats itself, enters a sell (short) position. Then, he closes his position at the price of 1.2380, locking in a profit of 80 pips, as he forecasts that at this level the price will reverse and go up again because of the support line.
Thus, having closed his sell position, he enters a buy (long) order at the price level of 1.2380. Moving on, he attains a 70-pip profit from buying at 1.2450 and opens a short position at 1.2450. Jim locks in a gain of 75 pips and then buys again at 1.2375. He realizes a gain of 65 pips and opens a sell order once more at 1.2440.
Then, he gets a profit of 80 pips and opens a buy position at 1.2360. Again, he locks a gain of 65 points and sells at 1.2425. Finally, he exits at 1.2465 with a loss of 40 pips. At this point, there was a penetration in the line of resistance, as the price broke through the price channel towards new highs. Jim would have probably anticipated a penetration at some point, but if he hadn’t opened any positions in anticipation of the break out, he wouldn’t have realized a profit of 395 pips.
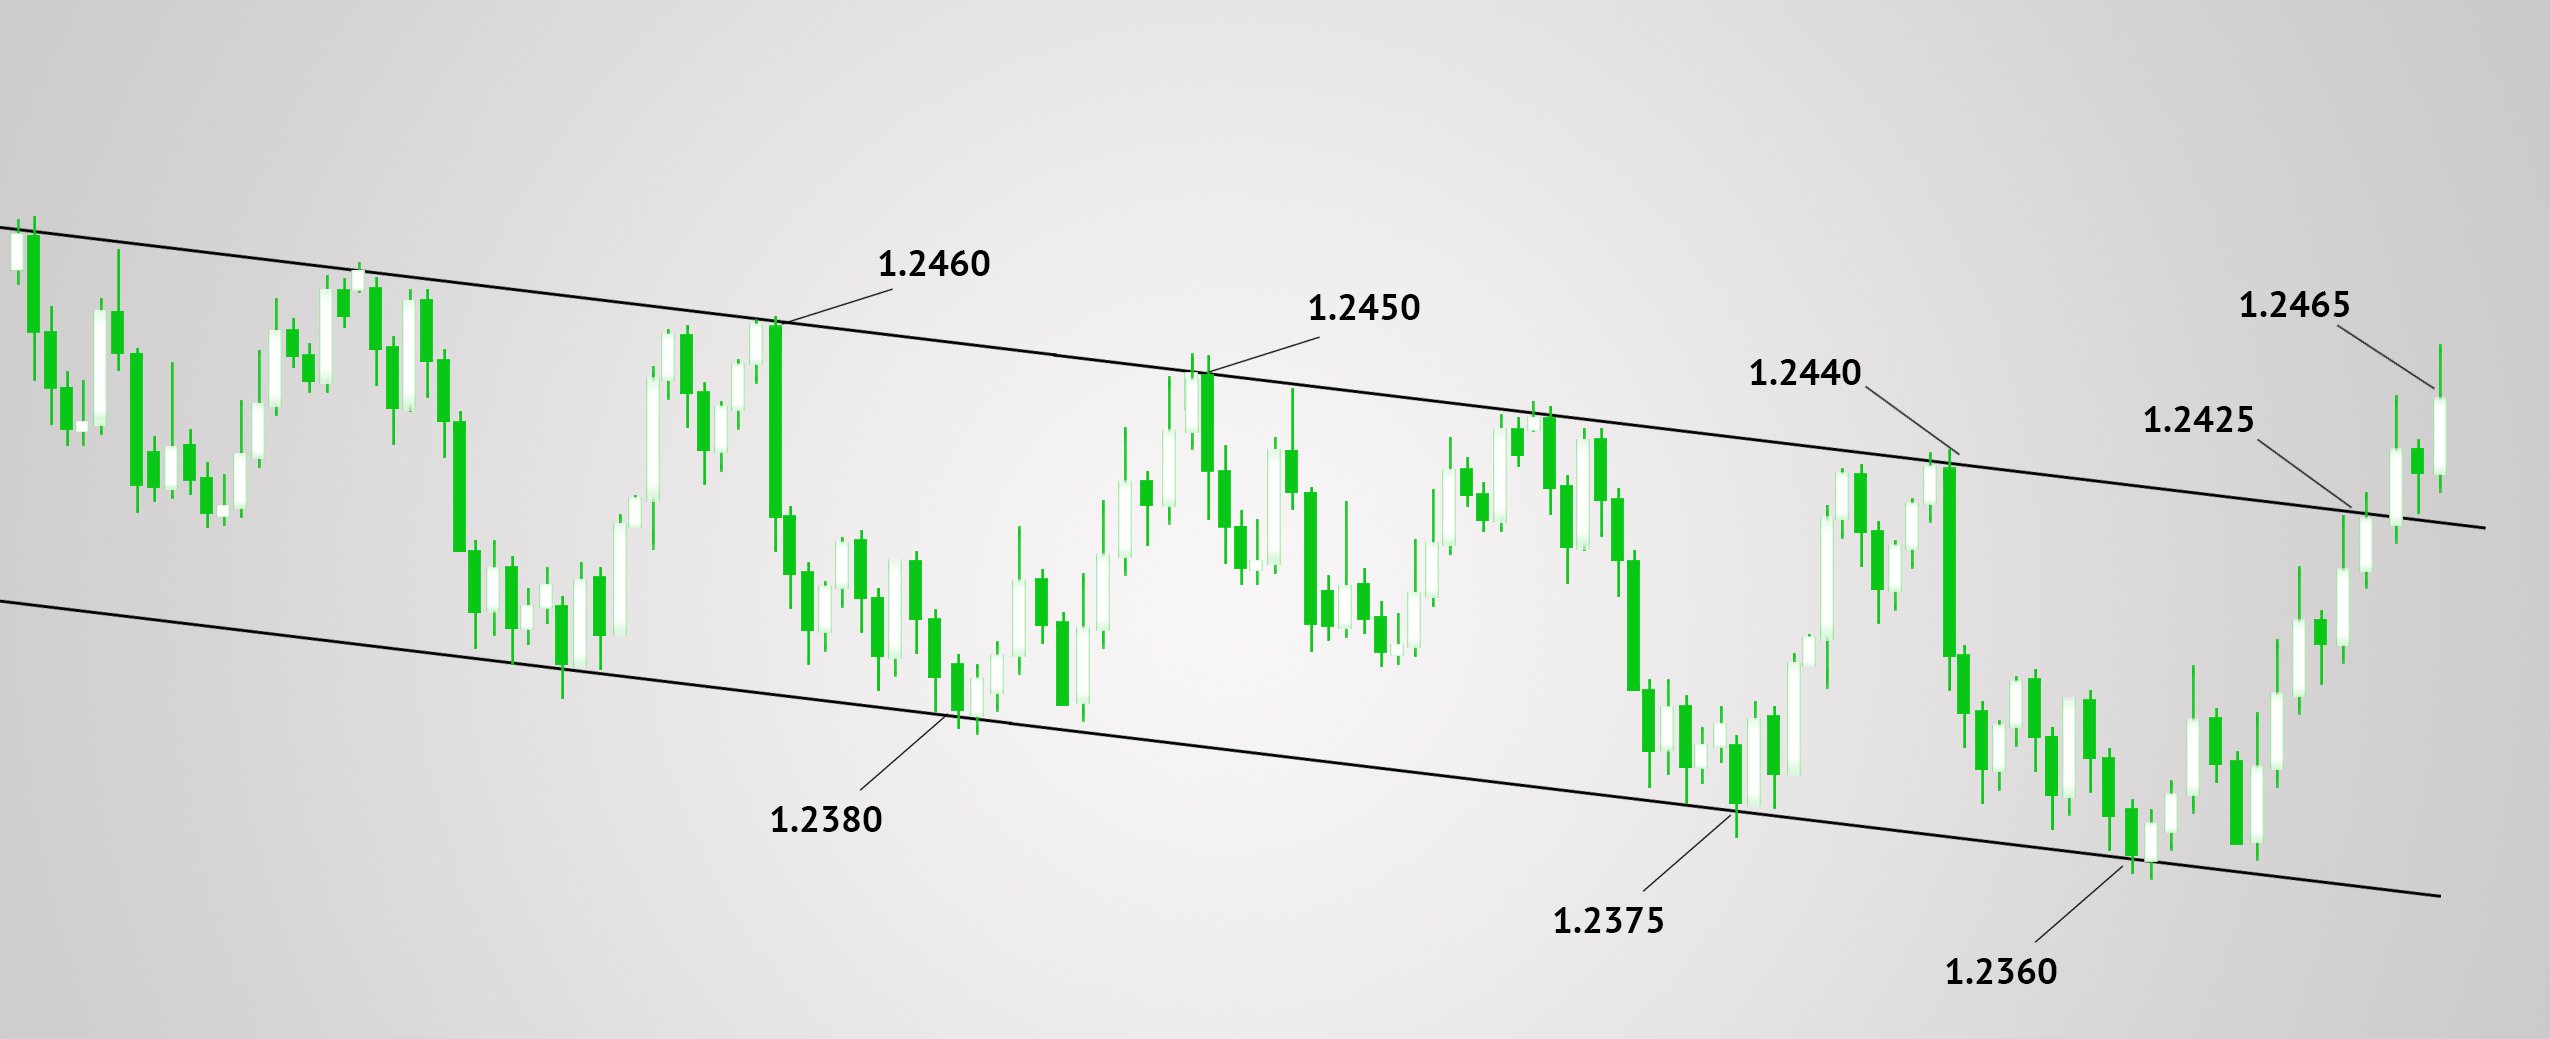
Fig.3: Jim’s transactions
If we summarise his trading activity, we shall see that he made 7 transactions, 6 of which brought a gain of 435 pips (80+70+75+65+80+65) and a loss of 40 pips, for a total net gain of 395 pips. Examining and forecasting in anticipation of a break out is of no value, if you do not act on that information.
Tips for traders:
- Generally, a price level is considered as support or resistance if it has been tested for at least three times.
- S/R levels formed on longer-time frames are regarded stronger and more important. You can begin by analyzing long-term charts and then proceed to shorter-term charts.
- Draw the S/R lines through the edges of congested areas rather than the extreme high or low points. If a trend line can be drawn using the body rather than the wick of a candle, the body should be used.
- If you are trading in the direction of a trend and that trend approaches a S/R level, it is advised to tighten your stop loss in order to safeguard your gains in case the price reverses against your position.
- Round numbers such as EUR/USD 1.3000, 1.3200 and 1.3500 tend to act as S/R levels as well. As most stop loss orders and target prices are set at round price levels, these numbers tend to act as strong price barriers.
- You should know that a line break is only valid if the candlestick/bar closes on the other side of the line.


©2000-2026. Todos los derechos reservados.
El sitio es administrado por Teletrade D.J. LLC 2351 LLC 2022 (Euro House, Richmond Hill Road, Kingstown, VC0100, St. Vincent and the Grenadines).
La información presentada en el sitio, no es una base para tomar decisiones de inversión y es proporcionada sólo con fines informativos.
La empresa no atiende ni presta servicio a clientes residentes en Estados Unidos, Canadá y los países incluidos en la lista negra del FATF.
La realización de operaciones comerciales en los mercados financieros con instrumentos financieros de margen, abre grandes oportunidades y permite a los inversores que estén dispuestos a correr riesgos a obtener altos rendimientos, pero al mismo tiempo conlleva un nivel de riesgo de pérdidas potencialmente alto. Por lo tanto, antes de comenzar a comercializar, se debe tomar de manera responsable a la cuestión de elegir la estrategia de inversión correspondiente, teniendo en cuenta los recursos disponibles.
Uso de información: al usar completamente o parcialmente los materiales del sitio, el enlace a TeleTrade como fuente de información es obligatorio. El uso de materiales en Internet debe ir acompañado de un hipervínculo al sitio teletrade.org. Importación automática de materiales e información del sitio está prohibida.
Para cualquier duda o pregunta, póngase en contacto con pr@teletrade.global.
bancarias