- Analytics
- Market analysis
- Technical Analysis
- USD/JPY is trading near a monthly low
USD/JPY is trading near a monthly low
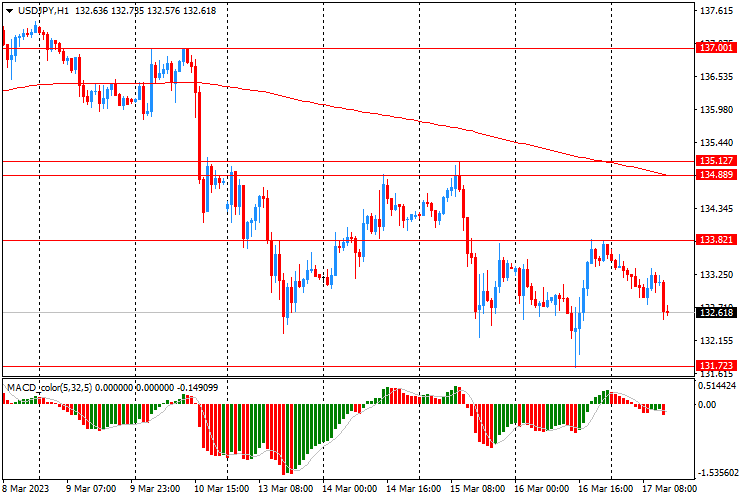
Today, the USD/JPY pair is mainly declining from Y135.50 to Y132.50 and is trading near a new monthly low of Y131.70, reached yesterday. On the hourly chart, the pair remains below the MA (200) H1 (Y134.90) moving average line. On the four-hour chart, the pair is testing MA (200) H4 (Y133.80). Technically speaking, a strong support level of Y131.50-70 can keep prices from further decline. The upper bound of Y134.90-135.10 represents the resistance level.
⦁ Resistance levels are: Y133.80, Y134.90-135.10, Y137.00
⦁ Support levels are: Y131.50-70, Y129.80, Y128.10-20
The main scenario of the pair's promotion assumes a decline to Y131.50-70 (February 14 and March 16 lows).
An alternative scenario assumes a breakout of the resistance of 133.80 (March 16 high) and there may be an increase to Y134.90-135.10 (March 15 high, MA (200) H1).


© 2000-2026. All rights reserved.
This site is managed by Teletrade D.J. LLC 2351 LLC 2022 (Euro House, Richmond Hill Road, Kingstown, VC0100, St. Vincent and the Grenadines).
The information on this website is for informational purposes only and does not constitute any investment advice.
The company does not serve or provide services to customers who are residents of the US, Canada, Iran, The Democratic People's Republic of Korea, Yemen and FATF blacklisted countries.
Making transactions on financial markets with marginal financial instruments opens up wide possibilities and allows investors who are willing to take risks to earn high profits, carrying a potentially high risk of losses at the same time. Therefore you should responsibly approach the issue of choosing the appropriate investment strategy, taking the available resources into account, before starting trading.
Use of the information: full or partial use of materials from this website must always be referenced to TeleTrade as the source of information. Use of the materials on the Internet must be accompanied by a hyperlink to teletrade.org. Automatic import of materials and information from this website is prohibited.
Please contact our PR department if you have any questions or need assistance at pr@teletrade.global.
transfers