- TeleTrade
- Сooperation
- News
- The most reliable reversal patterns to make you money
The most reliable reversal patterns to make you money
 Ever wondered what great traders see that you don’t? If there is a secret trading formula only known to the insiders? Behold, we present three of the most profitable reversal patterns to master that will take you from zero to hero. These chart patterns have been employed successfully for many years, paving the way for sure profits to investors who know how to use them.
Read on to learn how to identify these proven reversal patterns and read charts like a Forex veteran.
1. The Wedge
The wedge pattern usually indicates a reverse of the trend that is being shaped within the pattern. A wedge is similar in structure to a symmetrical triangle, although the wedge’s converging trend lines slope in an either upward or downward course, in contrast to the more homogeneous trend lines of triangles. They also differ in the sense that a wedge is a longer-term formation. Wedges have two types – the rising and the falling –, with their main difference being in the overall slope of the formation.
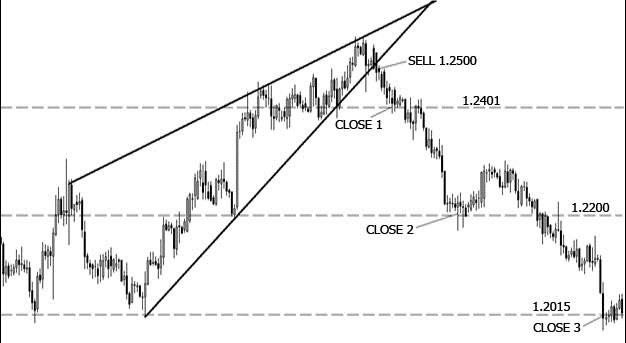
Rising Wedge
A rising wedge is generally considered to be a bearish pattern, indicating that the price is possibly heading downwards. The converging support and resistance lines slope in an upward direction. As the buyers become unable to push the price higher, the sellers start to gain momentum. The pattern is complete when the price drops below the support level and sellers take control of the instrument.
The trading signal appears after a real penetration of the support line. Targets are set in a similar way to the symmetrical triangles, by using the bottoms that form the support line. The first profit taking point will be reached in almost all cases (90%), while the second point will be reached in 75% and the third point in 65% of times.
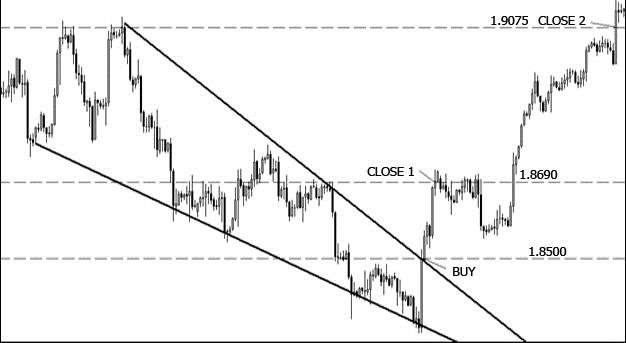
Falling wedge
Conversely, the falling wedge is a bullish pattern, suggesting that the price is likely to break upwards and move into an uptrend. The trend lines converge, with both sloping downwards, as the price is trading in a downtrend. The resistance line of a falling wedge is usually sharper than the support line. A flatter support line indicates that sellers become weakened, as they fail to push the price lower.
The trading signal is given after a real breakout of the resistance line. It is critical to make sure that the price has sequential closes above the resistance line. Targets are set using the peak points that form the line of resistance.
2. Head and Shoulders
The head and shoulders formation is very popular among traders. It is a three-peak pattern that resembles a head with two shoulders. It usually signals an upcoming reversal, suggesting that the price will possibly move against the prior trend. There are two types of the head and shoulders pattern – the standard and the inverse –, both demonstrating a weakening in the trend and a decline of the peaks and troughs.
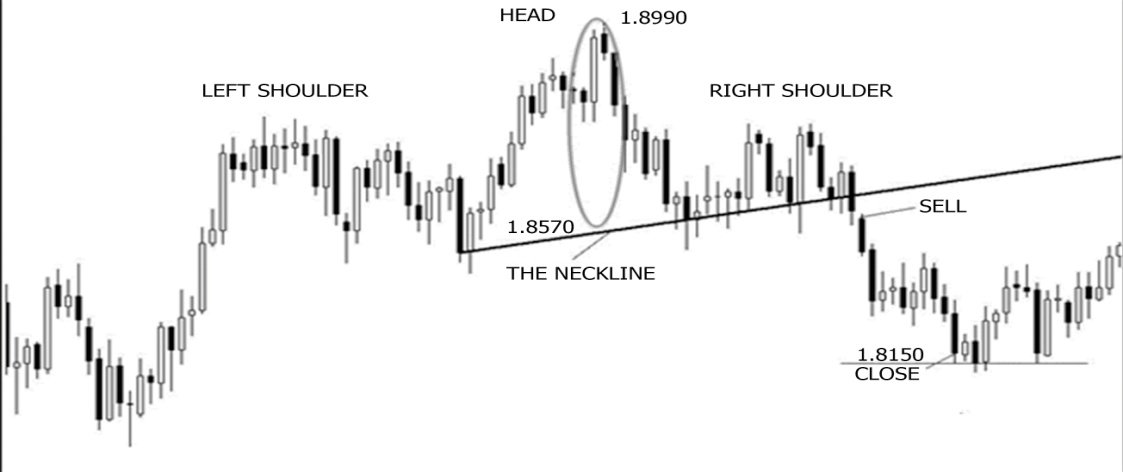
Standard Head and Shoulders
The standard head and shoulders pattern can be found at the peak of an upward trend and it is an indication that the price is set to fall once the formation is complete. The head (central peak) protrudes above the two shoulders (smaller peaks), which are set at the same or very close levels. The line of support for all three peaks is formed by connecting the two lows and it is called the neckline.
The first low point implies that buying demand begins to weaken. Investors who think that the instrument is priced too low respond with a buying delirium, followed by a flood of selling when they reckon the price has gone too high. This fall is followed by another buying streak, which fades out early. At the end, the price drops to its true value below the initial price.
The pattern is confirmed when the neckline is penetrated, after the formation of the second shoulder. It is at this point when most traders would enter into a position. The target is set by calculating the distance between the top of the head and the neckline and projecting it downwards to determine a lower target, in our example 1.8150. After reaching that level, the price is expected to pause and rebound.
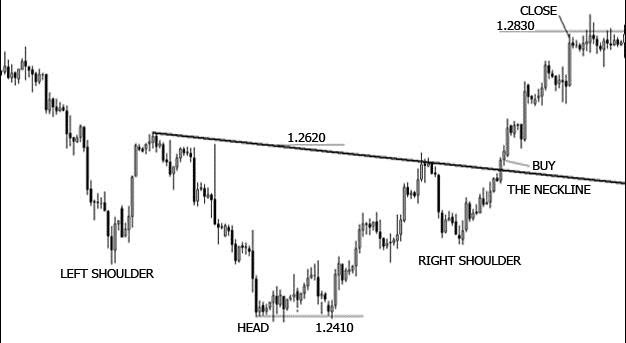
Inverse Head and Shoulders
The inverse head and shoulders formation is shaped during a downward trend and it usually signals that the price is set to rise once the pattern is complete. Similarly to the standard head and shoulders, this pattern is consisted of two shoulders, a head and a neckline, which is the level of resistance.
The inverse head and shoulders pattern is confirmed when the price breaks through the neckline. This is the signal to open a trade. The price target is determined by following the same model as its standard counterpart; by measuring the distance between the head and the neckline and projecting it upwards to set a higher target, in this case 1.2830.
3. Double Top and Double Bottom
The double top and double bottom are two of the most reliable reversal patterns, used to indicate that the current trend may be likely to shift. These two patterns demonstrate a price’s effort to keep travelling in the same trend. After several attempts, though, the trend is reversed. These patters look like a capital ‘M’ for the double top and a ‘W’ for the double bottom.
Double Top
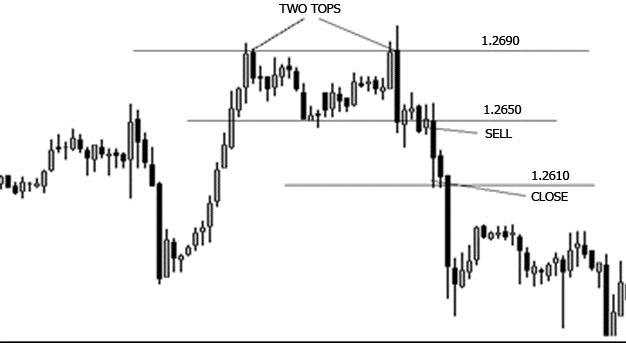
The double top formation is shaped at the highs of an uptrend and it signals that the previous trend is waning and that buyers are losing momentum. At first, the price moves higher, but facing resistance, it retreats to the support level. Then, the price makes another attempt to head to the north, but, failing to break through the line of resistance for the second time, it retraces back to the support level. The pattern is complete when the price penetrates the support level and moves into a new downtrend.
This formation represents the battle between bulls and bears. The buyers are trying to drive the price up, but are finding resistance, which inhibits them to continue the uptrend. After a few attempts, the buyers start to lose momentum and sellers begin to overpower them, pushing the price down towards a new downtrend.
The signal to enter a trade is given after a real penetration of the support line. Traders should check for an increase in volume in order to confirm the penetration. The target will be determined based on the distance from the trough to the top of the highest peak and projecting it downwards. In our example, the position can be closed out at 1.2610 with a profit. This pattern has a high success rate, yielding predicted gains.
Double Bottom
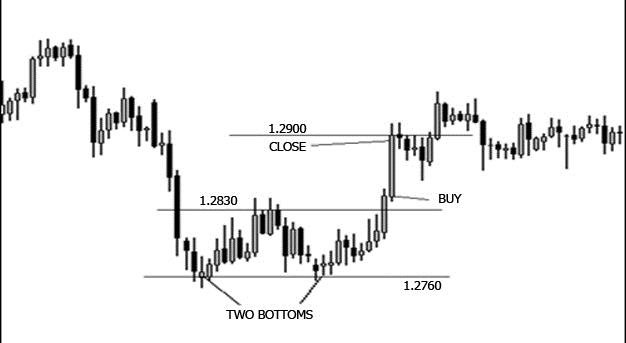
The double bottom is a mirror image of the double top formation, indicating a reverse of the downtrend into an uptrend. This formation comprises a small peak surrounded by two almost equal troughs (not differing by more than 3% or 4%). Double bottom is developed when a downward trend reverses, after attempting to reach a support level twice. As it fails to break down, the price reverses into a new upward trend.
The signal to open a position is given upon a breakout of the resistance line, which is drawn through the peak that connects the two troughs. The target is set by following the same model as with the double top pattern; measuring the distance from the peak to the bottom of the lowest trough and projecting it upwards. In this case, a trader could lock in a gain at 1.2900.
Mastering the patterns
These patterns are some of the most time-tested strategies in Forex. By using them, you can feel secure that you trust your money to a simple, yet highly-refined system. By using the right tools, you will soon realize that making consistent profit is not a privilege of the few…


© 2000-2026. All rights reserved.
This site is managed by Teletrade D.J. LLC 2351 LLC 2022 (Euro House, Richmond Hill Road, Kingstown, VC0100, St. Vincent and the Grenadines).
The information on this website is for informational purposes only and does not constitute any investment advice.
The company does not serve or provide services to customers who are residents of the US, Canada, Iran, The Democratic People's Republic of Korea, Yemen and FATF blacklisted countries.
Making transactions on financial markets with marginal financial instruments opens up wide possibilities and allows investors who are willing to take risks to earn high profits, carrying a potentially high risk of losses at the same time. Therefore you should responsibly approach the issue of choosing the appropriate investment strategy, taking the available resources into account, before starting trading.
Use of the information: full or partial use of materials from this website must always be referenced to TeleTrade as the source of information. Use of the materials on the Internet must be accompanied by a hyperlink to teletrade.org. Automatic import of materials and information from this website is prohibited.
Please contact our PR department if you have any questions or need assistance at pr@teletrade.global.
transfers