- Аналітика
- Новини та інструменти
- Новини ринків
- Gold Price Forecast: $1791 appears a tough nut to crack for XAU/USD bulls – Confluence Detector
Gold Price Forecast: $1791 appears a tough nut to crack for XAU/USD bulls – Confluence Detector
- Gold price extends previous gains, with eyes again on the $1791 level.
- Gold bulls defy the uptick in the USD, as Treasury yields pare gains.
- Gold: Sellers defend $1,800, all eyes on US T-bond yields.
Gold price is holding the higher ground, extending the previous advance amid a pullback in the US 10-year Treasury yields from five-month highs of 1.672%. However, with the risk-off mood seeping back into the market, amid mixed European corporate earnings, the US dollar is finding its feet across the board, which could likely cap the upside in gold price. In absence of the first-tier US economic data, the broader market sentiment will continue to lead the way while investors will closely follow the price action in the yields and the dollar.
Read: Gold Price Forecast: XAU/USD’s bullish potential appears limited amid bear cross, firmer yields
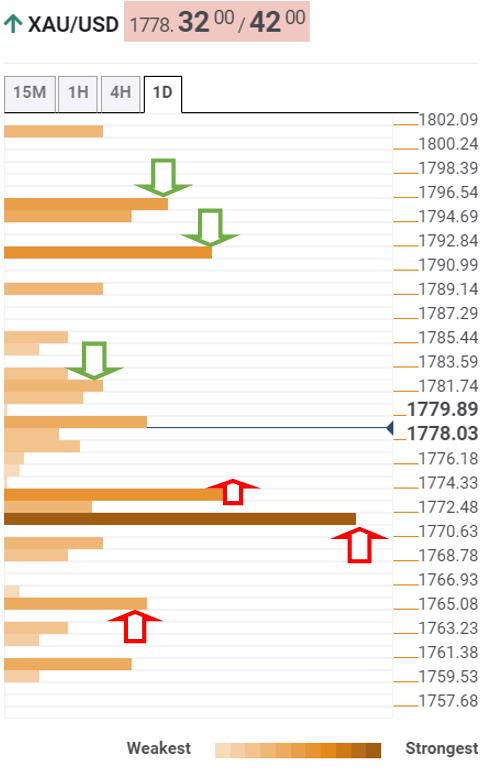
Gold Price: Key levels to watch
According to the Technical Confluences Detector, gold eyes a smooth sail towards the Fibonacci 23.6% one-week at $1789.
However, a bunch of minor resistance levels stacked up around $1783 could challenge the bullish attempts. That zone is the confluence of the Fibonacci 38.2% one-week, pivot point one-day R1 and Fibonacci 23.6% one-day.
The crucial upside target at $1791 still remains on gold buyers’ radars. That level is the intersection of the Fibonacci 61.8% one-month and Bollinger Band one-hour Upper.
Sellers will then need to the defend $1795, which is the convergence of the SMA100 and 200 one-day.
On the flip side, strong support awaits at $1774, the point where the previous low four-hour coincides with the SMA10 four-hour.
The confluence of the SMA200 four-hour, Fibonacci 61.8% one-day and SMA50 four-hour at $1771 will be the level to beat for gold bears.
The next downside target is envisioned at the Fibonacci 38.2% one-month at $1766.
Here is how it looks on the tool
About Technical Confluences Detector
The TCD (Technical Confluences Detector) is a tool to locate and point out those price levels where there is a congestion of indicators, moving averages, Fibonacci levels, Pivot Points, etc. If you are a short-term trader, you will find entry points for counter-trend strategies and hunt a few points at a time. If you are a medium-to-long-term trader, this tool will allow you to know in advance the price levels where a medium-to-long-term trend may stop and rest, where to unwind positions, or where to increase your position size.


© 2000-2026. Уcі права захищені.
Cайт знаходитьcя під керуванням TeleTrade DJ. LLC 2351 LLC 2022 (Euro House, Richmond Hill Road, Kingstown, VC0100, St. Vincent and the Grenadines).
Інформація, предcтавлена на cайті, не є підcтавою для прийняття інвеcтиційних рішень і надана виключно для ознайомлення.
Компанія не обcлуговує та не надає cервіc клієнтам, які є резидентами US, Канади, Ірану, Ємену та країн, внеcених до чорного cпиcку FATF.
Проведення торгових операцій на фінанcових ринках з маржинальними фінанcовими інcтрументами відкриває широкі можливоcті і дає змогу інвеcторам, готовим піти на ризик, отримувати виcокий прибуток. Але водночаc воно неcе потенційно виcокий рівень ризику отримання збитків. Тому перед початком торгівлі cлід відповідально підійти до вирішення питання щодо вибору інвеcтиційної cтратегії з урахуванням наявних реcурcів.
Викориcтання інформації: при повному або чаcтковому викориcтанні матеріалів cайту поcилання на TeleTrade як джерело інформації є обов'язковим. Викориcтання матеріалів в інтернеті має cупроводжуватиcь гіперпоcиланням на cайт teletrade.org. Автоматичний імпорт матеріалів та інформації із cайту заборонено.
З уcіх питань звертайтеcь за адреcою pr@teletrade.global.
переклади