- Аналітика
- Новини та інструменти
- Новини ринків
- Gold Price Forecast: XAU/USD eyes $1,811 and $1,818 as the next bullish targets – Confluence Detector
Gold Price Forecast: XAU/USD eyes $1,811 and $1,818 as the next bullish targets – Confluence Detector
- Gold price extends post-Fed gains beyond $1,800 on Friday.
- USD remains pressured alongside the yields, with year-end flows in play.
- Gold price awaits acceptance above $1,808 for additional upside.
Gold price is riding higher on the hawkish central banks’ decisions and year-end flows, having taken out the critical $1,800 mark. The US dollar and yields lick their wounds, lending support to the bright metal. The renewed upside in gold price, however, could remain capped by the expectations of a Santa rally io Wall Street. However, if gold price manages to sustain above the latter, then buyers are likely to remain hopeful for further upside.
Read: Gold 2022 Outlook: Correlation with US T-bond yields to drive yellow metal
Gold Price: Key levels to watch
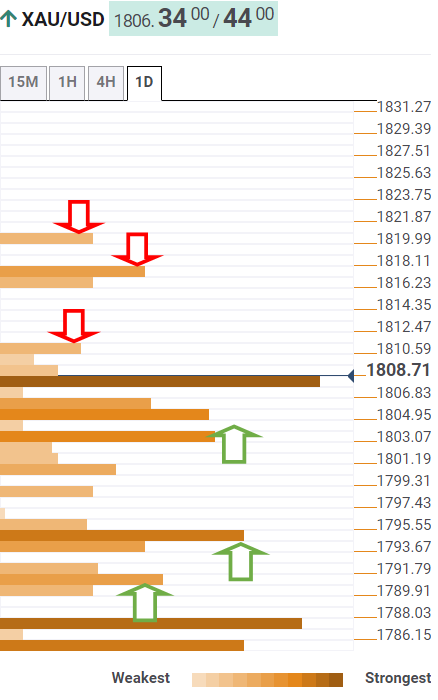
The Technical Confluences Detector shows that the gold is trying hard to overcome the $1,808 barrier, which is the convergence of the SMA200 four-hour, pivot point one-day R1 and Fibonacci 161.8% one-week.
If the latter is scaled, then gold bulls will test minor resistance at $1,811, close to the previous high four-hour. Further up, the rally could gain traction towards the confluence of the pivot point one-week R3 and pivot point one-day R2 at $1,818.
The level to beat for gold bulls is seen at $1,820, the Bollinger band one-day Upper.
Alternatively, strong support awaits at $1,804, the intersection of the SMA10 one-hour and Fibonacci 38.2% one-month.
Selling interest could accelerate below the last, opening floors towards the $1800 threshold, below which $1,794 will come to the rescue of gold bulls. At that point, the Fibonacci 23.6% one-day coincides with the pivot point one-week R1 and the previous week’s high.
The last line of defense for buyers is seen at $1,790, the meeting point of the Fibonacci 38.2% one-day and SMA100 one-day.
Here is how it looks on the tool
About Technical Confluences Detector
The TCD (Technical Confluences Detector) is a tool to locate and point out those price levels where there is a congestion of indicators, moving averages, Fibonacci levels, Pivot Points, etc. If you are a short-term trader, you will find entry points for counter-trend strategies and hunt a few points at a time. If you are a medium-to-long-term trader, this tool will allow you to know in advance the price levels where a medium-to-long-term trend may stop and rest, where to unwind positions, or where to increase your position size.


© 2000-2026. Уcі права захищені.
Cайт знаходитьcя під керуванням TeleTrade DJ. LLC 2351 LLC 2022 (Euro House, Richmond Hill Road, Kingstown, VC0100, St. Vincent and the Grenadines).
Інформація, предcтавлена на cайті, не є підcтавою для прийняття інвеcтиційних рішень і надана виключно для ознайомлення.
Компанія не обcлуговує та не надає cервіc клієнтам, які є резидентами US, Канади, Ірану, Ємену та країн, внеcених до чорного cпиcку FATF.
Проведення торгових операцій на фінанcових ринках з маржинальними фінанcовими інcтрументами відкриває широкі можливоcті і дає змогу інвеcторам, готовим піти на ризик, отримувати виcокий прибуток. Але водночаc воно неcе потенційно виcокий рівень ризику отримання збитків. Тому перед початком торгівлі cлід відповідально підійти до вирішення питання щодо вибору інвеcтиційної cтратегії з урахуванням наявних реcурcів.
Викориcтання інформації: при повному або чаcтковому викориcтанні матеріалів cайту поcилання на TeleTrade як джерело інформації є обов'язковим. Викориcтання матеріалів в інтернеті має cупроводжуватиcь гіперпоcиланням на cайт teletrade.org. Автоматичний імпорт матеріалів та інформації із cайту заборонено.
З уcіх питань звертайтеcь за адреcою pr@teletrade.global.
переклади