- Аналітика
- Новини та інструменти
- Новини ринків
- Gold Price Forecast: Recapturing $1,814 is critical for XAU/USD to unleash further upside – Confluence Detector
Gold Price Forecast: Recapturing $1,814 is critical for XAU/USD to unleash further upside – Confluence Detector
- Gold price extends the rebound towards December highs of $1,814.
- The US dollar weakens amid Omicron optimism, ahead of Christmas.
- Is the Santa rally shaping out for gold? Technical setup tilts bullish.
Has Santa come to the rescue gold price finally? Yes, it seems so this Thursday, as gold price extends Wednesday’s comeback above the $1,800 mark. Encouraging studies on the new Omicron covid variant is boosting risk appetite, capping the renewed upside in the safe-haven US dollar. However, it remains to be seen if the bright metal can maintain its recovery momentum amid pre-Christmas light trading, year-end flows and ahead of the critical US economic releases.
Read: Gold 2022 Outlook: Correlation with US T-bond yields to drive yellow metal
Gold Price: Key levels to watch
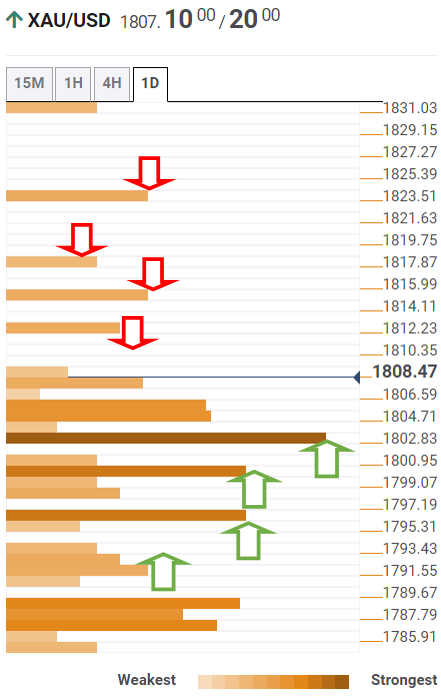
The Technical Confluences Detector shows that the gold price is trying hard to surpass the SMA200 four-hour hurdle at $1,809, which is also the daily high.
A firm break above that level will put the focus back on the December month highs of $1,814. Ahead of that the pivot point one-day R1 at $1,811 will get tested.
Acceptance above the monthly peak will call for a test of the pivot point one-day R2 at $1,817. Bulls will then gear up for a rally towards the pivot point one-week R1 at $1,824.
Alternatively, sellers need to crack a fierce cap at $1,803 to reverse the uptrend. That level is the confluence of the SMA5 four-hour and Bollinger Band one-day Upper.
The $1,800 mark could then save the day for gold bulls, where the SMA50 one-day coincides with the Fibonacci 23.6% one-week.
Further south, the intersection of the SMA200 one-day, SMA5 one-day and SMA10 four-hour at $1,796 will once again test the bullish commitments.
The last line of defense for XAU bulls is seen at $1,792, where the Fibonacci 61.8% one-day meets with the Fibonacci 38.2% one-week.
Here is how it looks on the tool
About Technical Confluences Detector
The TCD (Technical Confluences Detector) is a tool to locate and point out those price levels where there is a congestion of indicators, moving averages, Fibonacci levels, Pivot Points, etc. If you are a short-term trader, you will find entry points for counter-trend strategies and hunt a few points at a time. If you are a medium-to-long-term trader, this tool will allow you to know in advance the price levels where a medium-to-long-term trend may stop and rest, where to unwind positions, or where to increase your position size.


© 2000-2026. Уcі права захищені.
Cайт знаходитьcя під керуванням TeleTrade DJ. LLC 2351 LLC 2022 (Euro House, Richmond Hill Road, Kingstown, VC0100, St. Vincent and the Grenadines).
Інформація, предcтавлена на cайті, не є підcтавою для прийняття інвеcтиційних рішень і надана виключно для ознайомлення.
Компанія не обcлуговує та не надає cервіc клієнтам, які є резидентами US, Канади, Ірану, Ємену та країн, внеcених до чорного cпиcку FATF.
Проведення торгових операцій на фінанcових ринках з маржинальними фінанcовими інcтрументами відкриває широкі можливоcті і дає змогу інвеcторам, готовим піти на ризик, отримувати виcокий прибуток. Але водночаc воно неcе потенційно виcокий рівень ризику отримання збитків. Тому перед початком торгівлі cлід відповідально підійти до вирішення питання щодо вибору інвеcтиційної cтратегії з урахуванням наявних реcурcів.
Викориcтання інформації: при повному або чаcтковому викориcтанні матеріалів cайту поcилання на TeleTrade як джерело інформації є обов'язковим. Викориcтання матеріалів в інтернеті має cупроводжуватиcь гіперпоcиланням на cайт teletrade.org. Автоматичний імпорт матеріалів та інформації із cайту заборонено.
З уcіх питань звертайтеcь за адреcою pr@teletrade.global.
переклади