- Аналітика
- Новини та інструменти
- Новини ринків
- Gold Price Forecast: XAU/USD pierces $1,800 hurdle ahead of US ISM PMI – Confluence Detector
Gold Price Forecast: XAU/USD pierces $1,800 hurdle ahead of US ISM PMI – Confluence Detector
- Gold crosses immediate resistance to consolidate the heaviest weekly loss since late November.
- Mixed Fedspeak weighs on USD, yields but inflation fears keep risk-off mood on the table, challenging gold buyers.
- Gold buyers stay hopeful unless staying beyond $1,781 key support.
- Gold Price Forecast: XAU/USD bears have the upper hand below 200-DMA, around $1,805 area
Gold (XAU/USD) extends the previous day’s recovery moves from a six-week low while piercing the $1,800 as markets brace for the key weekly events during early Tuesday.
In doing so, the gold buyers cheer broad US dollar weakness and sluggish yields, despite inflation fears, to consolidate the last week’s losses, the biggest since late November.
The US Dollar Index (DXY) drops 0.09% intraday around 96.55 after portraying the biggest daily loss in a month. The greenback bears are likely to have benefited from the US Federal Reserve (Fed) policymaker’s hesitance in supporting the rate hike trajectory, despite conveying inflation fears.
Additionally, comments from the OECD Secretary-General Mathias Cormann and WTI Head cited inflation fears, which in turn underpin gold prices amid USD weakness ahead of the US ISM Manufacturing PMI for January, expected 57.5 versus 58.7 prior.
Read: ISM Manufacturing PMI January Preview: Fed policy counts on a continuing US expansion
Gold Price: Key levels to watch
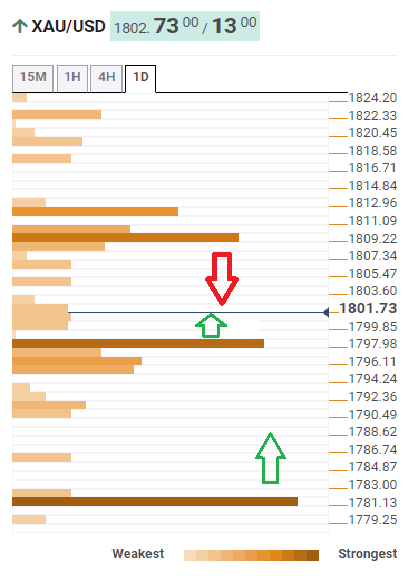
The Technical Confluences Detector shows that the gold prices recently cross the short-term key hurdle around $1,798-99 comprising the Fibonacci 23.6% level on one-month and one-week both.
That said, the upside momentum currently aims for a 38.2% Fibonacci retracement level near $1,810 before the SMA 200 on 4H, close to $1,812, challenging the XAU/USD bulls.
It’s worth noting that the $1,812 acts as a last line of defense for gold sellers, a break of which will renew bullish bias for the precious metal.
On the flip side, a clear break of the $1,799 resistance-turned-support will need validation from the 100-SMA one-day, close to $1,796, to recall the gold sellers.
Following that, pivot point one-day S2 and lower bank of the Bollinger on one-day will become crucial support around $1,781 to watch.
Here is how it looks on the tool
About Technical Confluences Detector
The TCD (Technical Confluences Detector) is a tool to locate and point out those price levels where there is a congestion of indicators, moving averages, Fibonacci levels, Pivot Points, etc. If you are a short-term trader, you will find entry points for counter-trend strategies and hunt a few points at a time. If you are a medium-to-long-term trader, this tool will allow you to know in advance the price levels where a medium-to-long-term trend may stop and rest, where to unwind positions, or where to increase your position size.


© 2000-2026. Уcі права захищені.
Cайт знаходитьcя під керуванням TeleTrade DJ. LLC 2351 LLC 2022 (Euro House, Richmond Hill Road, Kingstown, VC0100, St. Vincent and the Grenadines).
Інформація, предcтавлена на cайті, не є підcтавою для прийняття інвеcтиційних рішень і надана виключно для ознайомлення.
Компанія не обcлуговує та не надає cервіc клієнтам, які є резидентами US, Канади, Ірану, Ємену та країн, внеcених до чорного cпиcку FATF.
Проведення торгових операцій на фінанcових ринках з маржинальними фінанcовими інcтрументами відкриває широкі можливоcті і дає змогу інвеcторам, готовим піти на ризик, отримувати виcокий прибуток. Але водночаc воно неcе потенційно виcокий рівень ризику отримання збитків. Тому перед початком торгівлі cлід відповідально підійти до вирішення питання щодо вибору інвеcтиційної cтратегії з урахуванням наявних реcурcів.
Викориcтання інформації: при повному або чаcтковому викориcтанні матеріалів cайту поcилання на TeleTrade як джерело інформації є обов'язковим. Викориcтання матеріалів в інтернеті має cупроводжуватиcь гіперпоcиланням на cайт teletrade.org. Автоматичний імпорт матеріалів та інформації із cайту заборонено.
З уcіх питань звертайтеcь за адреcою pr@teletrade.global.
переклади