- Аналітика
- Новини та інструменти
- Новини ринків
- Gold Price Forecast: XAU/USD nears the wall of resistance at $1,810 ahead of US NFP – Confluence Detector
Gold Price Forecast: XAU/USD nears the wall of resistance at $1,810 ahead of US NFP – Confluence Detector
- Gold seesaws around weekly tops after Thursday’s central bank actions renewed bullish bias.
- US dollar needs positive surprise from NFP to justify firmer yields, risk catalysts are important too.
- US January Nonfarm Payrolls Preview: Analyzing gold's reaction to NFP surprises
Gold (XAU/USD) returns to the buyer’s plate, after a brief disappearance, as upbeat equities join the US dollar south-run to keep the yellow metal above $1,800. Also contributing to the metal’s bullish bias is the rush towards risk-safety amid inflation fears, flagged recently by the ECB and the BOE.
In doing so, the precious metal consolidates the previous week’s losses, the heaviest weekly fall since November, with eyes on the US jobs report for January. Also important are the geopolitical fears surrounding Russia as Moscow warns the West to not escalate tensions.
Read: Gold ended January glued to $1,800. will it ever detach?
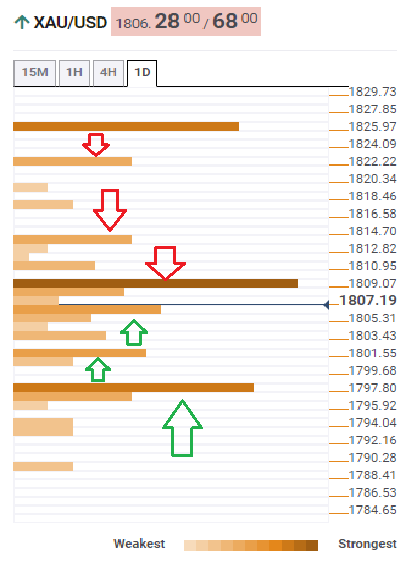
Gold Price: Key levels to watch
The Technical Confluences Detector shows that the gold price floats around a powerful resistance near $1,809, the intersection of the previous day’s high and Fibonacci 38.2% of the weekly and monthly ranges.
Should the bulls manage to conquer the stated resistance, SMA10 one-day and the first resistance on the daily Pivot Points will test the upside momentum around $1,812.
During the quote’s upside past $1,812, the second resistance on the daily Pivot Points and 161.8% Fibonacci retracement on one-day, around $1,823, will act as an intermediate halt before highlighting the last defense for the bears surrounding $1,826 that includes Fibonacci 61.8% of the weekly and monthly moves.
Alternatively, the immediate downside cushion is seen at the $1,807 level that comprises 200-DMA and SMA10 on 4H.
Following that, 100-DMA and Fibonacci 61.8% one-day will challenge the bears around $1,801.
However, major attention is given to the $1,797 level comprising Fibonacci 23.6% of the weekly and monthly trading performance.
To sum up, gold buyers keep reins but a clear upside break of $1,809 becomes necessary for further ruling.
Here is how it looks on the tool
About Technical Confluences Detector
The TCD (Technical Confluences Detector) is a tool to locate and point out those price levels where there is a congestion of indicators, moving averages, Fibonacci levels, Pivot Points, etc. If you are a short-term trader, you will find entry points for counter-trend strategies and hunt a few points at a time. If you are a medium-to-long-term trader, this tool will allow you to know in advance the price levels where a medium-to-long-term trend may stop and rest, where to unwind positions, or where to increase your position size.


© 2000-2026. Уcі права захищені.
Cайт знаходитьcя під керуванням TeleTrade DJ. LLC 2351 LLC 2022 (Euro House, Richmond Hill Road, Kingstown, VC0100, St. Vincent and the Grenadines).
Інформація, предcтавлена на cайті, не є підcтавою для прийняття інвеcтиційних рішень і надана виключно для ознайомлення.
Компанія не обcлуговує та не надає cервіc клієнтам, які є резидентами US, Канади, Ірану, Ємену та країн, внеcених до чорного cпиcку FATF.
Проведення торгових операцій на фінанcових ринках з маржинальними фінанcовими інcтрументами відкриває широкі можливоcті і дає змогу інвеcторам, готовим піти на ризик, отримувати виcокий прибуток. Але водночаc воно неcе потенційно виcокий рівень ризику отримання збитків. Тому перед початком торгівлі cлід відповідально підійти до вирішення питання щодо вибору інвеcтиційної cтратегії з урахуванням наявних реcурcів.
Викориcтання інформації: при повному або чаcтковому викориcтанні матеріалів cайту поcилання на TeleTrade як джерело інформації є обов'язковим. Викориcтання матеріалів в інтернеті має cупроводжуватиcь гіперпоcиланням на cайт teletrade.org. Автоматичний імпорт матеріалів та інформації із cайту заборонено.
З уcіх питань звертайтеcь за адреcою pr@teletrade.global.
переклади