- Аналітика
- Новини та інструменти
- Новини ринків
- Gold Price Forecast: XAU/USD keeps March lows of $1,902 and the Fed in focus – Confluence Detector
Gold Price Forecast: XAU/USD keeps March lows of $1,902 and the Fed in focus – Confluence Detector
- The pullback in US Treasury yields seems to offer a brief reprieve to gold bulls.
- The US dollar drops with yields but the Ukraine uncertainty to keep downside limited.
- Gold Price eyes monthly lows near $1,900, as focus shifts to Fed.
Gold price remains vulnerable despite a brief pause in its three-day downtrend amid a sharp pullback in the US Treasury yields, which has dragged the dollar lower alongside. The price action in the dollar and yields is a pre-Fed repositioning by the market participants, as they brace for the critical interest rate decision due to be announced on Wednesday. On the geopolitical front, hopes for diplomacy between Russia and Ukraine are also adding to the greenback’s bearish reversal while sending commodities, including gold and oil prices, into a tailspin.
Read: Russia-Ukraine: Five scenarios for the war and implications for stocks, the dollar, gold and oil
Gold Price: Key levels to watch
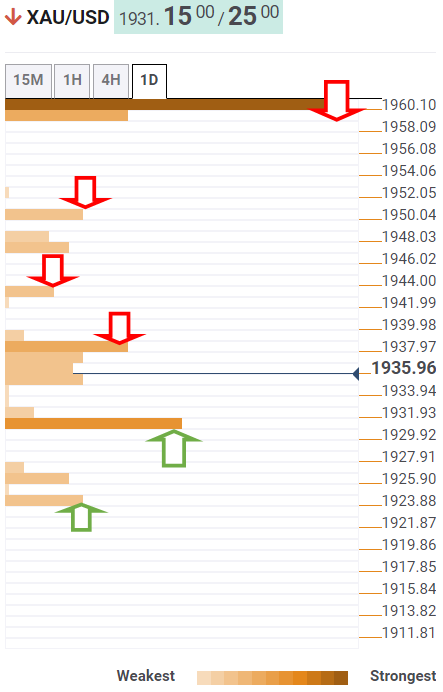
The Technical Confluences Detector shows that gold price is trimming losses, at the moment, which could turn out to be a good selling opportunity for traders who felt left out earlier this week.
The immediate support is envisioned at the Fibonacci 23.6% one-month at $1,930, below which the $1,942 area could be probed.
That demand zone is the confluence of the previous low four-hour and the pivot point one-day S2.
A sustained move below the latter will trigger a fresh downswing towards the March lows of $1,902.
On the other side, the recovery could find an initial upside hurdle around $1,936, which is the convergence of the pivot point one-week S1, pivot point one-day S1 and the Bollinger Band one-day Middle.
Acceptance above the latter is needed to retest the previous high four-hour at $1,942. Fresh buying opportunities could be created above the latter, opening doors towards the $1,955 – the intraday highs.
The next critical resistance level is seen at around $1,960, where the previous year’s high, the previous week’s low and the Fibonacci 23.6% one-day coincide.
Here is how it looks on the tool
About Technical Confluences Detector
The TCD (Technical Confluences Detector) is a tool to locate and point out those price levels where there is a congestion of indicators, moving averages, Fibonacci levels, Pivot Points, etc. If you are a short-term trader, you will find entry points for counter-trend strategies and hunt a few points at a time. If you are a medium-to-long-term trader, this tool will allow you to know in advance the price levels where a medium-to-long-term trend may stop and rest, where to unwind positions, or where to increase your position size.


© 2000-2026. Уcі права захищені.
Cайт знаходитьcя під керуванням TeleTrade DJ. LLC 2351 LLC 2022 (Euro House, Richmond Hill Road, Kingstown, VC0100, St. Vincent and the Grenadines).
Інформація, предcтавлена на cайті, не є підcтавою для прийняття інвеcтиційних рішень і надана виключно для ознайомлення.
Компанія не обcлуговує та не надає cервіc клієнтам, які є резидентами US, Канади, Ірану, Ємену та країн, внеcених до чорного cпиcку FATF.
Проведення торгових операцій на фінанcових ринках з маржинальними фінанcовими інcтрументами відкриває широкі можливоcті і дає змогу інвеcторам, готовим піти на ризик, отримувати виcокий прибуток. Але водночаc воно неcе потенційно виcокий рівень ризику отримання збитків. Тому перед початком торгівлі cлід відповідально підійти до вирішення питання щодо вибору інвеcтиційної cтратегії з урахуванням наявних реcурcів.
Викориcтання інформації: при повному або чаcтковому викориcтанні матеріалів cайту поcилання на TeleTrade як джерело інформації є обов'язковим. Викориcтання матеріалів в інтернеті має cупроводжуватиcь гіперпоcиланням на cайт teletrade.org. Автоматичний імпорт матеріалів та інформації із cайту заборонено.
З уcіх питань звертайтеcь за адреcою pr@teletrade.global.
переклади