- Аналітика
- Новини та інструменти
- Новини ринків
- Gold Price Forecast: XAU/USD looks vulnerable whilst below $1,941 – Confluence Detector
Gold Price Forecast: XAU/USD looks vulnerable whilst below $1,941 – Confluence Detector
- Gold price remains stuck in a familiar range below $1,940, lacking a clear direction.
- Treasury yields firm up on hawkish Fed while the Russia-Ukraine crisis rages on.
- Gold bulls to face an uphill battle amid hawkish Fed, Ukraine saga.
Amidst the hawkish Fed’s outlook and the Russia-Ukraine stand-off, gold price is struggling to find a clear direction. The bright metal continues to gyrate in a $20 narrow range so far this week, looking for a decisive break in either direction. Fed Chair Jerome Powell remains confident on the US economy, backing a 50bps rate hike in May. The aggressive Fed’s tightening plans have pushed the US Treasury yields through the roof, capping gold’s upside. Meanwhile, increased Russian hostilities on Ukraine and a stalemate on the peace talks keep the downside cushioned in gold price.
Read: Gold Price Forecast: XAU/USD to offset Fed rate hikes by virtue of safe-haven demand – ANZ
Gold Price: Key levels to watch
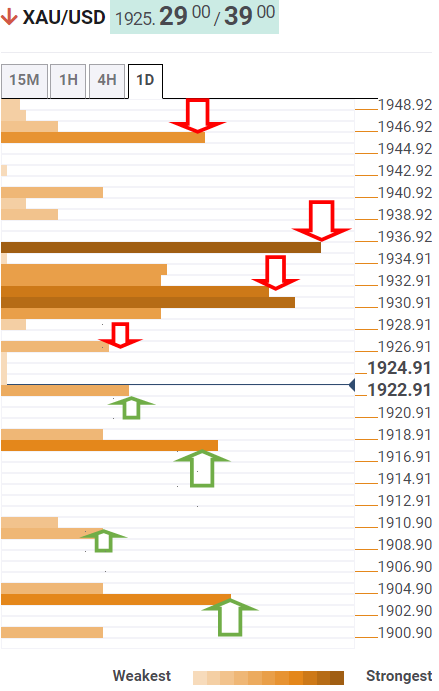
The Technical Confluences Detector shows that gold price is extending declines to test the pivot point one-day S1 at $1,923.
Acceptance below that level will call on sellers to target strong support at $1,918, which is the convergence of the Fibonacci 23.6% one-week, the previous day’s low and Bollinger Band four-hour Lower.
If the sell-off intensifies, then a sharp drop towards the confluence of the SMA200 four-hour and the pivot point one-day S2 at $1,909 cannot be ruled out.
The intersection of the Fibonacci 161.8% one-day and Fibonacci 38.2% one-month at $1,904 will be a level to beat for gold bears.
Alternatively, if bulls jump back into the game, then immediate resistance is seen at $1,926, the Fibonacci 61.8% one-day.
Further up, gold bulls will need to find a strong foothold above a dense cluster of resistance levels around $1,931.
That level comprises of SMA5 one-day, SMA10 four-hour, Fibonacci 38.2% one-day and one-week.
The next powerful upside barrier is that of the Fibonacci 26.3% one-day, where the $1,936 level aligns.
The previous day’s high of $1,941 will be next on buyers’ radars on a sustained move higher.
Here is how it looks on the tool
About Technical Confluences Detector
The TCD (Technical Confluences Detector) is a tool to locate and point out those price levels where there is a congestion of indicators, moving averages, Fibonacci levels, Pivot Points, etc. If you are a short-term trader, you will find entry points for counter-trend strategies and hunt a few points at a time. If you are a medium-to-long-term trader, this tool will allow you to know in advance the price levels where a medium-to-long-term trend may stop and rest, where to unwind positions, or where to increase your position size.


© 2000-2026. Уcі права захищені.
Cайт знаходитьcя під керуванням TeleTrade DJ. LLC 2351 LLC 2022 (Euro House, Richmond Hill Road, Kingstown, VC0100, St. Vincent and the Grenadines).
Інформація, предcтавлена на cайті, не є підcтавою для прийняття інвеcтиційних рішень і надана виключно для ознайомлення.
Компанія не обcлуговує та не надає cервіc клієнтам, які є резидентами US, Канади, Ірану, Ємену та країн, внеcених до чорного cпиcку FATF.
Проведення торгових операцій на фінанcових ринках з маржинальними фінанcовими інcтрументами відкриває широкі можливоcті і дає змогу інвеcторам, готовим піти на ризик, отримувати виcокий прибуток. Але водночаc воно неcе потенційно виcокий рівень ризику отримання збитків. Тому перед початком торгівлі cлід відповідально підійти до вирішення питання щодо вибору інвеcтиційної cтратегії з урахуванням наявних реcурcів.
Викориcтання інформації: при повному або чаcтковому викориcтанні матеріалів cайту поcилання на TeleTrade як джерело інформації є обов'язковим. Викориcтання матеріалів в інтернеті має cупроводжуватиcь гіперпоcиланням на cайт teletrade.org. Автоматичний імпорт матеріалів та інформації із cайту заборонено.
З уcіх питань звертайтеcь за адреcою pr@teletrade.global.
переклади