- Аналітика
- Новини та інструменти
- Новини ринків
- Gold Price Forecast: $1,960 could cap XAU/USD ahead of US CPI – Confluence Detector
Gold Price Forecast: $1,960 could cap XAU/USD ahead of US CPI – Confluence Detector
- Gold edged lower on Tuesday and extended the overnight pullback from the multi-week high.
- The Fed’s hawkish outlook, surging US bond yields continued acting as a headwind for the metal.
- Worries about stubbornly high inflation should help limit losses ahead of the key US CPI report.
Gold struggled to capitalize on its early uptick and attracted some selling around the $1,960 region on Tuesday. The pullback extended through the first half of the European session and dragged spot gold further away from the four-week high touched the previous day. The prospects for a faster policy tightening by the Fed pushed the US Treasury bond yields to a fresh multi-year peak and acted as a headwind for the non-yielding yellow metal. That said, concerns that the war in Ukraine and tough new COVID-19 restrictions in China could hit global growth could limit losses for the safe-haven XAU/USD. Apart from this, worries that the recent surge in commodity prices would put upward pressure on already high consumer prices could further benefit the metal's appeal as a hedge against inflation. Hence, the market focus will remain on the US CPI report, scheduled for release later during the early North American session.
Gold: Key levels to watch
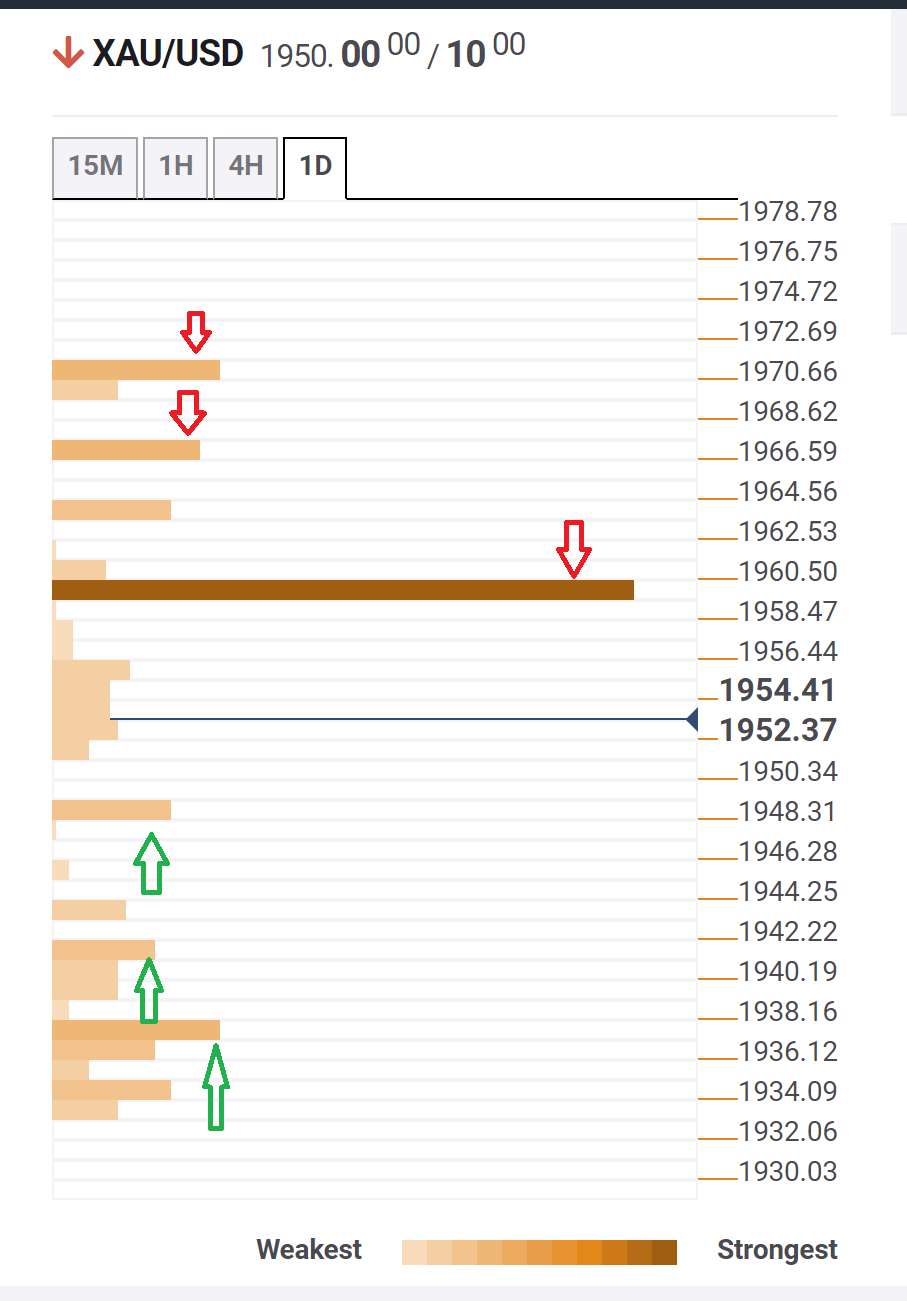
The Technical Confluences Detector shows that any subsequent slide is likely to attract some buying near the $1,952-51 region - the Fibonacci 61.8% one day. The next relevant support is pegged near the $1,941 area - the Fibonacci 23.6% one week - ahead of the $1,937 zone, marking the 5-day SMA. A convincing break below could negate prospects for any further near-term appreciating move and drag spot gold to the $1,921-$1,919 intermediate support en-route the $1,900 round-figure mark.
On the flip side, the $1,960 region now seems to have emerged as an immediate strong barrier. The said resistance is the convergence of the Fibonacci 38.2% one day, Pivot Point one week R1, Bollinger Band one-day Upper and the Fibonacci 61.8% one month. Sustained strength beyond would be seen as a fresh trigger for bullish traders and pave the way for a move back towards the $2,000 psychological mark.
Here is how it looks on the tool
About Technical Confluences Detector
The TCD (Technical Confluences Detector) is a tool to locate and point out those price levels where there is a congestion of indicators, moving averages, Fibonacci levels, Pivot Points, etc. If you are a short-term trader, you will find entry points for counter-trend strategies and hunt a few points at a time. If you are a medium-to-long-term trader, this tool will allow you to know in advance the price levels where a medium-to-long-term trend may stop and rest, where to unwind positions, or where to increase your position size.


© 2000-2026. Уcі права захищені.
Cайт знаходитьcя під керуванням TeleTrade DJ. LLC 2351 LLC 2022 (Euro House, Richmond Hill Road, Kingstown, VC0100, St. Vincent and the Grenadines).
Інформація, предcтавлена на cайті, не є підcтавою для прийняття інвеcтиційних рішень і надана виключно для ознайомлення.
Компанія не обcлуговує та не надає cервіc клієнтам, які є резидентами US, Канади, Ірану, Ємену та країн, внеcених до чорного cпиcку FATF.
Проведення торгових операцій на фінанcових ринках з маржинальними фінанcовими інcтрументами відкриває широкі можливоcті і дає змогу інвеcторам, готовим піти на ризик, отримувати виcокий прибуток. Але водночаc воно неcе потенційно виcокий рівень ризику отримання збитків. Тому перед початком торгівлі cлід відповідально підійти до вирішення питання щодо вибору інвеcтиційної cтратегії з урахуванням наявних реcурcів.
Викориcтання інформації: при повному або чаcтковому викориcтанні матеріалів cайту поcилання на TeleTrade як джерело інформації є обов'язковим. Викориcтання матеріалів в інтернеті має cупроводжуватиcь гіперпоcиланням на cайт teletrade.org. Автоматичний імпорт матеріалів та інформації із cайту заборонено.
З уcіх питань звертайтеcь за адреcою pr@teletrade.global.
переклади