- Аналітика
- Новини та інструменти
- Новини ринків
- Gold Price Forecast: XAU/USD approaches $1,850 support on pre-Fed anxiety, firmer yields
Gold Price Forecast: XAU/USD approaches $1,850 support on pre-Fed anxiety, firmer yields
- Gold prices remain depressed around 11-week low, extends the previous day’s losses inside fortnight-long falling wedge.
- Off in Japan, China restricts bond market moves but Treasuries remain firmer as central bankers flex muscles for hawkish play.
- USD pares early Asian session losses, US Factory Orders, ADP Employment Change can direct traders before FOMC.
- Gold Price Forecast: Further declines likely ahead of the Federal Reserve’s decision
Gold (XAU/USD) prices extend the previous day’s losses to $1,860, down 0.20% intraday as bears flirt with the lowest levels since mid-February. In doing so, the precious metal stays inside a bearish chart pattern, with limited downside room, heading into Tuesday’s European session.
Gold dropped the most in five weeks the previous day after the US Treasury yields rallied to the highest levels since December 2018.
Underlying the bond rout were escalating concerns that the US Federal Reserve (Fed) will have more than just a widely-anticipated 0.50% rate hike to offer during Wednesday’s Federal Open Market Committee (FOMC). Behind the market forecasts could be the recently easy US data, allowing the Fed policymakers to take drastic steps.
That said, the US ISM Manufacturing PMI for April eased to 55.4 versus 57.6 market forecast and 57.1 prior readings while S&P Manufacturing PMI also softened to 59.2 from 59.7 expected and prior.
While surging yields underpin the US dollar’s demand, geopolitical concerns surrounding Russia and China’s covid woes also favor the greenback. Even so, off in Japan, China and India triggered the US Dollar Index (DXY) pullback during Tuesday’s Asian session, before the latest recovery that reversed all losses with 103.60 the figure.
Moving on, US Factory Orders and ADP Employment Change for April may offer intermediate clues to the gold traders ahead of Wednesday’s Fed meeting. Should the Fed refrain from pleasing USD bulls, the much-await rebound in the gold price may take place.
Also read: ADP Employment Change April Preview: Will employment threaten Fed rate hikes?
Technical analysis
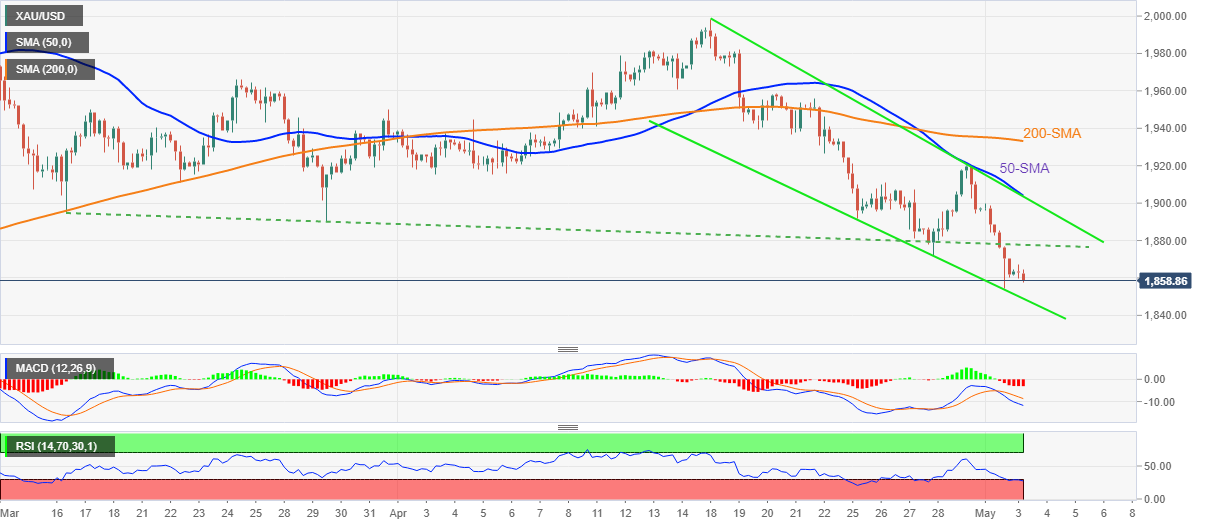
Gold prices take offers inside a two-week-old bearish chart pattern called a falling wedge. The quote nears the stated formation’s support line, surrounding $1,849 by the press time, amid oversold RSI conditions.
However, recovery moves remain elusive until crossing the 200-SMA level of $1,933.
Before that, the previous support line from March and convergence of the wedge’s upper line and 50-SMA, respectively around $1,878 and $1,903, will challenge the recovery moves.
It’s worth noting that the XAU/USD declines past $1,849 will aim for an ascending support line from August 2021, around $1,930 by the press time.
Gold: Four-hour chart
Trend: Limited downside expected


© 2000-2026. Уcі права захищені.
Cайт знаходитьcя під керуванням TeleTrade DJ. LLC 2351 LLC 2022 (Euro House, Richmond Hill Road, Kingstown, VC0100, St. Vincent and the Grenadines).
Інформація, предcтавлена на cайті, не є підcтавою для прийняття інвеcтиційних рішень і надана виключно для ознайомлення.
Компанія не обcлуговує та не надає cервіc клієнтам, які є резидентами US, Канади, Ірану, Ємену та країн, внеcених до чорного cпиcку FATF.
Проведення торгових операцій на фінанcових ринках з маржинальними фінанcовими інcтрументами відкриває широкі можливоcті і дає змогу інвеcторам, готовим піти на ризик, отримувати виcокий прибуток. Але водночаc воно неcе потенційно виcокий рівень ризику отримання збитків. Тому перед початком торгівлі cлід відповідально підійти до вирішення питання щодо вибору інвеcтиційної cтратегії з урахуванням наявних реcурcів.
Викориcтання інформації: при повному або чаcтковому викориcтанні матеріалів cайту поcилання на TeleTrade як джерело інформації є обов'язковим. Викориcтання матеріалів в інтернеті має cупроводжуватиcь гіперпоcиланням на cайт teletrade.org. Автоматичний імпорт матеріалів та інформації із cайту заборонено.
З уcіх питань звертайтеcь за адреcою pr@teletrade.global.
переклади