- Аналітика
- Новини та інструменти
- Новини ринків
- Gold Price Forecast: Battle lines well-defined for XAUUSD amid light trading – Confluence Detector
Gold Price Forecast: Battle lines well-defined for XAUUSD amid light trading – Confluence Detector
- Gold Price is supported above $1,850 amid holiday-thinned trading.
- US dollar remains on the defensive amid a risk-on market mood.
- XAUUSD is struggling amid a bunch of healthy resistance and support levels.
Gold Price is giving a part of its early gains but appears supported amid holiday-thinned market conditions. The US dollar is seeing a dip-buying demand, despite the risk-on trading on global stocks. Investors continue assessing the China covid easing optimism and subsiding aggressive Fed’s tightening bets against signs of slowing in the US economy. Therefore, gold price is seen fluctuating between gains and losses while defending the $1,850 barrier. The EU Summit on Ukraine crisis is closely followed, as Russia’s oil embargo is likely to be part of EU sanctions package. These developments could affect the broader market sentiment, significantly impacting the dollar and XAUUSD price.
Also read: Gold Price Forecast: XAUUSD buyers seize control in the NFP week, $1,870 in sight
Gold Price: Key levels to watch
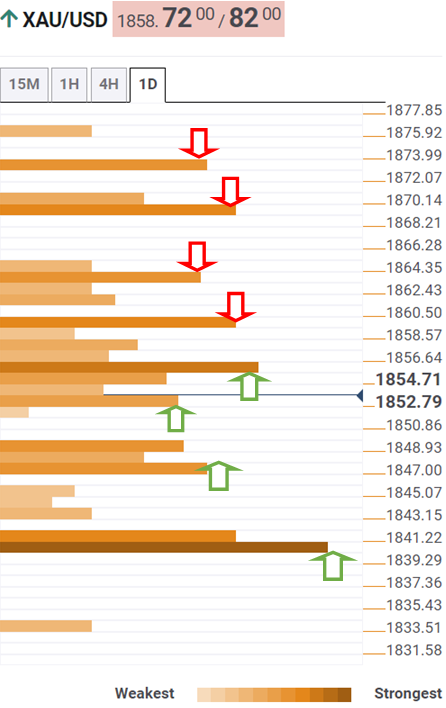
The Technical Confluences Detector shows that the Gold Price is battling strong resistance at $1,860, which is the meeting point of the Fibonacci 23.6% one-day and Fibonacci 38.2% one-week.
The previous high four-hour and the Fibonacci 23.6% one-week at $1,864 will be tested next by gold buyers.
A sustained move above the latter will see a fresh advance towards the previous week’s high of $1,870. At that point, the pivot point one-week R1 and pivot point one-day R2 align.
The previous month’s low of $1,872 will be the level to beat for XAU bulls.
Alternatively, a firm break below the SMA5 one-day at $1,855 will put the Fibonacci 61.8% one-week at $1,852 to test.
The next critical support zone is seen at around $1,848, which is the confluence of the previous day’s low, pivot point one-month S1 and SMA50 four-hour.
The line in the sand for gold bulls is seen at $1,840, the intersection of the pivot point one-day S2, SMA200 one-day and the previous week’s low.
Here is how it looks on the tool
About Technical Confluences Detector
The TCD (Technical Confluences Detector) is a tool to locate and point out those price levels where there is a congestion of indicators, moving averages, Fibonacci levels, Pivot Points, etc. If you are a short-term trader, you will find entry points for counter-trend strategies and hunt a few points at a time. If you are a medium-to-long-term trader, this tool will allow you to know in advance the price levels where a medium-to-long-term trend may stop and rest, where to unwind positions, or where to increase your position size.


© 2000-2026. Уcі права захищені.
Cайт знаходитьcя під керуванням TeleTrade DJ. LLC 2351 LLC 2022 (Euro House, Richmond Hill Road, Kingstown, VC0100, St. Vincent and the Grenadines).
Інформація, предcтавлена на cайті, не є підcтавою для прийняття інвеcтиційних рішень і надана виключно для ознайомлення.
Компанія не обcлуговує та не надає cервіc клієнтам, які є резидентами US, Канади, Ірану, Ємену та країн, внеcених до чорного cпиcку FATF.
Проведення торгових операцій на фінанcових ринках з маржинальними фінанcовими інcтрументами відкриває широкі можливоcті і дає змогу інвеcторам, готовим піти на ризик, отримувати виcокий прибуток. Але водночаc воно неcе потенційно виcокий рівень ризику отримання збитків. Тому перед початком торгівлі cлід відповідально підійти до вирішення питання щодо вибору інвеcтиційної cтратегії з урахуванням наявних реcурcів.
Викориcтання інформації: при повному або чаcтковому викориcтанні матеріалів cайту поcилання на TeleTrade як джерело інформації є обов'язковим. Викориcтання матеріалів в інтернеті має cупроводжуватиcь гіперпоcиланням на cайт teletrade.org. Автоматичний імпорт матеріалів та інформації із cайту заборонено.
З уcіх питань звертайтеcь за адреcою pr@teletrade.global.
переклади