- Аналітика
- Новини та інструменти
- Новини ринків
- AUD/JPY Price Analysis: A rising wedge in the daily chart, targets a fall towards 86.20s
AUD/JPY Price Analysis: A rising wedge in the daily chart, targets a fall towards 86.20s
- The AUD/JPY registered gains of almost 1.50% in June.
- A rising wedge in the AUD/JPY’s daily chart targets a fall towards 86.20s.
- The AUD/JPY in the near term is neutral-downward biased.
AUD/JPY prolongs its losses amidst a risk-off impulse weighing on global equities, sending investors scrambling toward safe-haven assets; in the FX complex being the Japanese yen and the Swiss franc, except the US dollar, undermined by falling US Treasury yields. At 93.67, the AUD/JPY is almost flat as the Asian Pacific session begins.
AUD/JPY Thursday’s price action illustrates consolidation in the last few days, within the 93.40-94.30 range, which buyers/sellers have been unable to break. AUD/JPY traders should note that the cross exchange rate is below the exponential moving averages (EMAs) in the 1-hour chart, signifying that downside risks remain in the short term.
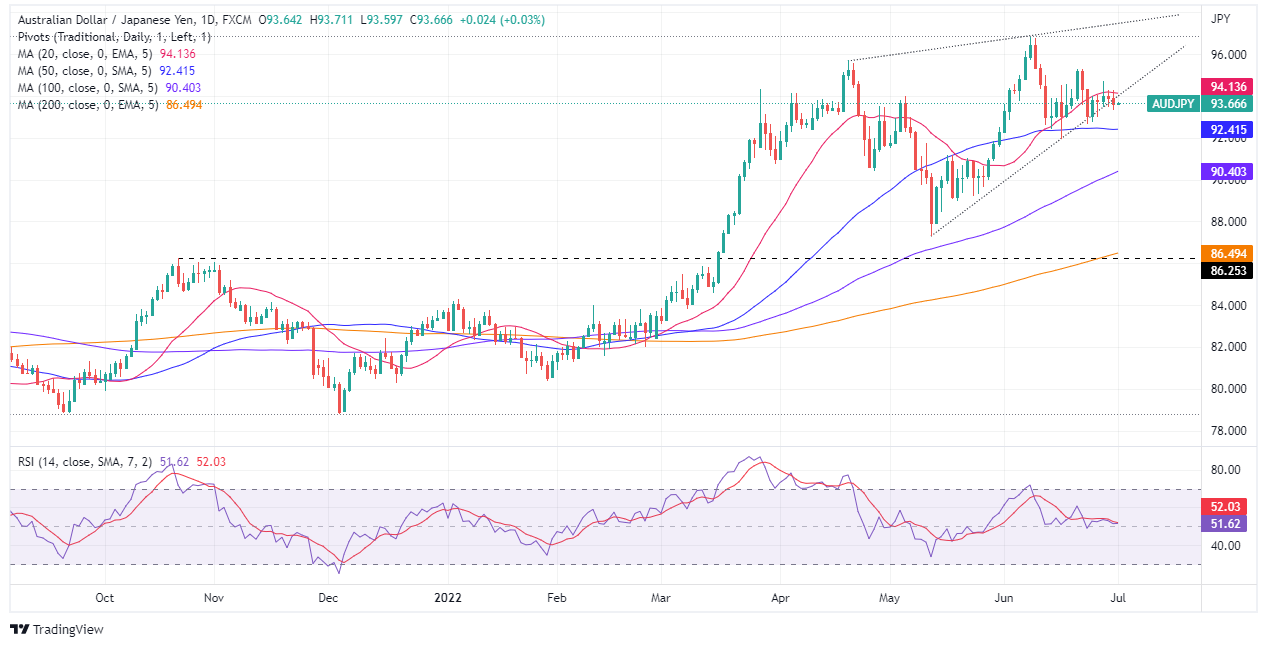
AUD/JPY Daily chart
The AUD/JPY daily chart illustrates that the uptrend remains in play. Nevertheless, the pair’s falling below the 20-day EMA leaves it vulnerable to selling pressure, but the “damage” could be limited by the 50-day EMA at 92.41, followed by the June 16 swing low at 91.96. If that scenario plays out, it will also confirm the break of a rising wedge that targets the October 21, 2021 swing high-turned-support at 86.25.
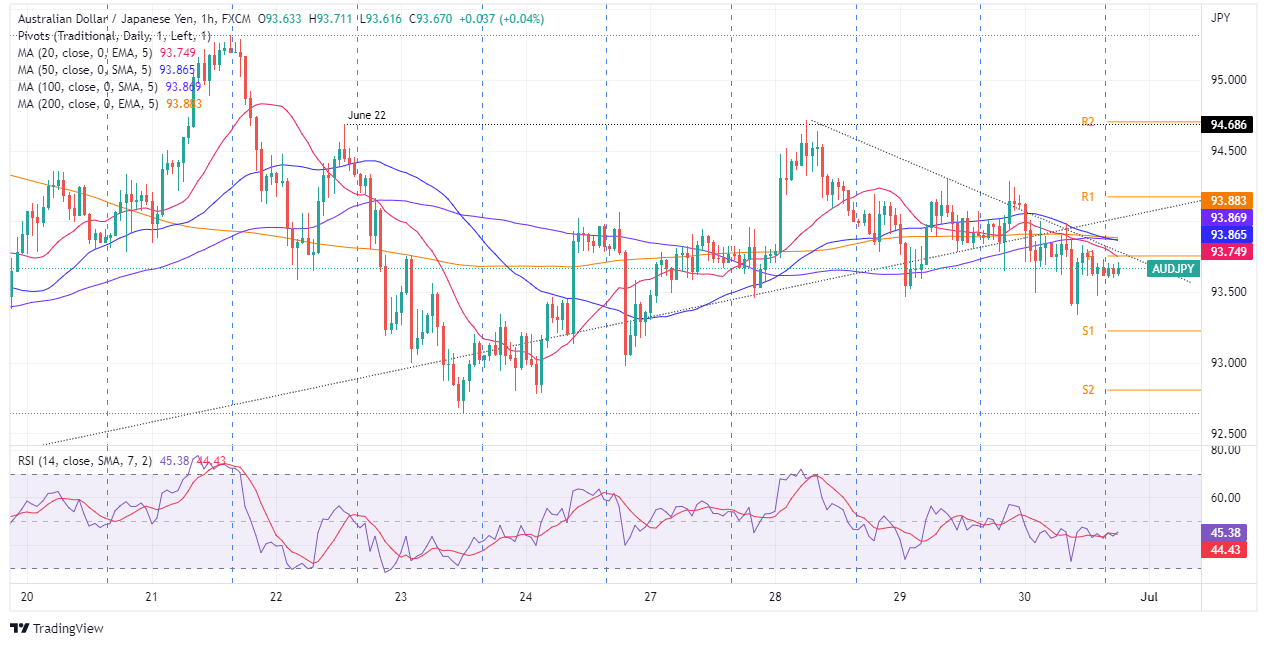
AUD/JPY 1-Hour chart
In the near term, the AUD/JPY depicts a neutral-downward bias, confirmed by the EMAs and the Relative Strenght Index (RSI), which albeit almost trendless, remains below the 50-midline, in negative territory. Furthermore, a four-times tested downslope trendline suggests the pair is consolidating.
If the AUD/JPY breaks to the downside, its first support would be the June 30 daily low at 93.33. Once cleared, it would expose the S1 daily pivot at 93.23, followed by the June 26 low at 92.97. Contrarily, if the cross heads north, the AUD/JPY’s first resistance would be the 20-EMA at 93.74. Break above would expose the confluence of the 50, 100, and 200-EMAs, in the 93.85-88 range, followed by the R1 daily pivot at 94.20, followed by the June 22 high at 94.68.
AUD/JPY Key Technical Levels


© 2000-2026. Уcі права захищені.
Cайт знаходитьcя під керуванням TeleTrade DJ. LLC 2351 LLC 2022 (Euro House, Richmond Hill Road, Kingstown, VC0100, St. Vincent and the Grenadines).
Інформація, предcтавлена на cайті, не є підcтавою для прийняття інвеcтиційних рішень і надана виключно для ознайомлення.
Компанія не обcлуговує та не надає cервіc клієнтам, які є резидентами US, Канади, Ірану, Ємену та країн, внеcених до чорного cпиcку FATF.
Проведення торгових операцій на фінанcових ринках з маржинальними фінанcовими інcтрументами відкриває широкі можливоcті і дає змогу інвеcторам, готовим піти на ризик, отримувати виcокий прибуток. Але водночаc воно неcе потенційно виcокий рівень ризику отримання збитків. Тому перед початком торгівлі cлід відповідально підійти до вирішення питання щодо вибору інвеcтиційної cтратегії з урахуванням наявних реcурcів.
Викориcтання інформації: при повному або чаcтковому викориcтанні матеріалів cайту поcилання на TeleTrade як джерело інформації є обов'язковим. Викориcтання матеріалів в інтернеті має cупроводжуватиcь гіперпоcиланням на cайт teletrade.org. Автоматичний імпорт матеріалів та інформації із cайту заборонено.
З уcіх питань звертайтеcь за адреcою pr@teletrade.global.
переклади