- Аналітика
- Новини та інструменти
- Новини ринків
- Gold Price Forecast: XAU/USD bulls keep their sight on $1,786 amid Taiwan tensions – Confluence Detector
Gold Price Forecast: XAU/USD bulls keep their sight on $1,786 amid Taiwan tensions – Confluence Detector
- Gold price eases but upside remains favored amid escalating US-China tensions.
- The expected visit of US’ Pelosi to Taipei rattles markets amid China warnings.
- XAU/USD bulls remain on track to test the critical resistance area at $1,786.
Gold price seems positioned for a renewed upswing, with all eyes set on the $1,786 barrier en route to the $1,800 mark. The buying interest in the yellow metal remains unabated, despite the latest rebound in the US dollar, as investors prefer holding gold as a store of value amid escalating US-China tensions over Taiwan. US House of Representatives Speaker Nancy Pelosi is due to arrive in Taiwan at 1420 GMT. Both China and Taiwan have strengthened their military resources, as she is visiting the self-ruled island claimed by Beijing. Intensifying geopolitical tensions have ramped up risk-off flows into traditional safe havens such as the bullion and the US government bonds, weighing negatively on the Treasury yields. The ongoing slump in the yields is likely to remain a drag on the dollar. Looking forward, the absence of top-tier US economic data will keep the market’s attention on the Taiwan tensions.
Also read: Gold Price Forecast: XAU/USD outshines amid panic, targets $1,794
Gold Price: Key levels to watch
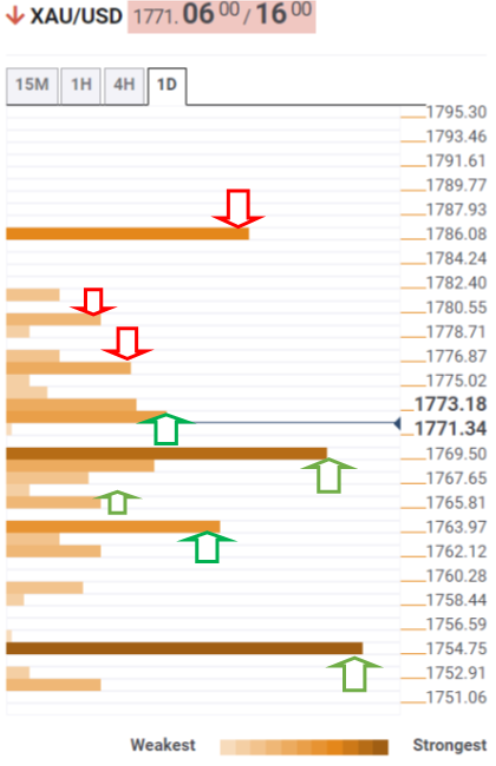
The Technical Confluence Detector shows that the gold price is looking to find fresh upside traction, as it flirts with the $1,771 support area. That level is the convergence of the Fibonacci 23.6% one-day and SMA5 four-hour.
Defending the latter could fuel a bounce back towards the previous day’s high of $1,775. The next significant resistance is aligned at the pivot point one-day R1 at $1,779.
Bulls need to crack the confluence of the pivot point one-week R1 and pivot point one-day R2 at $1,786 to unleash a sustained move towards the $1,800 mark.
On the flip side, if sellers manage to find a strong foothold below the abovementioned support, then bears will challenge a strong cushion around $1,768, where the previous week’s high, SMA10 four-hour and Fibonacci 38.2% one-day coincide.
The Fibonacci 61.8% one-day at $1,765 will come to buyers’ rescue, below which the Fibonacci 61.8% one-month at $1,763 will be probed.
The next downside targets are placed at the previous day’s low of $1,758 and the all-important Fibonacci 23.6% one-week at $1,755.
Here is how it looks on the tool
About Technical Confluences Detector
The TCD (Technical Confluences Detector) is a tool to locate and point out those price levels where there is a congestion of indicators, moving averages, Fibonacci levels, Pivot Points, etc. If you are a short-term trader, you will find entry points for counter-trend strategies and hunt a few points at a time. If you are a medium-to-long-term trader, this tool will allow you to know in advance the price levels where a medium-to-long-term trend may stop and rest, where to unwind positions, or where to increase your position size.


© 2000-2026. Уcі права захищені.
Cайт знаходитьcя під керуванням TeleTrade DJ. LLC 2351 LLC 2022 (Euro House, Richmond Hill Road, Kingstown, VC0100, St. Vincent and the Grenadines).
Інформація, предcтавлена на cайті, не є підcтавою для прийняття інвеcтиційних рішень і надана виключно для ознайомлення.
Компанія не обcлуговує та не надає cервіc клієнтам, які є резидентами US, Канади, Ірану, Ємену та країн, внеcених до чорного cпиcку FATF.
Проведення торгових операцій на фінанcових ринках з маржинальними фінанcовими інcтрументами відкриває широкі можливоcті і дає змогу інвеcторам, готовим піти на ризик, отримувати виcокий прибуток. Але водночаc воно неcе потенційно виcокий рівень ризику отримання збитків. Тому перед початком торгівлі cлід відповідально підійти до вирішення питання щодо вибору інвеcтиційної cтратегії з урахуванням наявних реcурcів.
Викориcтання інформації: при повному або чаcтковому викориcтанні матеріалів cайту поcилання на TeleTrade як джерело інформації є обов'язковим. Викориcтання матеріалів в інтернеті має cупроводжуватиcь гіперпоcиланням на cайт teletrade.org. Автоматичний імпорт матеріалів та інформації із cайту заборонено.
З уcіх питань звертайтеcь за адреcою pr@teletrade.global.
переклади