- Аналітика
- Новини та інструменти
- Новини ринків
- Silver Price Analysis: XAG/USD dives towards the 50-DMA, forming a bearish-engulfing candle pattern
Silver Price Analysis: XAG/USD dives towards the 50-DMA, forming a bearish-engulfing candle pattern
- Silver price is upward biased from a monthly chart perspective.
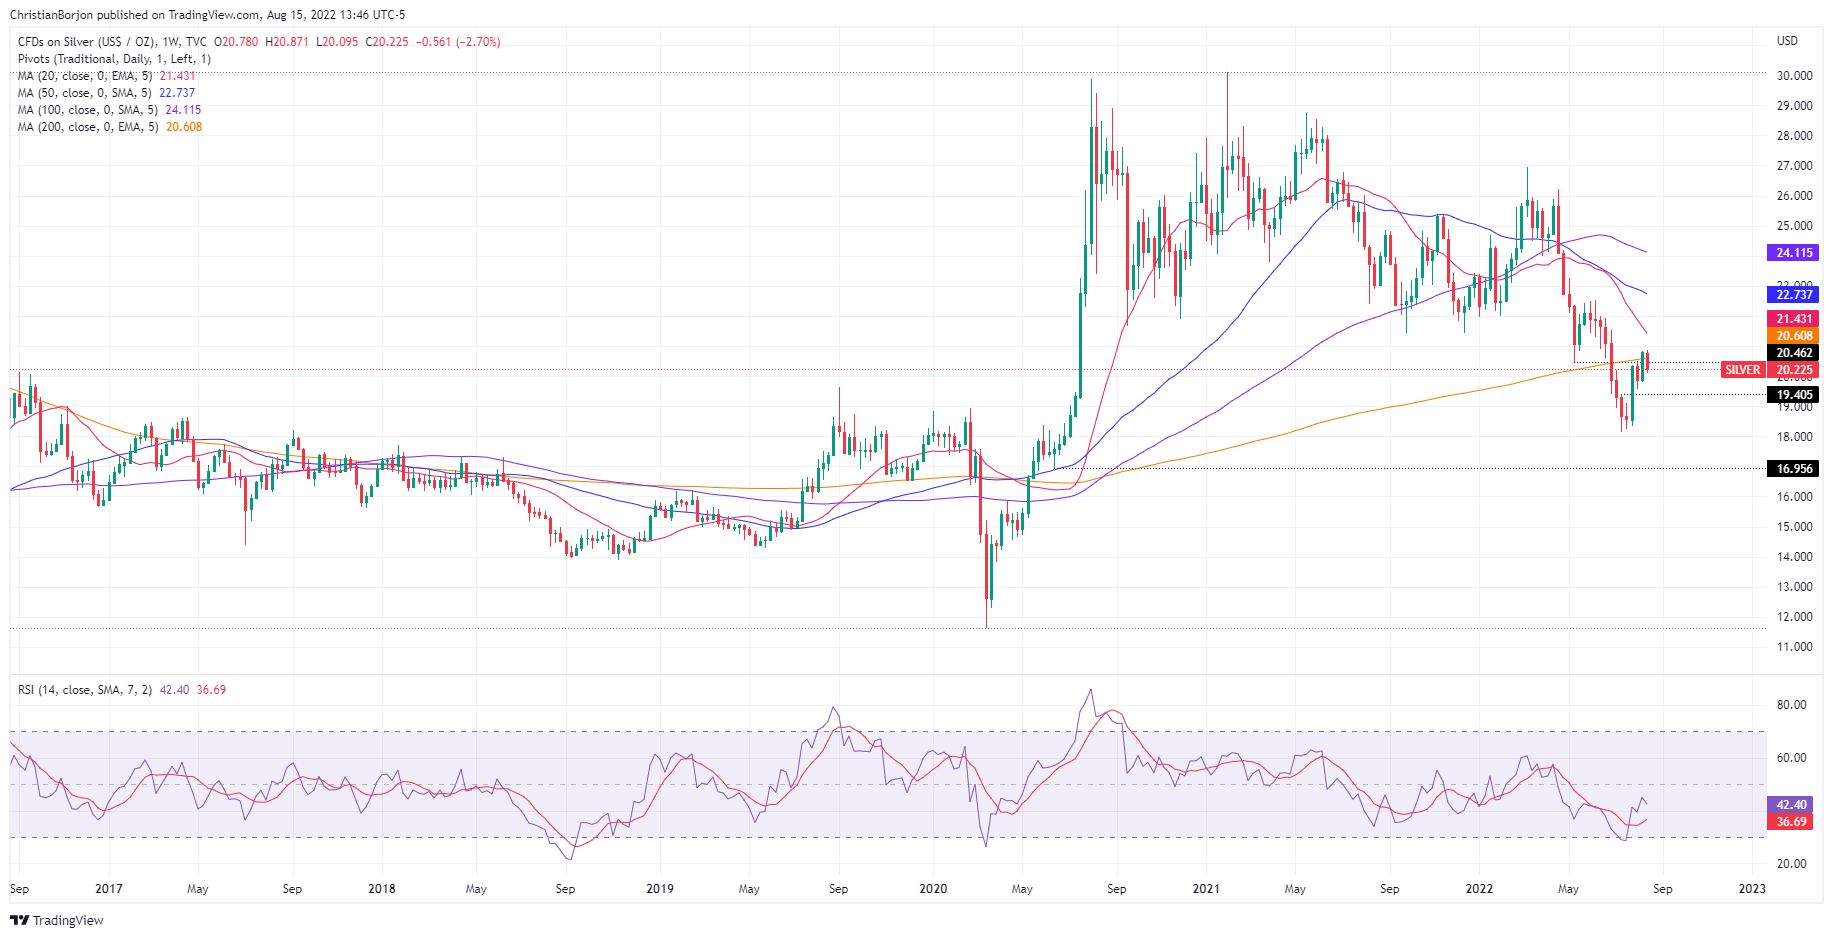
- In the weekly chart, XAG/USD remains below its 200-week EMA, downward biased.
- XAG/USD daily chart illustrates silver as neutral-to-downwards, though a bearish-engulfing candle pattern suggests a leg-down is on the cards.
Silver price edges lower during Monday’s North American session, down by 2.40% courtesy of US dollar strength, despite falling US Treasury bond yields, ahead of the release of the last FOMC monetary policy minutes. At the time of writing, the XAG/USD formed a bearish-engulfing candle pattern, trading at $20.23.
Silver Price Analysis (XAG/USD): Technical outlook
The white metal outlook looks more positive than negative from a monthly chart perspective. July’s price action formed a dragonfly-doji in a crowded area with the 50, 100, and 200-monthly MAs lying around the $18.48-$20.17 region, which could pave the way for further gains. On the topside, the 20-month EMA at $23.81 might cap further XAG/USD gains.
 XAG/USD Monthly chart
In the meantime, the XAG/USD weekly chart portrays the non-yielding metal struggling at the 200-week MA, at $20.60. Nevertheless, unless sellers push silver below $19.80, buyers could remain hopeful of higher prices, though they would face a wall of resistance at around $21.48, the 20-week EMA. Once cleared, it would pave the way towards the 50-week EMA at $22.73, ahead of the 100-week at $24.11.
 XAG/USD Weekly chart
The XAG/USD daily chart portrays silver as neutral-to-downwards biased. As previously mentioned, a bearish-engulfing candle pattern surfaced. Still, the 50-day EMA at $20.18 is a difficult support level to overcome for sellers, but the Relative Strength Index (RSI) aiming lower, towards the 50-midline, might open the door for further losses.
If XAG/USD sellers achieve a daily close below the above-mentioned, the XAG/USD next support would be the $20.00 figure, which, once cleared, could test the 20-day EMA at $19.73. On the flip side, if XAG/USD buyers hold the fort above the former, then the XAG/USD first resistance would be the $21.00 figure. Break below will expose crucial resistance levels, like the 50-day EMA at $21.68, followed by the 200-day EMA at $22.68.
 XAG/USD Daily chart
Silver (XAG/USD) Key Technical Levels


© 2000-2026. Уcі права захищені.
Cайт знаходитьcя під керуванням TeleTrade DJ. LLC 2351 LLC 2022 (Euro House, Richmond Hill Road, Kingstown, VC0100, St. Vincent and the Grenadines).
Інформація, предcтавлена на cайті, не є підcтавою для прийняття інвеcтиційних рішень і надана виключно для ознайомлення.
Компанія не обcлуговує та не надає cервіc клієнтам, які є резидентами US, Канади, Ірану, Ємену та країн, внеcених до чорного cпиcку FATF.
Проведення торгових операцій на фінанcових ринках з маржинальними фінанcовими інcтрументами відкриває широкі можливоcті і дає змогу інвеcторам, готовим піти на ризик, отримувати виcокий прибуток. Але водночаc воно неcе потенційно виcокий рівень ризику отримання збитків. Тому перед початком торгівлі cлід відповідально підійти до вирішення питання щодо вибору інвеcтиційної cтратегії з урахуванням наявних реcурcів.
Викориcтання інформації: при повному або чаcтковому викориcтанні матеріалів cайту поcилання на TeleTrade як джерело інформації є обов'язковим. Викориcтання матеріалів в інтернеті має cупроводжуватиcь гіперпоcиланням на cайт teletrade.org. Автоматичний імпорт матеріалів та інформації із cайту заборонено.
З уcіх питань звертайтеcь за адреcою pr@teletrade.global.
переклади