- Аналітика
- Новини та інструменти
- Новини ринків
- Gold Price Forecast: XAU/USD downside remains compelling amid hawkish Fed – Confluence Detector
Gold Price Forecast: XAU/USD downside remains compelling amid hawkish Fed – Confluence Detector
- Gold price is holding steady, as the dust settles after the central banks’ bonanza.
- Escalating geopolitical tensions cushion the downside in the yellow metal.
- XAU/USD’s path of least resistance appears down amid strong resistance levels.
With the central banks’ decisions out of the way, Gold price is treading water above $1,650, as the dust settles after another volatile week. Investors now assess odds for the next Fed move while awaiting a fresh batch of economic data. Meanwhile, the US dollar licks its wounds following the USD/JPY collapse-led sharp correction while the Treasury yields hover near multi-year tops, limiting the upside in the non-yielding bullion. Major global central banks have maintained that more rate increases are needed to tame inflation. This guidance has kept the bright metal reeling near two-year lows of $1,654. On the other side, escalating tensions between Russia and the West over the Ukraine crisis has provided a floor to the traditional safety net, gold. However, it remains to be seen if the metal can defend the $1,650 support level going forward.
Also read: Gold Price Forecast: Sellers keep defending the $1,680 price zone
Gold Price: Key levels to watch
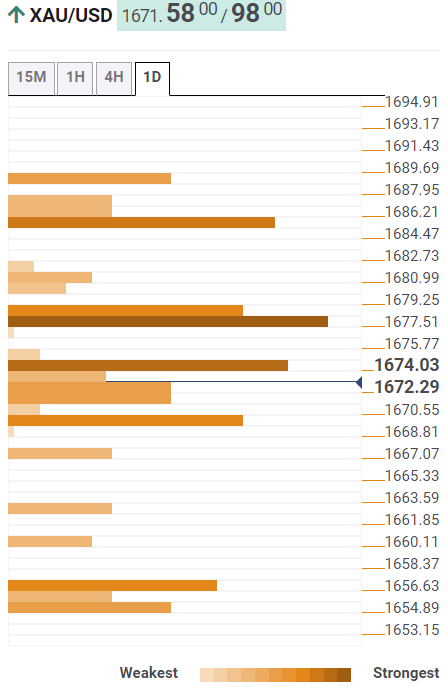
The Technical Confluence Detector shows that the gold price is facing stiff resistance at $1,674, the intersection of the Fibonacci 61.8% one-day and the Fibonacci 23.6% one-week.
The previous year’s low at $1,677 will be the next stop for XAU buyers, above which the SMA50 four-hour at $1,680 could offer minor resistance.
The confluence of the previous day’s high and the Fibonacci 38.2% one-week at $1,685 will be a tough nut to crack for bulls.
On the flip side, the SMA10 four-hour at $1,669 will guard the immediate downside, below which the Fibonacci 38.2% one-day at $1,667 will come into play.
Further down, the Fibonacci 23.6% one-day at $1,663 will challenge the bullish commitments.
The line in the sand for gold optimists is aligned at the convergence of the previous day’s low and pivot point one-day S1 at $1,656.
Here is how it looks on the tool
About Technical Confluences Detector
The TCD (Technical Confluences Detector) is a tool to locate and point out those price levels where there is a congestion of indicators, moving averages, Fibonacci levels, Pivot Points, etc. If you are a short-term trader, you will find entry points for counter-trend strategies and hunt a few points at a time. If you are a medium-to-long-term trader, this tool will allow you to know in advance the price levels where a medium-to-long-term trend may stop and rest, where to unwind positions, or where to increase your position size.


© 2000-2026. Уcі права захищені.
Cайт знаходитьcя під керуванням TeleTrade DJ. LLC 2351 LLC 2022 (Euro House, Richmond Hill Road, Kingstown, VC0100, St. Vincent and the Grenadines).
Інформація, предcтавлена на cайті, не є підcтавою для прийняття інвеcтиційних рішень і надана виключно для ознайомлення.
Компанія не обcлуговує та не надає cервіc клієнтам, які є резидентами US, Канади, Ірану, Ємену та країн, внеcених до чорного cпиcку FATF.
Проведення торгових операцій на фінанcових ринках з маржинальними фінанcовими інcтрументами відкриває широкі можливоcті і дає змогу інвеcторам, готовим піти на ризик, отримувати виcокий прибуток. Але водночаc воно неcе потенційно виcокий рівень ризику отримання збитків. Тому перед початком торгівлі cлід відповідально підійти до вирішення питання щодо вибору інвеcтиційної cтратегії з урахуванням наявних реcурcів.
Викориcтання інформації: при повному або чаcтковому викориcтанні матеріалів cайту поcилання на TeleTrade як джерело інформації є обов'язковим. Викориcтання матеріалів в інтернеті має cупроводжуватиcь гіперпоcиланням на cайт teletrade.org. Автоматичний імпорт матеріалів та інформації із cайту заборонено.
З уcіх питань звертайтеcь за адреcою pr@teletrade.global.
переклади