- Аналітика
- Новини та інструменти
- Новини ринків
- Gold Price Forecast: XAU/USD struggles to cross $1,700, upside seems favored ahead of US NFP
Gold Price Forecast: XAU/USD struggles to cross $1,700, upside seems favored ahead of US NFP
- Gold price is facing less-confident hurdles around $1,700.00 after a vertical rally.
- Downbeat performance from US ISM Manufacturing data has weakened the DXY.
- Lower consensus for labor cost index data is becoming a concern for the DXY.
Gold price (XAU/USD) is hovering around the psychological resistance of $1,700.00 in the early Asian session. The precious metal displayed a juggernaut rally after delivering an upside break of the consolidation formed in a range of $1,660.00-1,675.70 in the past three trading sessions and is now facing pressure around $1,700.00. The yellow metal is expected to spend a little time around the critical resistance and will prepare for a further impulsive wave.
Meanwhile, the US dollar index (DXY) has printed a fresh weekly low at 111.47 and is looking to decline further on sluggish economic fundamentals. Weaker US ISM Manufacturing PMI data and lower consensus for US employment data are responsible for corrective action in the DXY. The US ISM Manufacturing PMI declined to 50.9 vs. the expectations of 52.2 and the prior release of 52.8.
This week, the release of the US NFP data will keep the DXY on the tenterhooks. The US NFP is seen lower at 250k vs. the prior release of 315k. While the Unemployment Rate is seen stabilizing at 3.7%. Apart from that, investors will keenly focus on the Average Hourly Earnings data. As price pressures have not shifted significantly to the lower side, the earnings data holds meaningful importance. The labor cost index is seen lower by 10 basis points (bps) to 5.1% on an annual basis.
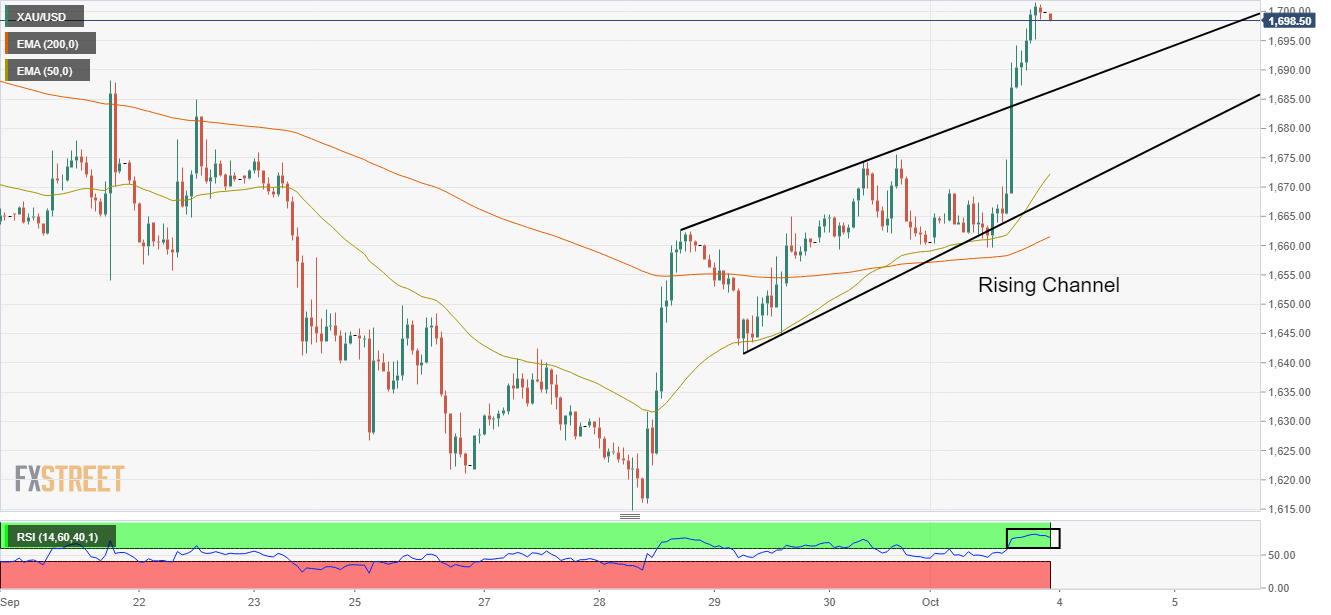
Gold technical analysis
Gold prices have witnessed a juggernaut rally after an upside break of the Rising Channel chart pattern on an hourly scale. An upside break of the above-mentioned chart pattern plotted from Wednesday’s high at $1,662.80 and Thursday’s low at $1,641.59 displays the sheer confidence of bulls.
A formation of a golden cross, represented by the 50-and 200-period Exponential Moving Averages (EMAs) at $1,656.50 is indicating more upside ahead.
Also, the Relative Strength Index (RSI) (14) is oscillating in a bullish range of 60.00-80.00, which advocates the continuation of upside momentum.
Gold hourly chart


© 2000-2026. Уcі права захищені.
Cайт знаходитьcя під керуванням TeleTrade DJ. LLC 2351 LLC 2022 (Euro House, Richmond Hill Road, Kingstown, VC0100, St. Vincent and the Grenadines).
Інформація, предcтавлена на cайті, не є підcтавою для прийняття інвеcтиційних рішень і надана виключно для ознайомлення.
Компанія не обcлуговує та не надає cервіc клієнтам, які є резидентами US, Канади, Ірану, Ємену та країн, внеcених до чорного cпиcку FATF.
Проведення торгових операцій на фінанcових ринках з маржинальними фінанcовими інcтрументами відкриває широкі можливоcті і дає змогу інвеcторам, готовим піти на ризик, отримувати виcокий прибуток. Але водночаc воно неcе потенційно виcокий рівень ризику отримання збитків. Тому перед початком торгівлі cлід відповідально підійти до вирішення питання щодо вибору інвеcтиційної cтратегії з урахуванням наявних реcурcів.
Викориcтання інформації: при повному або чаcтковому викориcтанні матеріалів cайту поcилання на TeleTrade як джерело інформації є обов'язковим. Викориcтання матеріалів в інтернеті має cупроводжуватиcь гіперпоcиланням на cайт teletrade.org. Автоматичний імпорт матеріалів та інформації із cайту заборонено.
З уcіх питань звертайтеcь за адреcою pr@teletrade.global.
переклади