- Аналітика
- Новини та інструменти
- Новини ринків
- Gold Price Forecast: XAUUSD displays a subdued performance above $1,670 amid US Mid-elections buzz
Gold Price Forecast: XAUUSD displays a subdued performance above $1,670 amid US Mid-elections buzz
- Gold price is displaying a time-correction move as investors await fresh cues from US mid-term elections.
- The alpha generated by US government bonds is accelerating ahead of US CPI data.
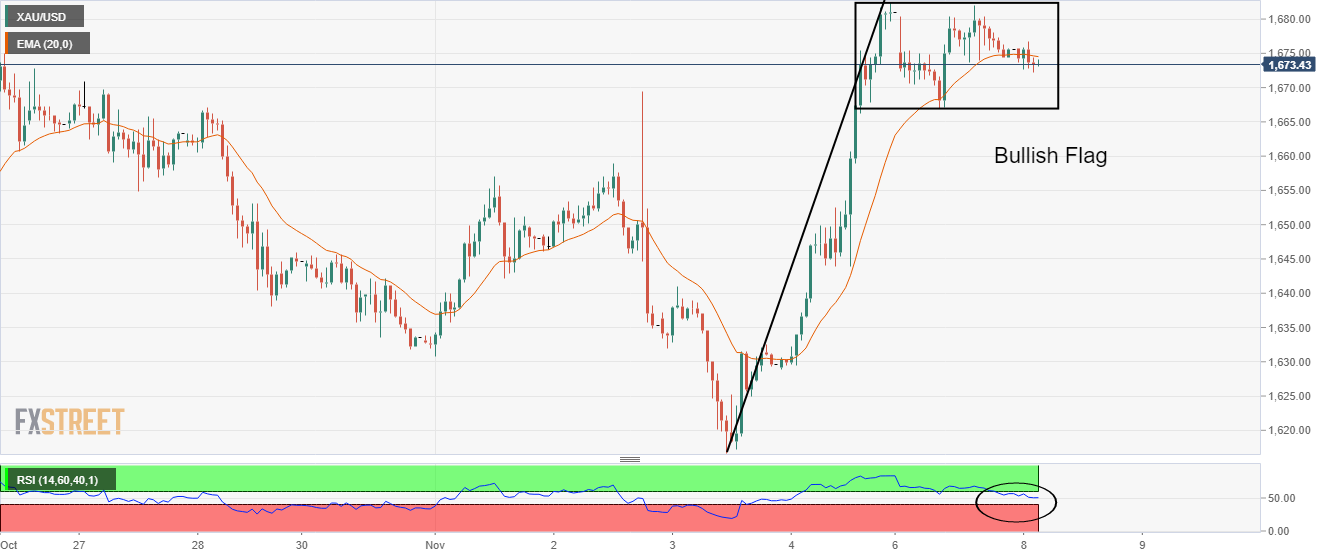
- A Bullish Flag formation is indicating a continuation of a rally after an upside break of consolidation.
Gold price (XAUUSD) has witnessed a time correction in the Tokyo session after struggling around the immediate hurdle of $1,680.00. The upside in the precious metal is capped by anxiety among investors ahead of the mid-term election buzz while the downside is being supported by overall optimism in the global market.
The US dollar index (DXY) has attempted a rebound after testing Monday’s low at around 110.00. Meanwhile, the 10-year US Treasury yields have climbed near 4.23% and are expected to continue their upside move ahead of US Consumer Price Index (CPI) data.
As per the preliminary estimates, the headline CPI is seen lower at 8.0% vs. the prior release of 8.2% while the core CPI that excludes oil and food prices is seen marginally lower at 6.5% against 6.6% in the prior release. The core inflation data has not displayed promising signs of exhaustion yet, therefore the extent of deviation in the catalyst will be keenly watched.
But before that, elections for 435 seats of the House of Representatives and 34 seats of the Senate will remain in focus. A majority win for Republicans could trigger political instability in the US economy and may impact gold prices.
Gold technical analysis
On an hourly scale, the asset is forming a Bullish Flag pattern that signals an impulsive bullish wave after the breakout of the consolidation. Usually, the consolidation phase indicates a most auctioned region where those investors place bets who prefers to enter an auction after the establishment of an upside bias. Also, investors add more longs as they see a continuation of the uptrend after a time-corrective pause.
The asset is hovering around the 20-period Exponential Moving Average (EMA) at $1,674.75. Meanwhile, the Relative Strength Index (RSI) (14) has slipped into the 40.00-60.00 range but that doesn’t warrant a reversal in the trend.
Gold hourly chart


© 2000-2026. Уcі права захищені.
Cайт знаходитьcя під керуванням TeleTrade DJ. LLC 2351 LLC 2022 (Euro House, Richmond Hill Road, Kingstown, VC0100, St. Vincent and the Grenadines).
Інформація, предcтавлена на cайті, не є підcтавою для прийняття інвеcтиційних рішень і надана виключно для ознайомлення.
Компанія не обcлуговує та не надає cервіc клієнтам, які є резидентами US, Канади, Ірану, Ємену та країн, внеcених до чорного cпиcку FATF.
Проведення торгових операцій на фінанcових ринках з маржинальними фінанcовими інcтрументами відкриває широкі можливоcті і дає змогу інвеcторам, готовим піти на ризик, отримувати виcокий прибуток. Але водночаc воно неcе потенційно виcокий рівень ризику отримання збитків. Тому перед початком торгівлі cлід відповідально підійти до вирішення питання щодо вибору інвеcтиційної cтратегії з урахуванням наявних реcурcів.
Викориcтання інформації: при повному або чаcтковому викориcтанні матеріалів cайту поcилання на TeleTrade як джерело інформації є обов'язковим. Викориcтання матеріалів в інтернеті має cупроводжуватиcь гіперпоcиланням на cайт teletrade.org. Автоматичний імпорт матеріалів та інформації із cайту заборонено.
З уcіх питань звертайтеcь за адреcою pr@teletrade.global.
переклади