- Аналітика
- Новини та інструменти
- Новини ринків
- Gold Price Forecast: XAUUSD stays bearish below $1,778 hurdle – Confluence Detector
Gold Price Forecast: XAUUSD stays bearish below $1,778 hurdle – Confluence Detector
- Gold price pares intraday losses, keeps the previous day’s pullback from three-month high.
- Sluggish sentiment, US Dollar rebound also favor XAUUSD bears.
- Multiple hurdles around $1,770-80 challenge gold price upside as bulls run out of steam.
Gold price (XAUUSD) holds onto the recent pullback from a multi-day high, despite the latest bounce off intraday low, as a firmer US Dollar joins mixed sentiment to challenge the commodity buyers of late. In doing so, the precious metal takes clues from increasing Covid woes in China and the recently firmer US data, namely the Producer Price Index (PPI) and Retail Sales for October, which raised doubts about the US Federal Reserve’s (Fed) east rate hikes. Also weighing on the gold price are the fears of the US political deadlock as Republicans are up for winning a majority in the House of Representatives while the Democratic Party holds control of the Senate. It should be noted, however, that an absence of major data/events could allow the XAUUSD to pare recent losses in case of surprises.
Also read: Gold Price Forecast: XAUUSD bulls lose grip as investors reassess future Fed rate hikes
Gold Price: Key levels to watch
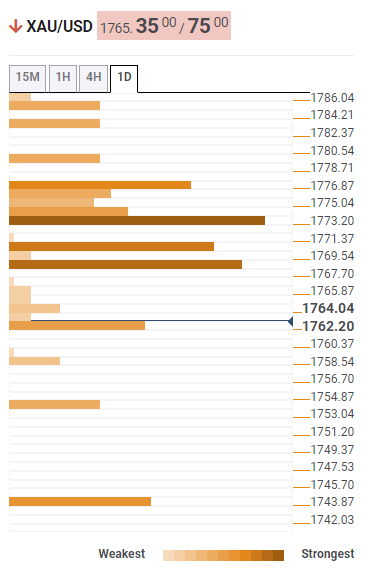
The Technical Confluence Detector shows that the gold price retreats from a jungle of resistance below $1,778 as it pares the biggest weekly gains since March 2020.
Among them, a convergence of the previous high on weekly and Pivot Point One-Day S1, as well as the 100-HMA, restricts the immediate upside of the gold price at around $1,769.
Following that, the middle band of the Bollinger on the four-hour play joins the Pivot Point One-Month R2 and Fibonacci 23.6% on D1 to highlight $1,773 as a tough nut to crack for the XAUUSD bulls.
It’s worth noting that the $1,778 level appears the last defense of the gold bears. That said, the hurdle encompasses Fibonacci 38.2% on D1.
Alternatively, Pivot Point One-Day S2 and lower Bollinger on the hourly play restrict the immediate downside of the yellow metal near $1,762.
In a case where the gold price breaks $1,762 support, a slump to the Pivot Point One-Day S3, near $1,754, appears imminent before directing the XAUUSD bears towards Fibonacci 23.6% on Weekly formation, at $1,744.
Here is how it looks on the tool
About Technical Confluences Detector
The TCD (Technical Confluences Detector) is a tool to locate and point out those price levels where there is a congestion of indicators, moving averages, Fibonacci levels, Pivot Points, etc. If you are a short-term trader, you will find entry points for counter-trend strategies and hunt a few points at a time. If you are a medium-to-long-term trader, this tool will allow you to know in advance the price levels where a medium-to-long-term trend may stop and rest, where to unwind positions, or where to increase your position size.


© 2000-2026. Уcі права захищені.
Cайт знаходитьcя під керуванням TeleTrade DJ. LLC 2351 LLC 2022 (Euro House, Richmond Hill Road, Kingstown, VC0100, St. Vincent and the Grenadines).
Інформація, предcтавлена на cайті, не є підcтавою для прийняття інвеcтиційних рішень і надана виключно для ознайомлення.
Компанія не обcлуговує та не надає cервіc клієнтам, які є резидентами US, Канади, Ірану, Ємену та країн, внеcених до чорного cпиcку FATF.
Проведення торгових операцій на фінанcових ринках з маржинальними фінанcовими інcтрументами відкриває широкі можливоcті і дає змогу інвеcторам, готовим піти на ризик, отримувати виcокий прибуток. Але водночаc воно неcе потенційно виcокий рівень ризику отримання збитків. Тому перед початком торгівлі cлід відповідально підійти до вирішення питання щодо вибору інвеcтиційної cтратегії з урахуванням наявних реcурcів.
Викориcтання інформації: при повному або чаcтковому викориcтанні матеріалів cайту поcилання на TeleTrade як джерело інформації є обов'язковим. Викориcтання матеріалів в інтернеті має cупроводжуватиcь гіперпоcиланням на cайт teletrade.org. Автоматичний імпорт матеріалів та інформації із cайту заборонено.
З уcіх питань звертайтеcь за адреcою pr@teletrade.global.
переклади