- Аналітика
- Новини та інструменти
- Новини ринків
- Gold Price Forecast: XAUUSD sees an easy path toward $1,750 and $1,745 – Confluence Detector
Gold Price Forecast: XAUUSD sees an easy path toward $1,750 and $1,745 – Confluence Detector
- Gold price is consolidating losses above $1,750 amid a firmer US Dollar and Treasury yields.
- Hawkish Federal Reserve commentary saved the day for the US Dollar buyers.
- The path of least resistance appears to the downside for Gold price.
Gold price is consolidating the recent corrective decline from three-month highs of $1,787, as a tug-of-war between bulls and bears plays out heading into the Thanksgiving week. Investors digest the latest hawkish comments from the US Federal Reserve policymakers, who are trying to over signal tightening and kill the market’s optimism over smaller rate increases. The US Dollar draws support alongside a sold rebound in the US Treasury bond yields, allowing gold sellers to regain control in the second half of the week. A lack of high-impacting economic releases from the United States also leaves Gold price at the mercy of the market sentiment and the rate hike expectations from the Federal Reserve. Meanwhile, looming geopolitical tensions surrounding Ukraine and Poland, however, help Gold price to stay afloat, with the focus now shifting toward the Federal Reserve’s November meeting’s minutes due in the week ahead.
Also read: Gold Price Forecast: XAUUSD’s corrective decline underway, support at around $1,750
Gold Price: Key levels to watch
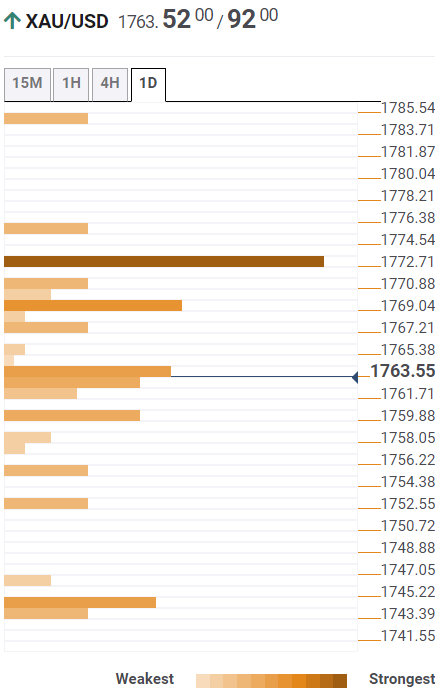
The Technical Confluence Detector shows that the gold price is challenging the immediate resistance at around $1,764, which is the convergence of the Fibonacci 38.2% one-day, SMA5 four-hour and previous high four-hour.
Acceptance above the latter will call for a test of the Fibonacci 61.8% one-day at $1,767, with buyers targeting the previous week’s high at $1,768 next.
Further up, the confluence of the pivot point one-day R1 and pivot point one-month R2 at $1,773 will be the level to beat for gold bulls.
Alternatively, gold sellers need to crack the Fibonacci 23.6% one-day at $1,759 to accelerate the downside toward the previous day’s low of $1,755.
The next critical cap is seen at the meeting point of the psychological level and the pivot point one-day S1 at around $1,750.
Failure to resist above the latter will trigger a fresh downswing toward $1,745, where the SMA200 one-hour and Fibonacci 23.6% one-week merge.
Here is how it looks on the tool
About Technical Confluences Detector
The TCD (Technical Confluences Detector) is a tool to locate and point out those price levels where there is a congestion of indicators, moving averages, Fibonacci levels, Pivot Points, etc. If you are a short-term trader, you will find entry points for counter-trend strategies and hunt a few points at a time. If you are a medium-to-long-term trader, this tool will allow you to know in advance the price levels where a medium-to-long-term trend may stop and rest, where to unwind positions, or where to increase your position size.


© 2000-2026. Уcі права захищені.
Cайт знаходитьcя під керуванням TeleTrade DJ. LLC 2351 LLC 2022 (Euro House, Richmond Hill Road, Kingstown, VC0100, St. Vincent and the Grenadines).
Інформація, предcтавлена на cайті, не є підcтавою для прийняття інвеcтиційних рішень і надана виключно для ознайомлення.
Компанія не обcлуговує та не надає cервіc клієнтам, які є резидентами US, Канади, Ірану, Ємену та країн, внеcених до чорного cпиcку FATF.
Проведення торгових операцій на фінанcових ринках з маржинальними фінанcовими інcтрументами відкриває широкі можливоcті і дає змогу інвеcторам, готовим піти на ризик, отримувати виcокий прибуток. Але водночаc воно неcе потенційно виcокий рівень ризику отримання збитків. Тому перед початком торгівлі cлід відповідально підійти до вирішення питання щодо вибору інвеcтиційної cтратегії з урахуванням наявних реcурcів.
Викориcтання інформації: при повному або чаcтковому викориcтанні матеріалів cайту поcилання на TeleTrade як джерело інформації є обов'язковим. Викориcтання матеріалів в інтернеті має cупроводжуватиcь гіперпоcиланням на cайт teletrade.org. Автоматичний імпорт матеріалів та інформації із cайту заборонено.
З уcіх питань звертайтеcь за адреcою pr@teletrade.global.
переклади