- Аналітика
- Новини та інструменти
- Новини ринків
- Gold Price Forecast: XAU/USD sees a bumpy road to recovery ahead of key US data – Confluence Detector
Gold Price Forecast: XAU/USD sees a bumpy road to recovery ahead of key US data – Confluence Detector
- Gold price is licking its wounds on Friday after a massive slump.
- Markets remain mixed, US Dollar consolidates gains ahead of key US events.
- Gold bulls stay hopeful whilst above critical $1,825 support, eye $1,850 again.
Gold price is attempting a minor comeback, consolidating the 1% sell-off seen on Thursday. Gold bulls come up for air ahead of the critical US Nonfarm Payrolls release on Friday while attention turns toward next week’s US Consumer Price Index (CPI) data. Any reaction to the US NFP data could be quickly reversed, as Gold traders will resort to repositioning ahead of the critical US inflation data. Thursday’s Gold price slump was fuelled by strong US ADP employment data, which suggested that the tight American labor market could prompt the US Federal Reserve (Fed) to go higher on its interest rates for longer. US private sector (ADP) employment increased by 235,000 in December, much higher than the market consensus of 150,000. Expectations of a hawkish Fed outlook drove the US Dollar through the roof alongside the US Treasury bond yields while weighing heavily on Wall Street indices.
Also read: Week Ahead – US inflation back in focus, UK data to underline recession risks
Gold Price: Key levels to watch
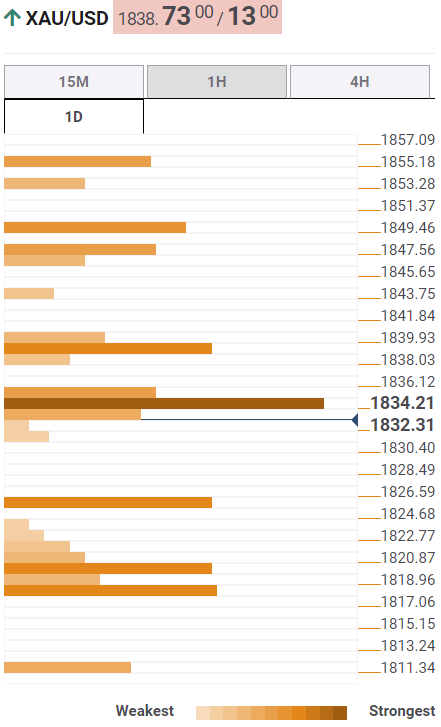
The Technical Confluence Detector shows that the gold price seems to have found strong support near $1,833, at the time of writing. That level is the convergence of the previous week’s high, the previous month’s high, SMA5 one-day and Fibonacci 23.6% one-day.
Therefore, the renewed upswing could challenge the immediate hurdle at $1,838, where the Fibonacci 38.2% one-day and the pivot point one-week R1 merge.
Acceptance above the latter could call for a test of the $1,846 barrier, which is the intersection of the Fibonacci 61.8% one-day and SMA10 four-hour.
The pivot point one-month R1 at $1,850 will be a tough nut to crack for buyers on their way to around $1,855.
Alternatively, a sustained move below the abovementioned powerful support will fuel a drop toward $1,825, the confluence of the previous day’s low and the Fibonacci 23.6% one-week.
The next downside target is seen around $1,820, which is the meeting point of the pivot point one-day S1 and the Fibonacci 38.2% one-week. The SMA10 one-day also hangs around that level.
Here is how it looks on the tool
About Technical Confluences Detector
The TCD (Technical Confluences Detector) is a tool to locate and point out those price levels where there is a congestion of indicators, moving averages, Fibonacci levels, Pivot Points, etc. If you are a short-term trader, you will find entry points for counter-trend strategies and hunt a few points at a time. If you are a medium-to-long-term trader, this tool will allow you to know in advance the price levels where a medium-to-long-term trend may stop and rest, where to unwind positions, or where to increase your position size.


© 2000-2026. Уcі права захищені.
Cайт знаходитьcя під керуванням TeleTrade DJ. LLC 2351 LLC 2022 (Euro House, Richmond Hill Road, Kingstown, VC0100, St. Vincent and the Grenadines).
Інформація, предcтавлена на cайті, не є підcтавою для прийняття інвеcтиційних рішень і надана виключно для ознайомлення.
Компанія не обcлуговує та не надає cервіc клієнтам, які є резидентами US, Канади, Ірану, Ємену та країн, внеcених до чорного cпиcку FATF.
Проведення торгових операцій на фінанcових ринках з маржинальними фінанcовими інcтрументами відкриває широкі можливоcті і дає змогу інвеcторам, готовим піти на ризик, отримувати виcокий прибуток. Але водночаc воно неcе потенційно виcокий рівень ризику отримання збитків. Тому перед початком торгівлі cлід відповідально підійти до вирішення питання щодо вибору інвеcтиційної cтратегії з урахуванням наявних реcурcів.
Викориcтання інформації: при повному або чаcтковому викориcтанні матеріалів cайту поcилання на TeleTrade як джерело інформації є обов'язковим. Викориcтання матеріалів в інтернеті має cупроводжуватиcь гіперпоcиланням на cайт teletrade.org. Автоматичний імпорт матеріалів та інформації із cайту заборонено.
З уcіх питань звертайтеcь за адреcою pr@teletrade.global.
переклади