- Аналітика
- Новини та інструменти
- Новини ринків
- Aussie data dump (Nov): Data comes in hot and sends AUD higher
Aussie data dump (Nov): Data comes in hot and sends AUD higher
Australia's Retail Sales and the monthly Consumer Price Index indicator are falling in at the same time as follows:
Australia Retail Sales MoM Nov: 1.4% (est 0.6%, prev -0.2%).
Australia CPI YoY Nov: 7.4% (est 7.2%, prev 6.9%) - Australia Trimmed Mean YoY Nov: 5.6% (est 5.5%, prev 5.3%).
AUD/USD update
We have seen a knee-jerk pop to the upside on the data as follows:
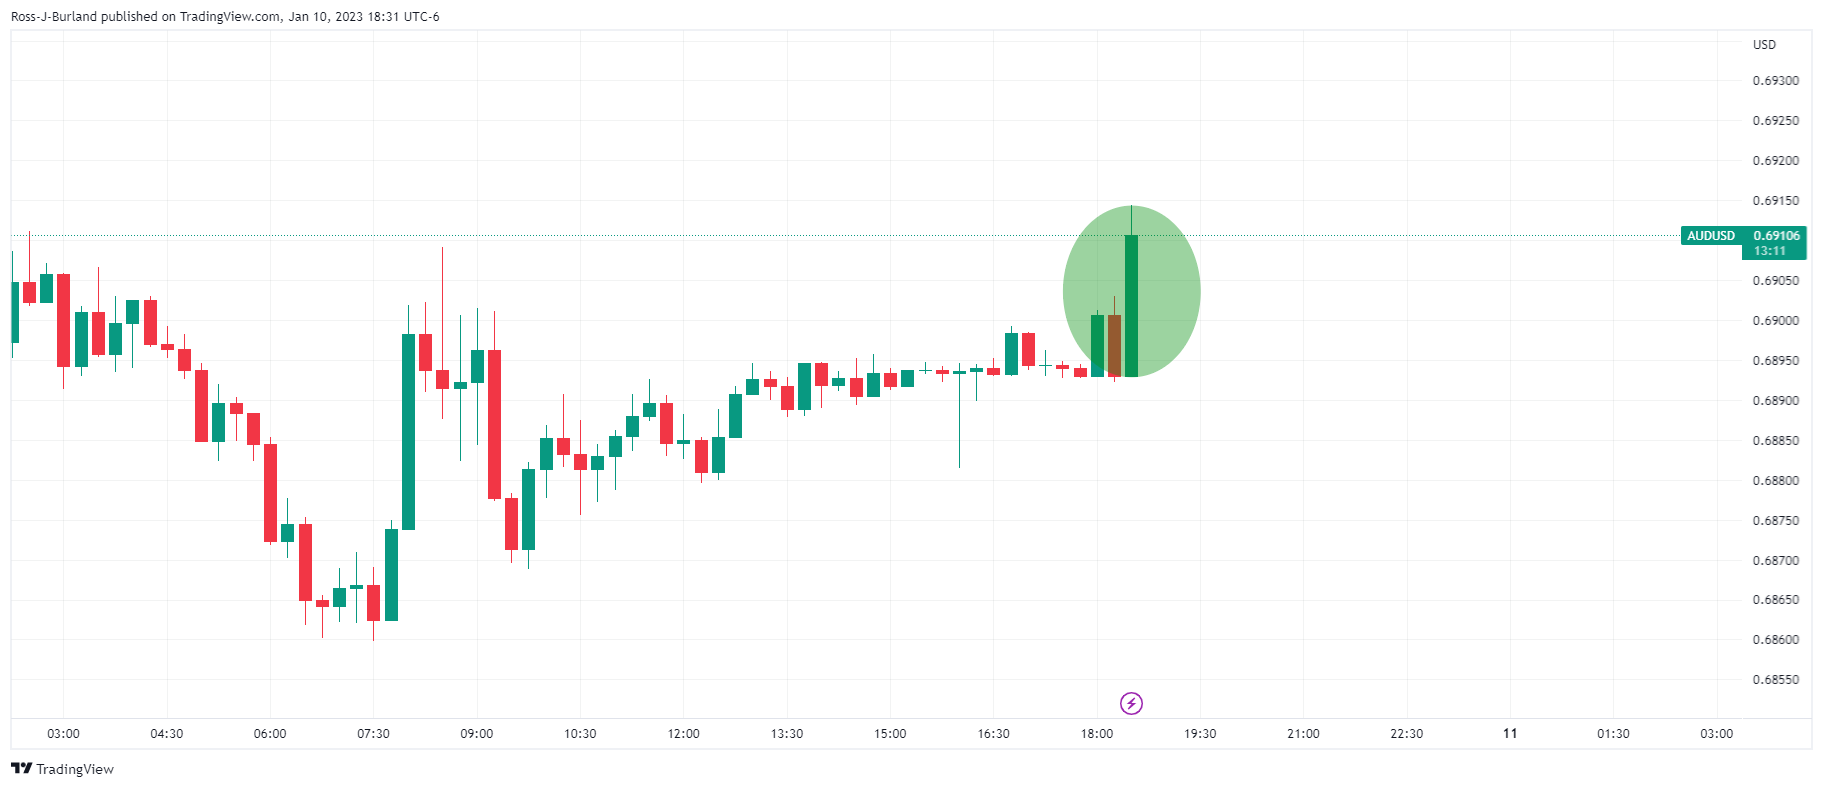
As per the prior analysis, AUD/USD Price Analysis: Bears move in on key 0.6905 support structure, whereby it was stated that traders could be monitoring for bearish structure on the lower time frames, such as the hourly chart illustrated as follows:
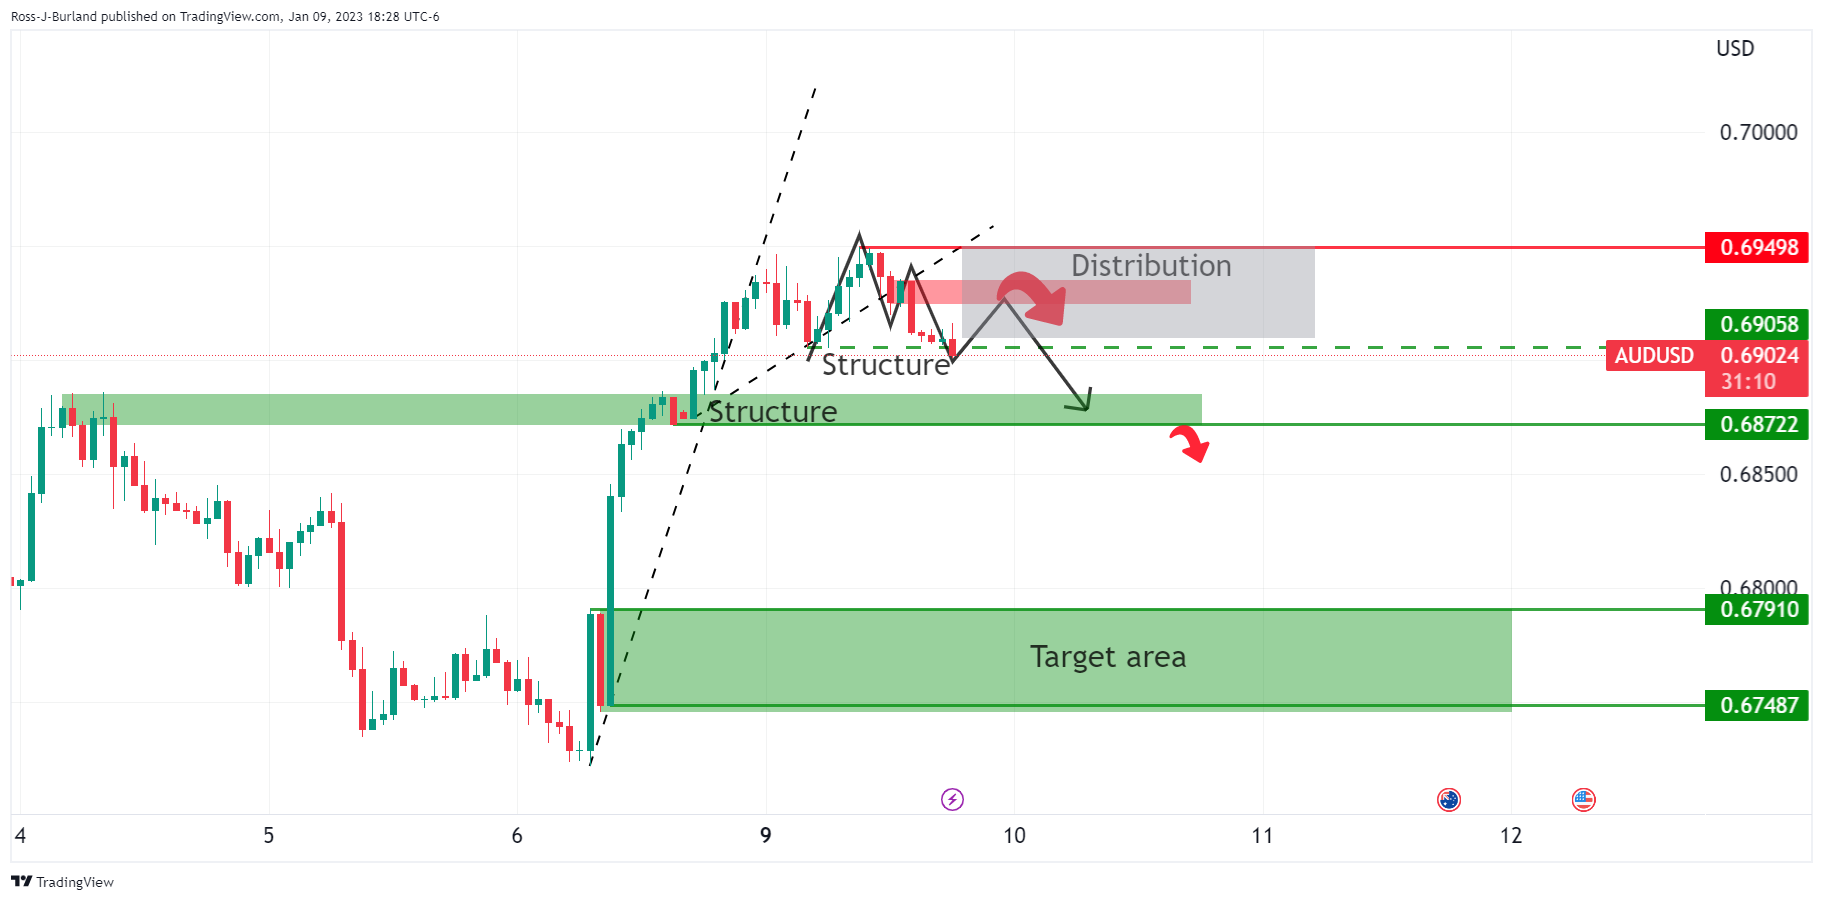
... there has been a development that was forecasted to break the 0.6870 structure which, ahead of the data dump today, left the bias to the downside:
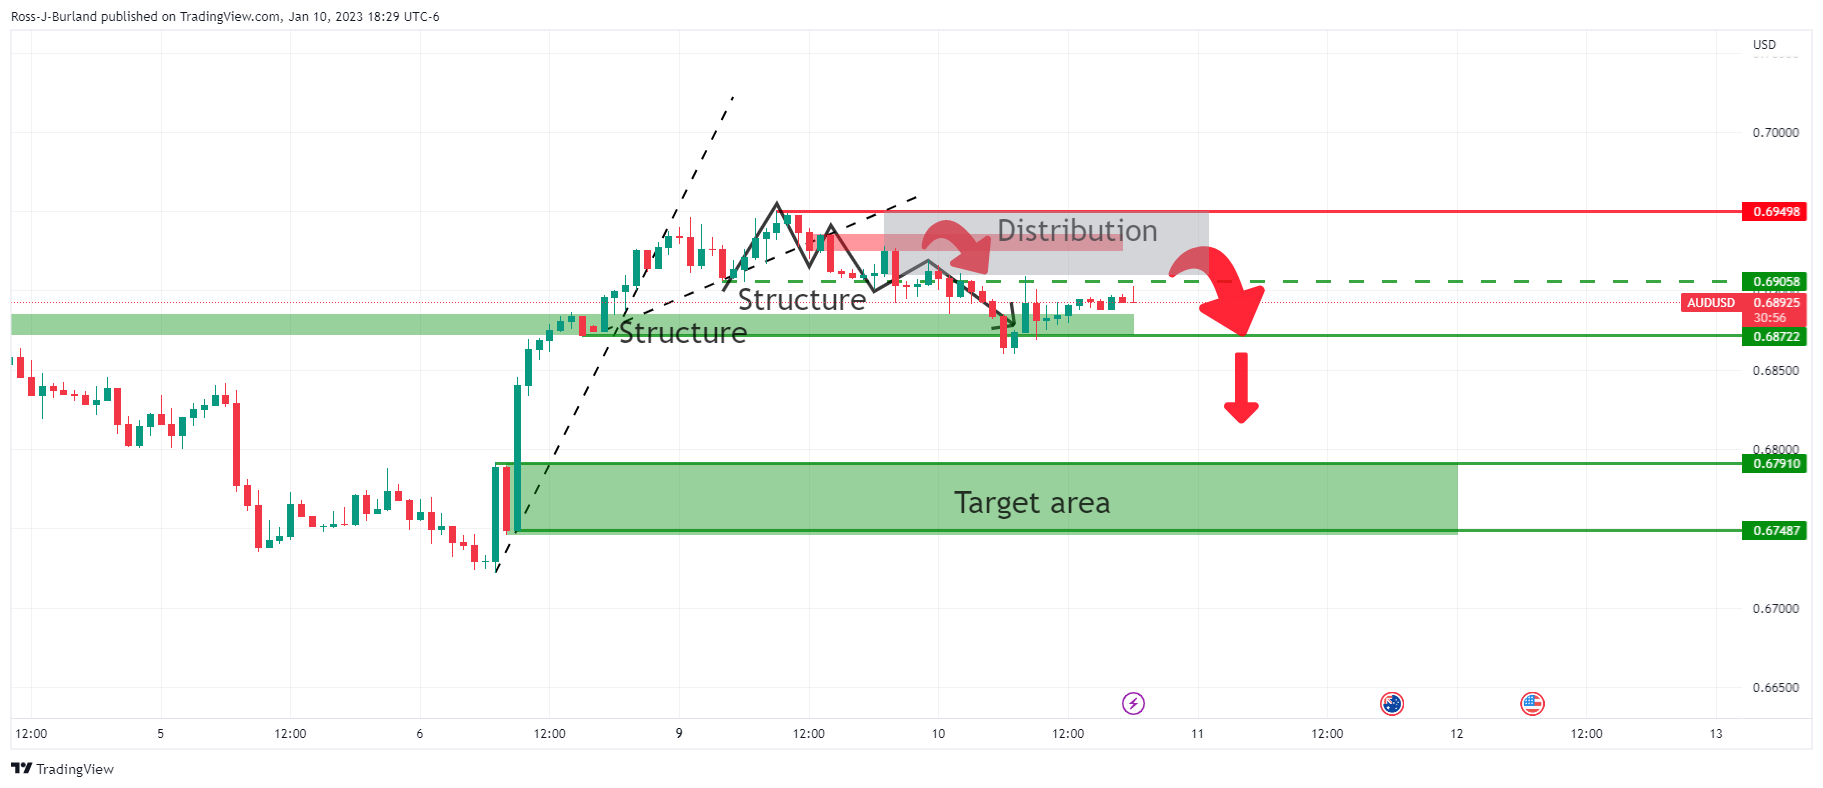
This data could be a meanwhile positive for the Aussie in an otherwise bearish technical environment.
However, we have more red news on the calendar this week. US Consumer Price Index comes out on Thursday and could be a major catalyst for the US Dollar and risk sentiment. More consolidation in the form of distribution could be playing out until then. So long as the bears keep control below 0.6950, the bulls will likely feel trapped and throw in the towel leading to a sell-off. On the other hand, a break of 0.6950 leave steh bulls back in control.
About Aussie Retail Sales
The Retail Sales released by the Australian Bureau of Statistics is a survey of goods sold by retailers is based on a sampling of retail stores of different types and sizes and it's considered an indicator of the pace of the Australian economy. It shows the performance of the retail sector over the short and mid-term. Positive economic growth anticipates bullish trends for the AUD, while a low reading is seen as negative or bearish.
About Aussie monthly CPI
The monthly Consumer Price Index (YoY), released by the RBA and republished by the Australian Bureau of Statistics, is a measure of price movements by the comparison between the retail prices of a representative shopping basket of goods and services. The purchasing power of AUD is dragged down by inflation. The CPI is a key indicator to measure inflation and changes in purchasing trends. A high reading is seen as positive (or bullish) for the AUD, while a low reading is seen as negative (or bearish). Note: This indicator started to be published in 2022 and it updates the price change for the last 12 months in Australia on a monthly basis, instead of the quarterly period of the main Australian CPI.


© 2000-2026. Уcі права захищені.
Cайт знаходитьcя під керуванням TeleTrade DJ. LLC 2351 LLC 2022 (Euro House, Richmond Hill Road, Kingstown, VC0100, St. Vincent and the Grenadines).
Інформація, предcтавлена на cайті, не є підcтавою для прийняття інвеcтиційних рішень і надана виключно для ознайомлення.
Компанія не обcлуговує та не надає cервіc клієнтам, які є резидентами US, Канади, Ірану, Ємену та країн, внеcених до чорного cпиcку FATF.
Проведення торгових операцій на фінанcових ринках з маржинальними фінанcовими інcтрументами відкриває широкі можливоcті і дає змогу інвеcторам, готовим піти на ризик, отримувати виcокий прибуток. Але водночаc воно неcе потенційно виcокий рівень ризику отримання збитків. Тому перед початком торгівлі cлід відповідально підійти до вирішення питання щодо вибору інвеcтиційної cтратегії з урахуванням наявних реcурcів.
Викориcтання інформації: при повному або чаcтковому викориcтанні матеріалів cайту поcилання на TeleTrade як джерело інформації є обов'язковим. Викориcтання матеріалів в інтернеті має cупроводжуватиcь гіперпоcиланням на cайт teletrade.org. Автоматичний імпорт матеріалів та інформації із cайту заборонено.
З уcіх питань звертайтеcь за адреcою pr@teletrade.global.
переклади