- Аналітика
- Новини та інструменти
- Новини ринків
- Gold Price Forecast: XAU/USD eyes $1,918 and $1,922 on the road to recovery – Confluence Detector
Gold Price Forecast: XAU/USD eyes $1,918 and $1,922 on the road to recovery – Confluence Detector
- Gold price stages a decent comeback as US Dollar falls with Treasury bond yields.
- USD/JPY reversal post-BoJ also weighs down on the US Dollar ahead of US data.
- Gold price needs to take out the key $1,918 barrier to resume the uptrend.
Gold price has stalled its ongoing corrective downside, staging a decent comeback so far this Wednesday. The US Dollar has reversed its early gains amid falling US Treasury bond yields, which has helped Gold price recover lost ground. Meanwhile, Gold price continues to benefit from increased bets of smaller US Federal Reserve (Fed) rate hikes, although the US Retail Sales and Producer Price Index (PPI) will help shed more light on the same. Earlier in the day. the Bank of Japan (BoJ) stood pat on its yield control policy, which drove USD/JPY through the roof, propelling the US Dollar in tandem. Although the moves are seen reversing, as investors gear up for the high-impact US economic data.
Also read: Gold Price Forecast: XAU/USD eyes further correction toward $1,870 amid bearish technicals
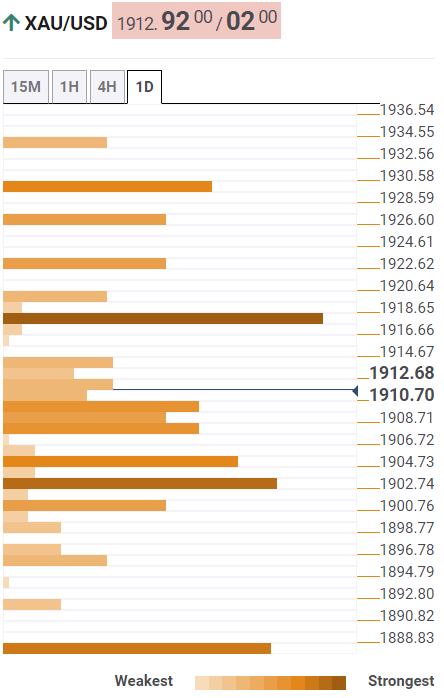
Gold Price: Key levels to watch
The Technical Confluence Detector shows that the gold price is facing immediate resistance at $1,914, which is the Fibonacci 61.8% one-day.
A break above which will put the powerful hurdle at $1,918 under threat. That level is the convergence of the pivot point one-month R3 and pivot point one-day R1.
Acceptance above the latter is critical to extending the renewed upside toward the previous week’s high at $1,922. Further up, the nine-month top at $1,929 will challenge bearish commitments.
On the flip side, a dense cluster of healthy support levels awaits around $1,909, which is the meeting point of the Fibonacci 23.6% one-week, Fibonacci 38.2% one-day and SMA5 four-hour.
Should bears flex their muscles, then the previous day’s low at $1,903 could be put to test. The last line of defense for Gold buyers is seen at the Fibonacci 38.2% one-week at $1,899.
Here is how it looks on the tool
About Technical Confluences Detector
The TCD (Technical Confluences Detector) is a tool to locate and point out those price levels where there is a congestion of indicators, moving averages, Fibonacci levels, Pivot Points, etc. If you are a short-term trader, you will find entry points for counter-trend strategies and hunt a few points at a time. If you are a medium-to-long-term trader, this tool will allow you to know in advance the price levels where a medium-to-long-term trend may stop and rest, where to unwind positions, or where to increase your position size.


© 2000-2026. Уcі права захищені.
Cайт знаходитьcя під керуванням TeleTrade DJ. LLC 2351 LLC 2022 (Euro House, Richmond Hill Road, Kingstown, VC0100, St. Vincent and the Grenadines).
Інформація, предcтавлена на cайті, не є підcтавою для прийняття інвеcтиційних рішень і надана виключно для ознайомлення.
Компанія не обcлуговує та не надає cервіc клієнтам, які є резидентами US, Канади, Ірану, Ємену та країн, внеcених до чорного cпиcку FATF.
Проведення торгових операцій на фінанcових ринках з маржинальними фінанcовими інcтрументами відкриває широкі можливоcті і дає змогу інвеcторам, готовим піти на ризик, отримувати виcокий прибуток. Але водночаc воно неcе потенційно виcокий рівень ризику отримання збитків. Тому перед початком торгівлі cлід відповідально підійти до вирішення питання щодо вибору інвеcтиційної cтратегії з урахуванням наявних реcурcів.
Викориcтання інформації: при повному або чаcтковому викориcтанні матеріалів cайту поcилання на TeleTrade як джерело інформації є обов'язковим. Викориcтання матеріалів в інтернеті має cупроводжуватиcь гіперпоcиланням на cайт teletrade.org. Автоматичний імпорт матеріалів та інформації із cайту заборонено.
З уcіх питань звертайтеcь за адреcою pr@teletrade.global.
переклади