- Аналітика
- Новини та інструменти
- Новини ринків
- Gold Price Forecast: XAU/USD eyes $1,950 as US Dollar Index cracks, US Q4 GDP eyed
Gold Price Forecast: XAU/USD eyes $1,950 as US Dollar Index cracks, US Q4 GDP eyed
- Gold price is looking to test the $1,950.00 resistance amid volatility in the USD Index.
- A pause in BoC’s policy tightening conveys that major central banks are near to the terminal rate.
- More-than-projected contraction in the US Q4 GDP might accelerate recession fears.
Gold price (XAU/USD) is aiming to test the $1,950.00 resistance for the first time in the past nine months as the US Dollar Index has faced immense pressure. The precious metal displayed a vertical rally after dropping to near $1,920.00amid rising hopes that the Federal Reserve (Fed) has no other option than to announce a smaller interest rate hike ahead. Also, a pause announced in the policy tightening by the Bank of Canada (BoC) has conveyed a message that major central banks have reached to the terminal rate.
The US Dollar Index (DXY) has dropped to near seven-month low of around 101.20 and a downside break will trigger massive selling from the market participants. S&P managed to recover losses, portrayed optimism in the market and dips are being capitalized as a buying opportunity in the risk-perceived assets by the market participants. The 10-year US Treasury yields dropped to 3.44%.
For further guidance, investors will keep an eye on the release of the preliminary United States Gross Domestic Product (GDP) data for the fourth quarter of CY2022. As per the projections, the annualized GDP is seen lower at 2.6% vs. the prior release of 3.2%. An expression of a contraction in overall economic activities might accelerate recession fears on a broader basis.
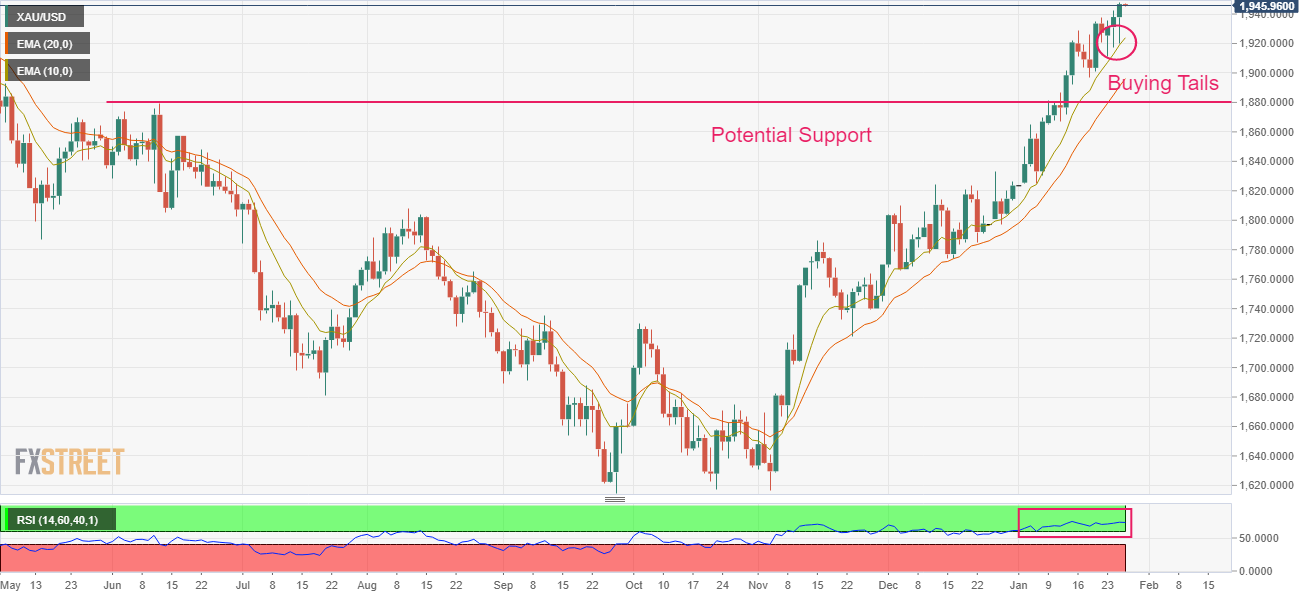
Gold technical analysis
Gold price is in a strong uptrend forming higher highs and higher lows on a daily scale. The precious metal has witnessed three consecutive buying tails, which indicates that the market participants are buying the dips with immense interest. On a broader note, horizontal support plotted from June 13 high at $1,879.26 will be a cushion for the Gold price.
The 10-and 20-period Exponential Moving Averages (EMAs) at $1,924.74 and $1,895.26 respectively are aiming higher, which signals more upside ahead.
Also, the Relative Strength Index (RSI) (14) is oscillating in a bullish range of 60.00-80.00, which indicates that the bullish momentum is active.
Gold daily chart


© 2000-2026. Уcі права захищені.
Cайт знаходитьcя під керуванням TeleTrade DJ. LLC 2351 LLC 2022 (Euro House, Richmond Hill Road, Kingstown, VC0100, St. Vincent and the Grenadines).
Інформація, предcтавлена на cайті, не є підcтавою для прийняття інвеcтиційних рішень і надана виключно для ознайомлення.
Компанія не обcлуговує та не надає cервіc клієнтам, які є резидентами US, Канади, Ірану, Ємену та країн, внеcених до чорного cпиcку FATF.
Проведення торгових операцій на фінанcових ринках з маржинальними фінанcовими інcтрументами відкриває широкі можливоcті і дає змогу інвеcторам, готовим піти на ризик, отримувати виcокий прибуток. Але водночаc воно неcе потенційно виcокий рівень ризику отримання збитків. Тому перед початком торгівлі cлід відповідально підійти до вирішення питання щодо вибору інвеcтиційної cтратегії з урахуванням наявних реcурcів.
Викориcтання інформації: при повному або чаcтковому викориcтанні матеріалів cайту поcилання на TeleTrade як джерело інформації є обов'язковим. Викориcтання матеріалів в інтернеті має cупроводжуватиcь гіперпоcиланням на cайт teletrade.org. Автоматичний імпорт матеріалів та інформації із cайту заборонено.
З уcіх питань звертайтеcь за адреcою pr@teletrade.global.
переклади