- Аналітика
- Новини та інструменти
- Новини ринків
- Gold Price Forecast: XAU/USD bears need validation from $1,920 and US GDP – Confluence Detector
Gold Price Forecast: XAU/USD bears need validation from $1,920 and US GDP – Confluence Detector
- Gold buyers struggle around multi-month high, snaps three-day uptrend, but stays comfortable beyond $1,920 support confluence.
- Pre-data anxiety joins fading hawkish bias on Fed to probe XAU/USD bulls.
- Firmer prints of US Q4 GDP, Core PCE could renew bullish bets on FOMC and extend latest pullback.
Gold price (XAU/USD) retreats from a nine-month high as bulls await the key US data/events for further directions while aiming for the fresh multi-month peak surrounding the mid-$1,900s. In addition to the cautious mood ahead of the key US growth and inflation data, a light calendar and contrasting plays between the Federal Reserve (Fed) and the European Central Bank (ECB) officials also seem to weigh on the Gold price of late.
That said, holidays in China and Fed’s blackout join the ECB’s one-week silence period starting from Thursday to restrict immediate XAU/USD moves.
Also read: Gold Price Forecast: XAU/USD bulls approach $1,967 ahead of United States Gross Domestic Product
Gold Price: Key levels to watch
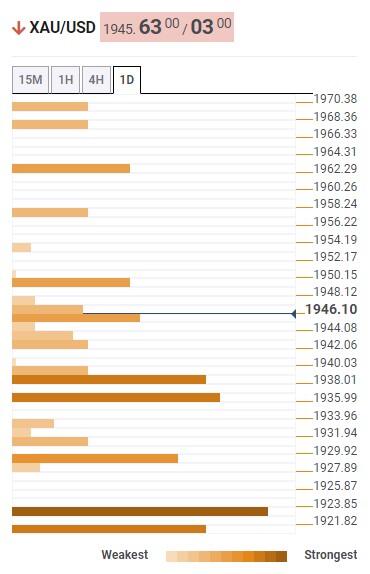
The Technical Confluence Detector shows that the Gold price grinds higher past the $1,920 support confluence including the previous lows on one-day and one-week.
Also putting floor under the Gold price could be the convergence of Fibonacci 38.2% on one-week, 200-Hourly Moving Average (HMA) and the 10-DMA, close to $1,917.
It’s worth noting that Fibonacci 38.2% on one-day and previous weekly top offers immediate support to the Gold price near $1,940. Additionally, a joint of the 5-DMA and 10-SMA on four-hour could test the XAU/USD bears around $1,935.
Meanwhile, previous daily high and four-hour peak probes Gold buyers near $1,950.
However, major attention is given to the $1,963-66 area comprising Pivot Point one-wee R2 and tops marked during late March 2022.
Should the Gold buyers keep the reins past $1,966, the odds of witnessing the $2,000 on the chart can’t be ruled out.
Here is how it looks on the tool
About Technical Confluences Detector
The TCD (Technical Confluences Detector) is a tool to locate and point out those price levels where there is a congestion of indicators, moving averages, Fibonacci levels, Pivot Points, etc. If you are a short-term trader, you will find entry points for counter-trend strategies and hunt a few points at a time. If you are a medium-to-long-term trader, this tool will allow you to know in advance the price levels where a medium-to-long-term trend may stop and rest, where to unwind positions, or where to increase your position size.


© 2000-2026. Уcі права захищені.
Cайт знаходитьcя під керуванням TeleTrade DJ. LLC 2351 LLC 2022 (Euro House, Richmond Hill Road, Kingstown, VC0100, St. Vincent and the Grenadines).
Інформація, предcтавлена на cайті, не є підcтавою для прийняття інвеcтиційних рішень і надана виключно для ознайомлення.
Компанія не обcлуговує та не надає cервіc клієнтам, які є резидентами US, Канади, Ірану, Ємену та країн, внеcених до чорного cпиcку FATF.
Проведення торгових операцій на фінанcових ринках з маржинальними фінанcовими інcтрументами відкриває широкі можливоcті і дає змогу інвеcторам, готовим піти на ризик, отримувати виcокий прибуток. Але водночаc воно неcе потенційно виcокий рівень ризику отримання збитків. Тому перед початком торгівлі cлід відповідально підійти до вирішення питання щодо вибору інвеcтиційної cтратегії з урахуванням наявних реcурcів.
Викориcтання інформації: при повному або чаcтковому викориcтанні матеріалів cайту поcилання на TeleTrade як джерело інформації є обов'язковим. Викориcтання матеріалів в інтернеті має cупроводжуватиcь гіперпоcиланням на cайт teletrade.org. Автоматичний імпорт матеріалів та інформації із cайту заборонено.
З уcіх питань звертайтеcь за адреcою pr@teletrade.global.
переклади