- Аналітика
- Новини та інструменти
- Новини ринків
- Gold Price Forecast: XAU/USD fails to kiss $1,950 as USD Index attempts recovery
Gold Price Forecast: XAU/USD fails to kiss $1,950 as USD Index attempts recovery
- Gold price is struggling to test the $1,950.00 resistance as anxiety soars ahead of the US GDP.
- The USD Index is building a cushion around 101.10 but could deliver a breakdown amid a risk-on mood.
- Rising odds of a smaller interest rate hike by the Fed are weighing down US yields.
Gold price (XAU/USD) has sensed selling pressure while attempting to kiss the critical resistance of $1,950.00. The precious metal is not getting the desired strength required to hit the $1,950.00 hurdle as investors are getting anxious ahead of the release of the United States Gross Domestic Product (GDP) and other critical economic data.
The US Dollar Index (DXY) is constantly grueling to build a cushion around 101.20 despite the upbeat market mood. S&P500 futures are displaying moderate gains, conveying the expression of the solid risk appetite of the market participants. The 10-year US Treasury yields have dropped to near 3.44%.
The street is continuously discussing the chances of a US recession in CY2023 as the Federal Reserve (Fed) has already tightened monetary policy significantly. The release of the US GDP data will provide more clarity about the scales of economic activities in the fourth quarter of CY2022. As per the projections, the US GDP is expected to contract to 2.6% from the former release of 3.2%. More-than-expected contraction in economic activities might bolster the case of a smaller interest rate hike by the Fed.
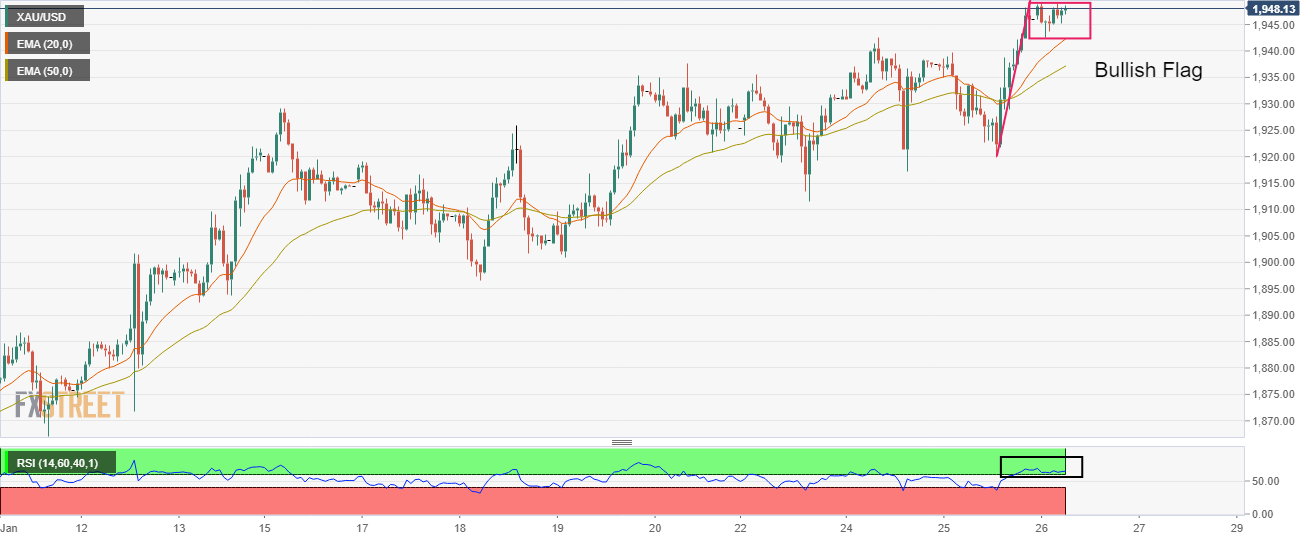
Gold technical analysis
Gold price is forming a Bullish Flag chart pattern on an hourly scale, which indicates a continuation of the bullish momentum after the breakout of a consolidation. Usually, the consolidation phase of the chart pattern serves as an inventory adjustment in which those participants initiate longs, which prefer to enter an auction after the establishment of a bullish bias.
Advancing 20-and 50-period Exponential Moving Averages (EMAs) at $1,942.46 and $1,937.35 respectively add to the upside filters.
The Relative Strength Index (RSI) (14) is oscillating in a bullish range of 60.00-80.00, which indicates more upside ahead.
Gold hourly chart


© 2000-2026. Уcі права захищені.
Cайт знаходитьcя під керуванням TeleTrade DJ. LLC 2351 LLC 2022 (Euro House, Richmond Hill Road, Kingstown, VC0100, St. Vincent and the Grenadines).
Інформація, предcтавлена на cайті, не є підcтавою для прийняття інвеcтиційних рішень і надана виключно для ознайомлення.
Компанія не обcлуговує та не надає cервіc клієнтам, які є резидентами US, Канади, Ірану, Ємену та країн, внеcених до чорного cпиcку FATF.
Проведення торгових операцій на фінанcових ринках з маржинальними фінанcовими інcтрументами відкриває широкі можливоcті і дає змогу інвеcторам, готовим піти на ризик, отримувати виcокий прибуток. Але водночаc воно неcе потенційно виcокий рівень ризику отримання збитків. Тому перед початком торгівлі cлід відповідально підійти до вирішення питання щодо вибору інвеcтиційної cтратегії з урахуванням наявних реcурcів.
Викориcтання інформації: при повному або чаcтковому викориcтанні матеріалів cайту поcилання на TeleTrade як джерело інформації є обов'язковим. Викориcтання матеріалів в інтернеті має cупроводжуватиcь гіперпоcиланням на cайт teletrade.org. Автоматичний імпорт матеріалів та інформації із cайту заборонено.
З уcіх питань звертайтеcь за адреcою pr@teletrade.global.
переклади