- Аналітика
- Новини та інструменти
- Новини ринків
- Gold Price Forecast: XAU/USD have smooth road to $1,900 as US PCE Inflation, Fed loom – Confluence Detector
Gold Price Forecast: XAU/USD have smooth road to $1,900 as US PCE Inflation, Fed loom – Confluence Detector
- Gold price extends the previous day’s losses on breaking $1,937-38 key support.
- US Dollar’s rebound ahead of Fed’s preferred inflation gauge also weighs XAU/USD.
- Hopes of US debt ceiling extension, fading recession woes underpin USD strength.
- Firmer US Core PCE Price Index becomes necessary for the Fed to defend hawkish policy moves and the Gold sellers.
Gold price (XAU/USD) sticks onto the US GDP-inflicted bearish bias as the metal traders await the Federal Reserve’s (Fed) preferred inflation gauge, namely the US Core Personal Consumption Expenditures (PCE) Price Index details for December. In addition to the pre-data anxiety, confirmation of the six-week-old rising wedge bearish chart pattern also keeps XAU/USD sellers hopeful.
The metal reversed from the nine-month high after the upbeat US Gross Domestic Product (GDP) data renewed expectations of a few more rate hikes from the Fed before the policy. The personal consumption and the GDP price index details, however, challenged the hawkish bias and put a floor under the metal. Even so, the early Friday news suggesting the US House Republicans’ nearness to overcoming the debt ceiling woes seemed to have renewed the XAU/USD downside.
It should be noted, however, that the odds of witnessing a softer US inflation and a dovish Fed rate hike are too high, which in turn suggests limited downside room for the Gold price.
Also read: Gold Price Forecast: XAU/USD confirms bearish wedge ahead of United States inflation data
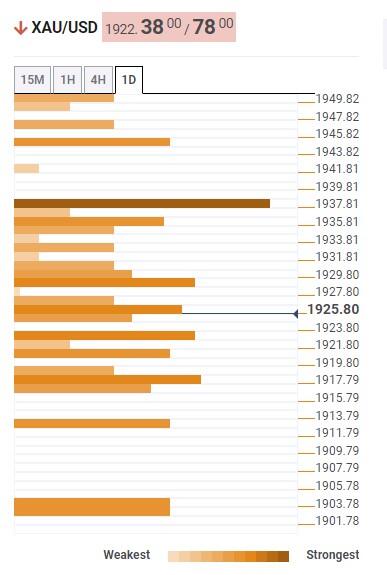
Gold Price: Key levels to watch
The Technical Confluence Detector shows that the Gold price stays depressed below the $1,937-38 resistance confluence, comprising the previous weekly high and Fibonacci 61.8% on daily chart.
As a result, the Fibonacci 38.2% on weekly and Pivot Point one-month R3, respectively around $1,920 and $1,917, appear imminent levels to grab for the XAU/USD sellers.
However, a slew of technical indicators encompassing the Pivot Point one-week S1 and S2, as well as SMA 100 on four-hour play, seem to highlight the $1,900 as a tough nut to crack for the Gold bears.
Alternatively, an upside clearance of the $1,938 resistance confluence will need validation from the $1,945 hurdle, including the Pivot Point one-week R1, to convince buyers.
Following that, a run-up towards late March 2022, close to $1,966, appears an easy play for the Gold buyers.
Here is how it looks on the tool
About Technical Confluences Detector
The TCD (Technical Confluences Detector) is a tool to locate and point out those price levels where there is a congestion of indicators, moving averages, Fibonacci levels, Pivot Points, etc. If you are a short-term trader, you will find entry points for counter-trend strategies and hunt a few points at a time. If you are a medium-to-long-term trader, this tool will allow you to know in advance the price levels where a medium-to-long-term trend may stop and rest, where to unwind positions, or where to increase your position size.


© 2000-2026. Уcі права захищені.
Cайт знаходитьcя під керуванням TeleTrade DJ. LLC 2351 LLC 2022 (Euro House, Richmond Hill Road, Kingstown, VC0100, St. Vincent and the Grenadines).
Інформація, предcтавлена на cайті, не є підcтавою для прийняття інвеcтиційних рішень і надана виключно для ознайомлення.
Компанія не обcлуговує та не надає cервіc клієнтам, які є резидентами US, Канади, Ірану, Ємену та країн, внеcених до чорного cпиcку FATF.
Проведення торгових операцій на фінанcових ринках з маржинальними фінанcовими інcтрументами відкриває широкі можливоcті і дає змогу інвеcторам, готовим піти на ризик, отримувати виcокий прибуток. Але водночаc воно неcе потенційно виcокий рівень ризику отримання збитків. Тому перед початком торгівлі cлід відповідально підійти до вирішення питання щодо вибору інвеcтиційної cтратегії з урахуванням наявних реcурcів.
Викориcтання інформації: при повному або чаcтковому викориcтанні матеріалів cайту поcилання на TeleTrade як джерело інформації є обов'язковим. Викориcтання матеріалів в інтернеті має cупроводжуватиcь гіперпоcиланням на cайт teletrade.org. Автоматичний імпорт матеріалів та інформації із cайту заборонено.
З уcіх питань звертайтеcь за адреcою pr@teletrade.global.
переклади