- Аналітика
- Новини та інструменти
- Новини ринків
- WTI Price Analysis: Bulls pile it on in $75.00 target area, focus is on Asian highs guarding $77.70
WTI Price Analysis: Bulls pile it on in $75.00 target area, focus is on Asian highs guarding $77.70
- WTI dropped to the %75s and now the daily chart shows the price breaking the trendline support.
- WTI, however, is now correcting higher to $76.70 resistance.
- The $77.70s are eyed as a 61.8% ratio target.
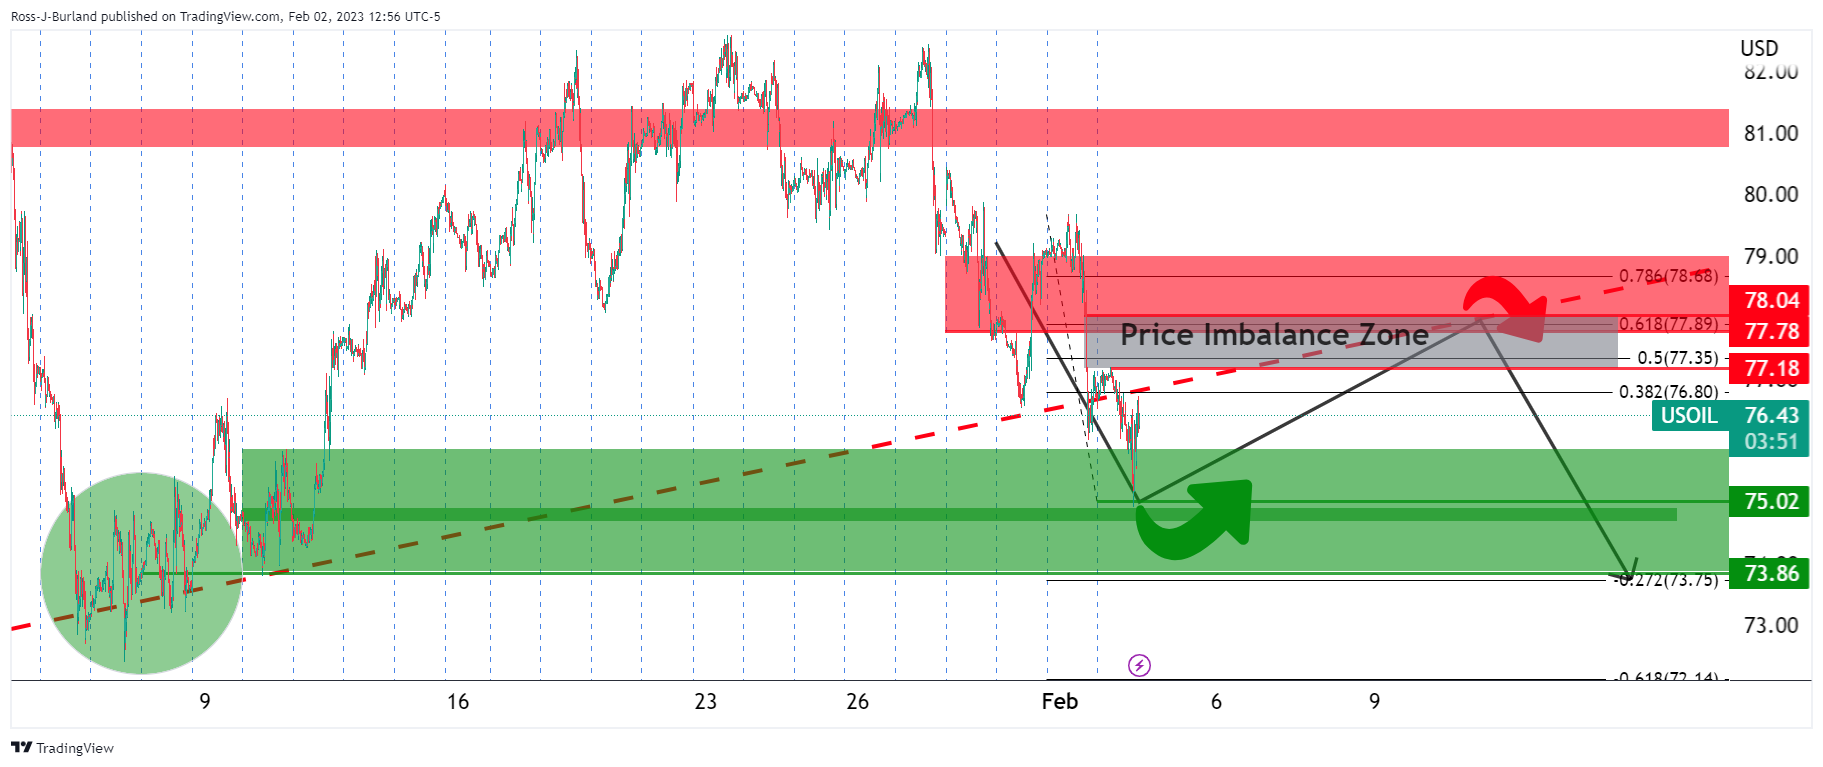
As per the prior analysis of the week, targetting the $75s target area, the objective was reached in the New york equities cash opening window with heightened volatility. The focus is now on the upside as the bulls move in for the kill to sweep the buy liquidity with a focus on the Asian highs that guard the price imbalances above. Targets are placed around $77.50 (50% mean reversion area), $77.70 (Mondayinitial balance lows) and a 61.8% Fibonacci retracement of the latest bearish impulse around $78.80 as the following analysis illustrates.
WTI, prior analysis
WTI bears taking control into the Fed, eyes on $75.00bbl
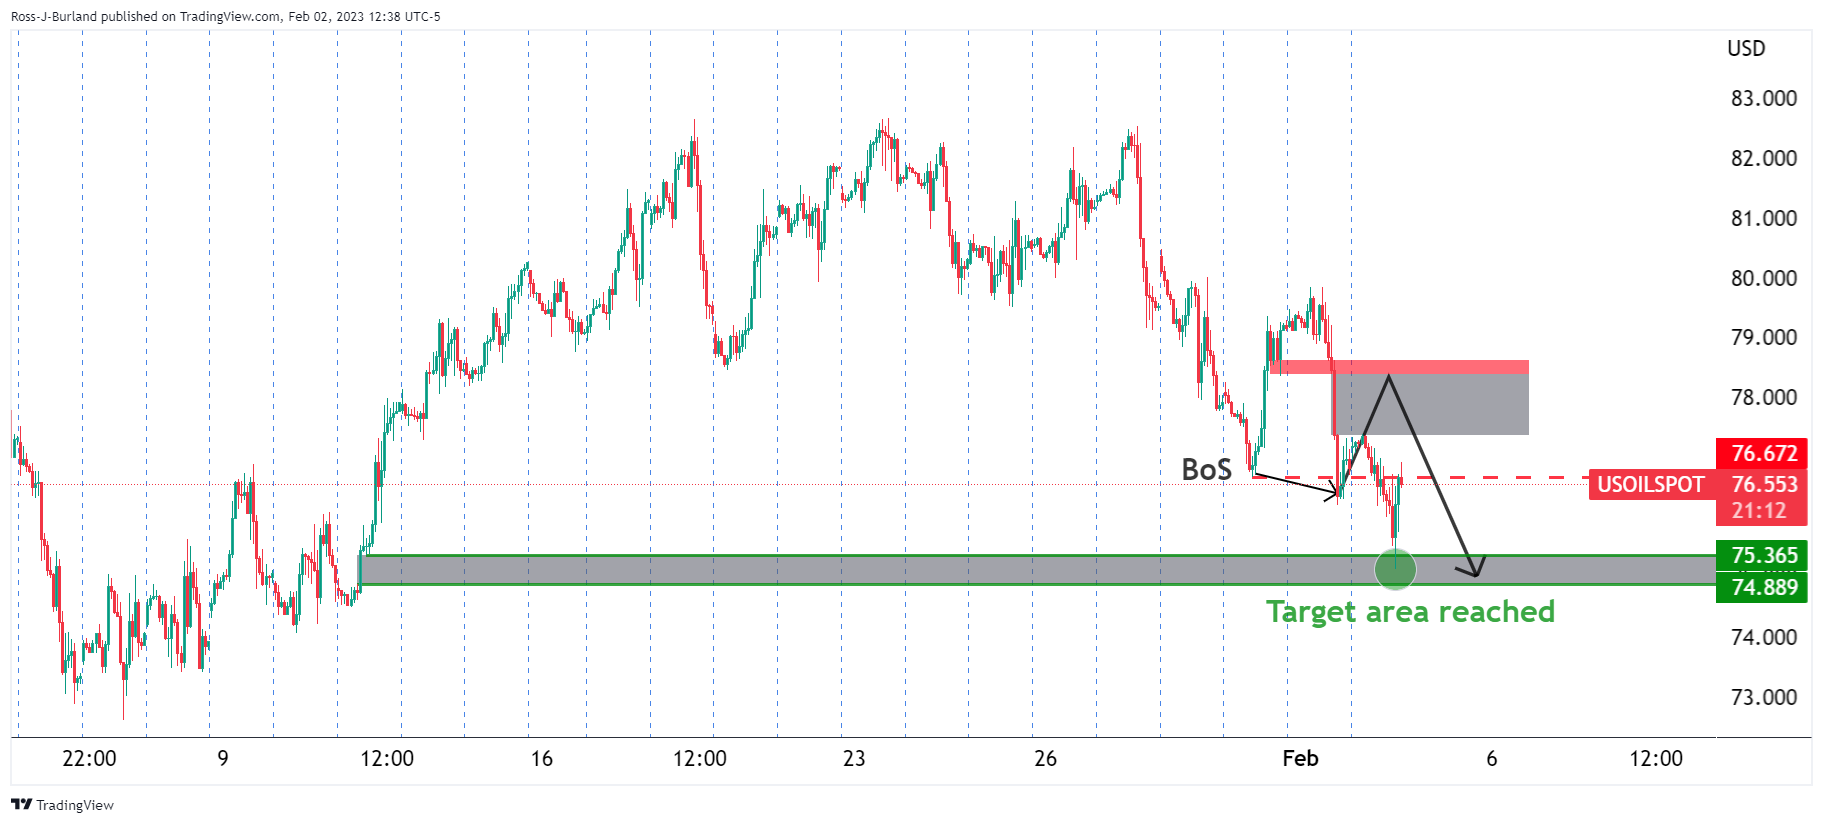
WTI Price Analysis: Bears break key hourly structure, eye $75.00bbls
It was suggested that ''a correction into resistance could entice trapped longs to get out of losing or breakeven positions and subsequently the shorts coming onto the market around 38.2% Fibonacci correction could see a move out of the consolidation below the trapped volume and into a 100% measured target towards $75.00 over the course of the coming week.''
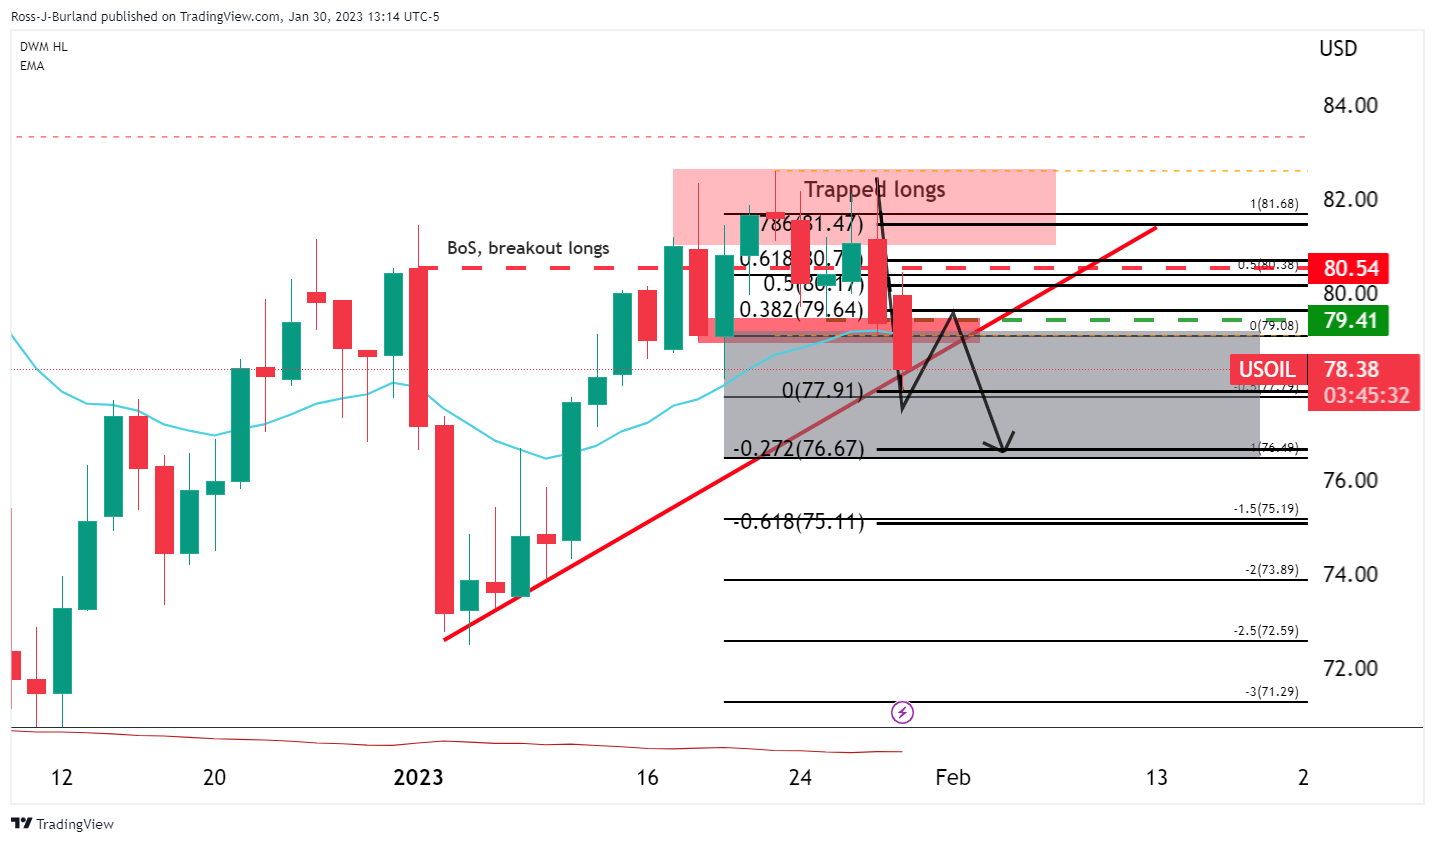
As illustrated, the price sank into the target area following a correction into where shorts were looking to get in at a premium. The subsequent move had fulfilled the 100% measured move and $75.00 was beckoning:
WTI H1 charts, prior analysis
Zoomed in ...
The greyed areas were price imbalances while the red marking was a resistance zone that had a confluence with the 61.8% Fibonacci retracement level near $78.50. While below there, the bias was to the downside.
However, a more shallow correction may be all that was needed. Either way, bears were looking to target between $75.36 and $74.88 on a break of $75.50.
WTI Update
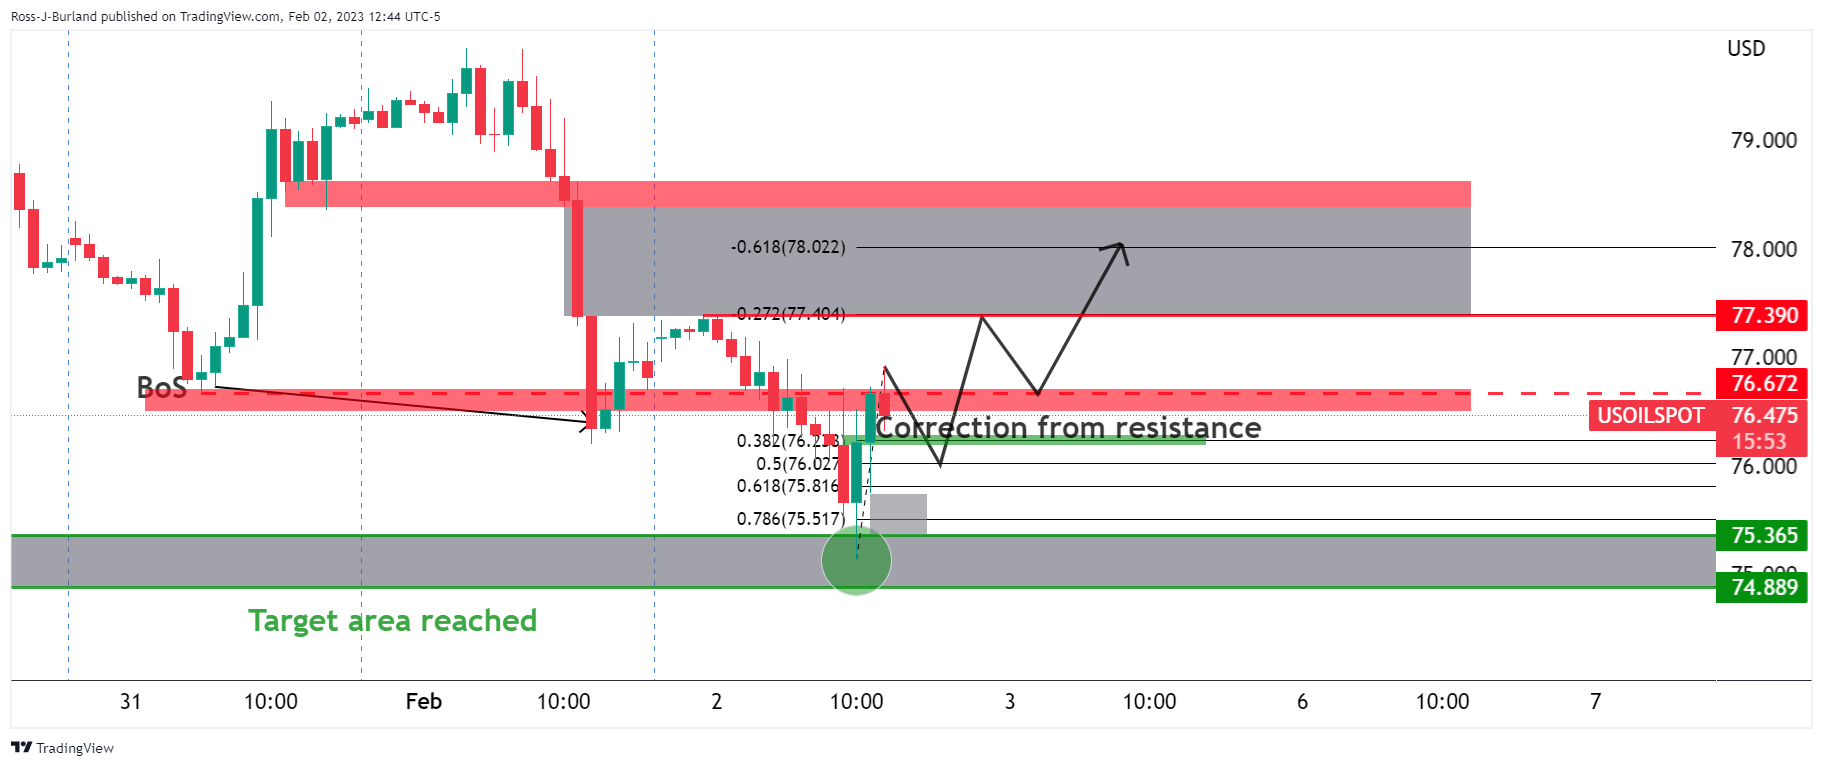
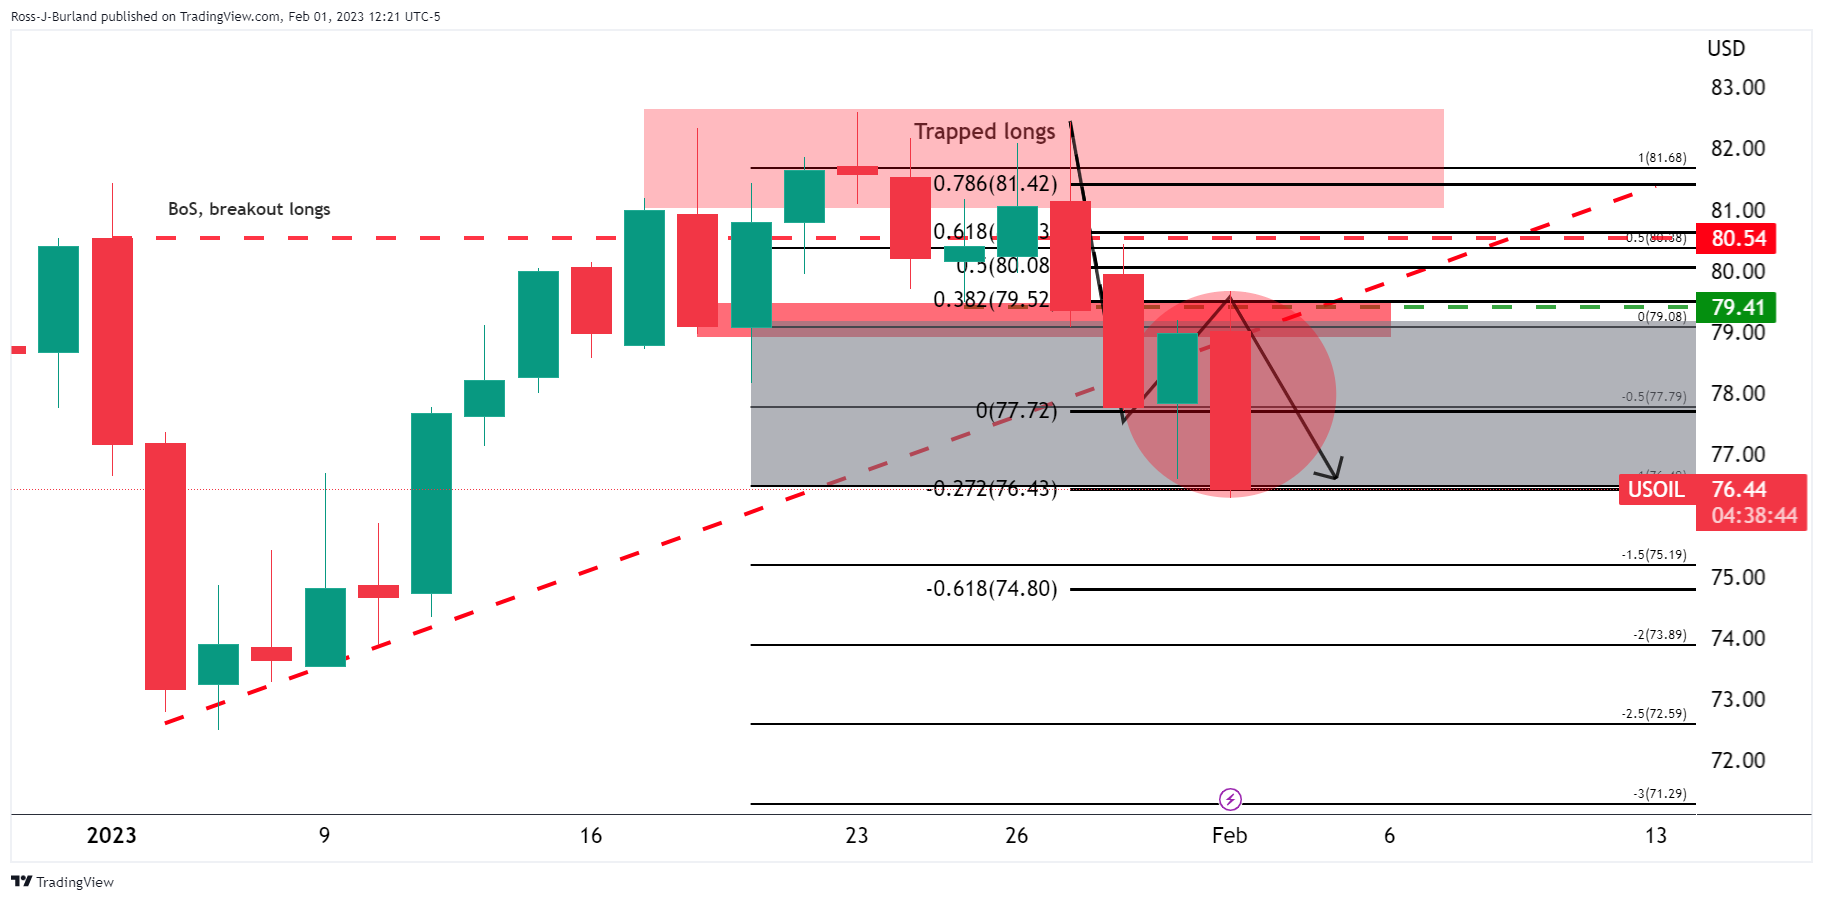
The price has reached the resistance and a correction is underway.
WTI daily and M15 charts
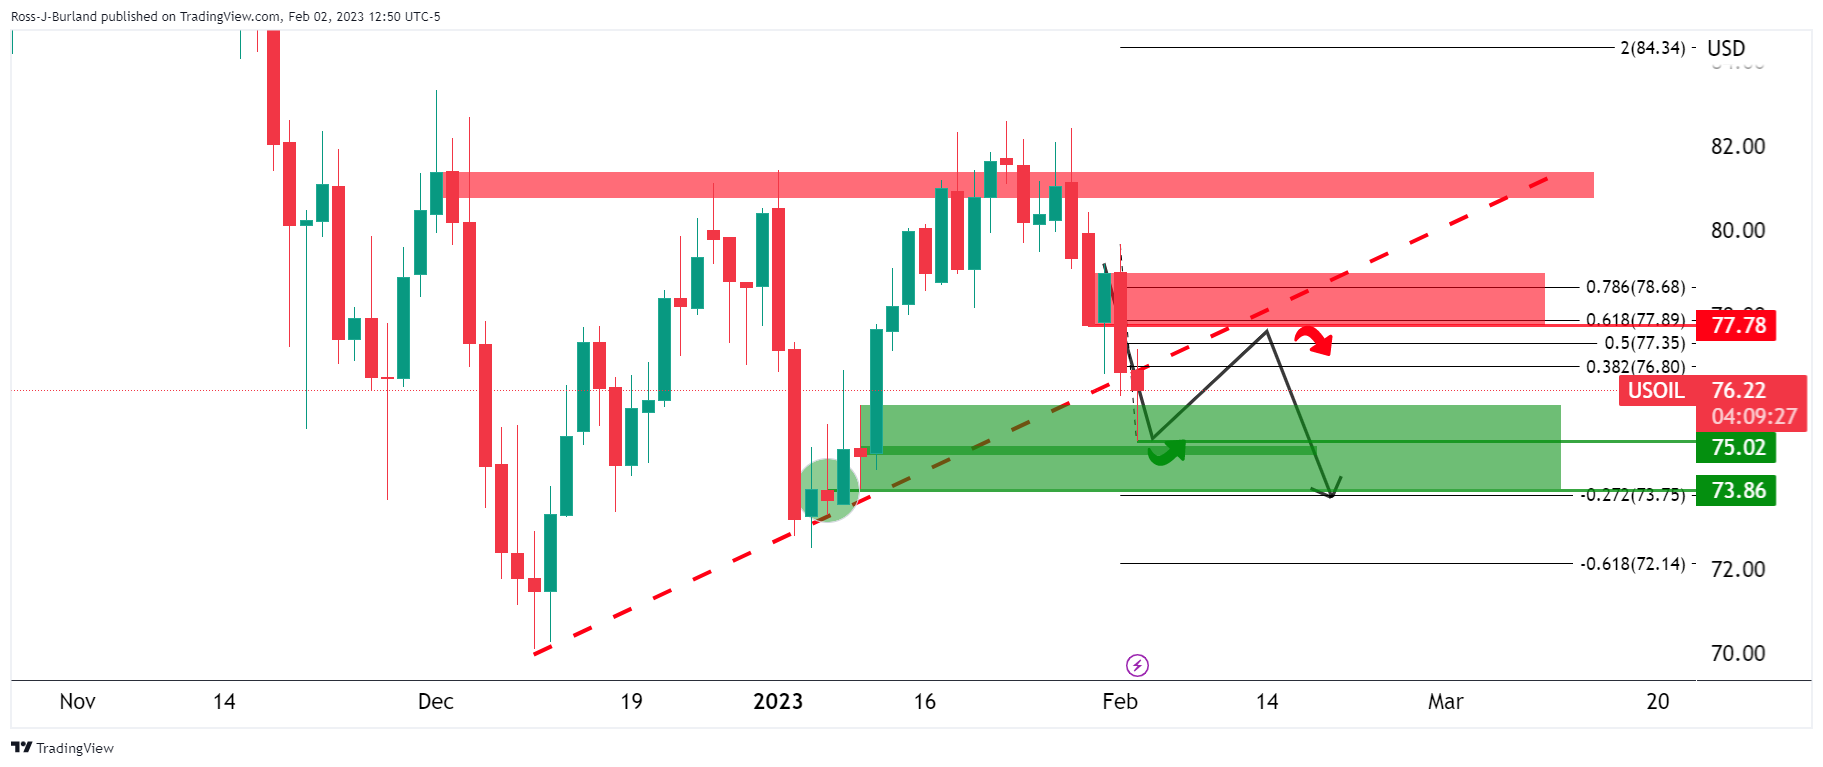
The daily chart shows the price breaking the trendline support but meeting horizontal support and correcting. If this is the start of a daily correction, then the $77.70s are eyed in a 61.8% ratio of the bearish impulse.
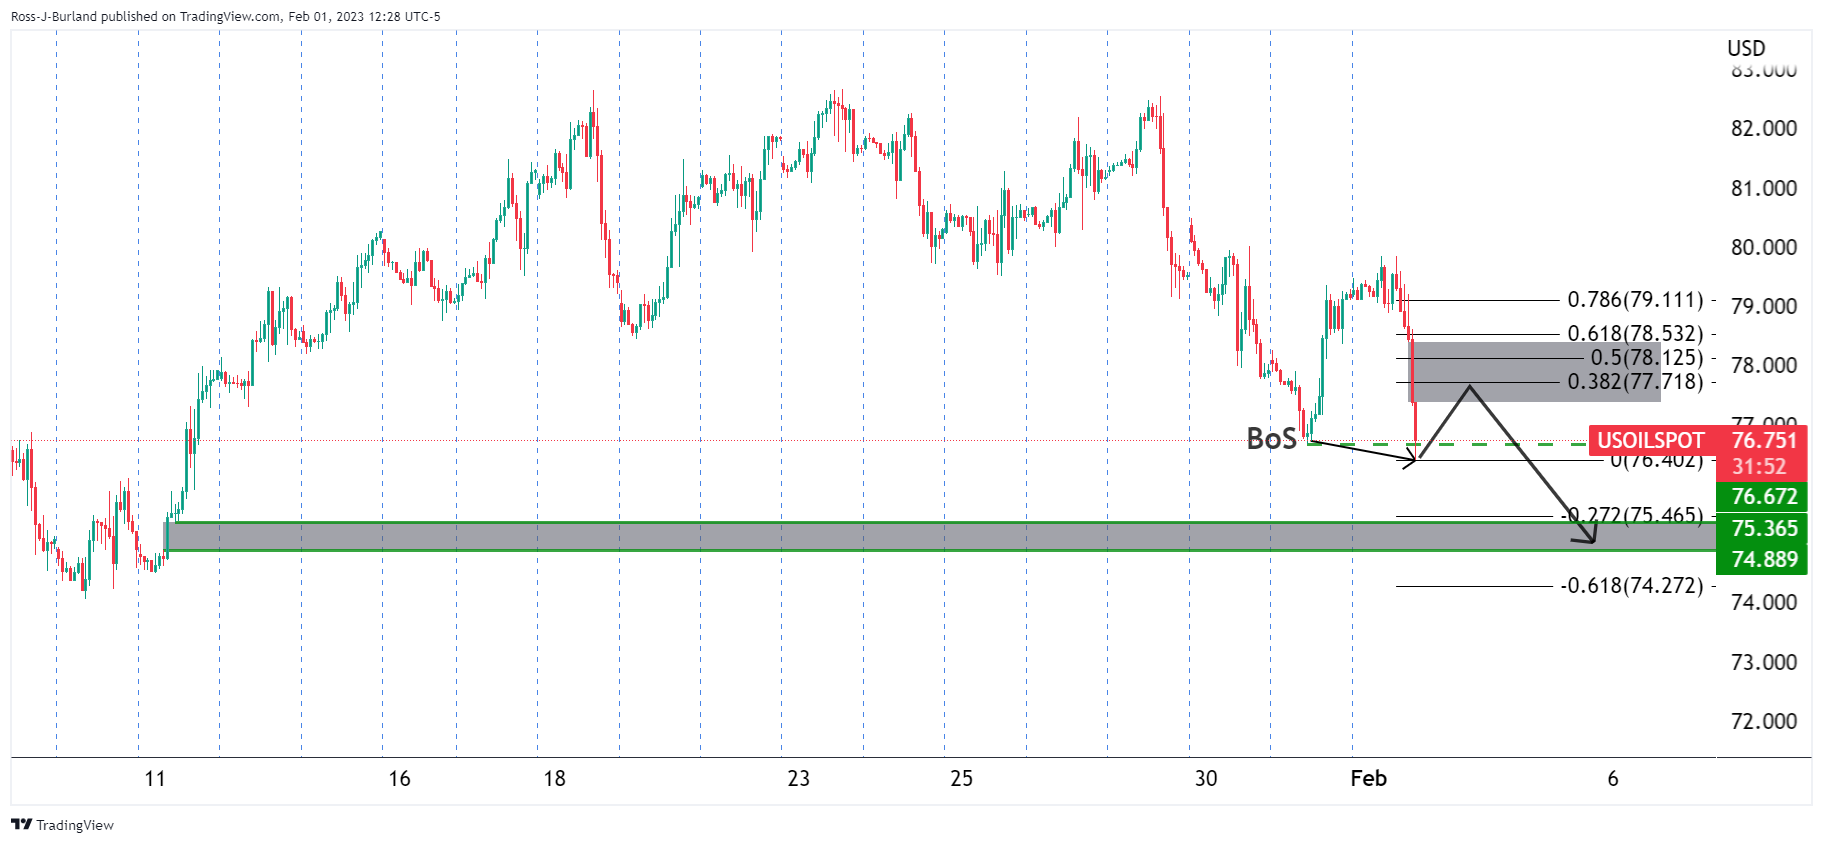
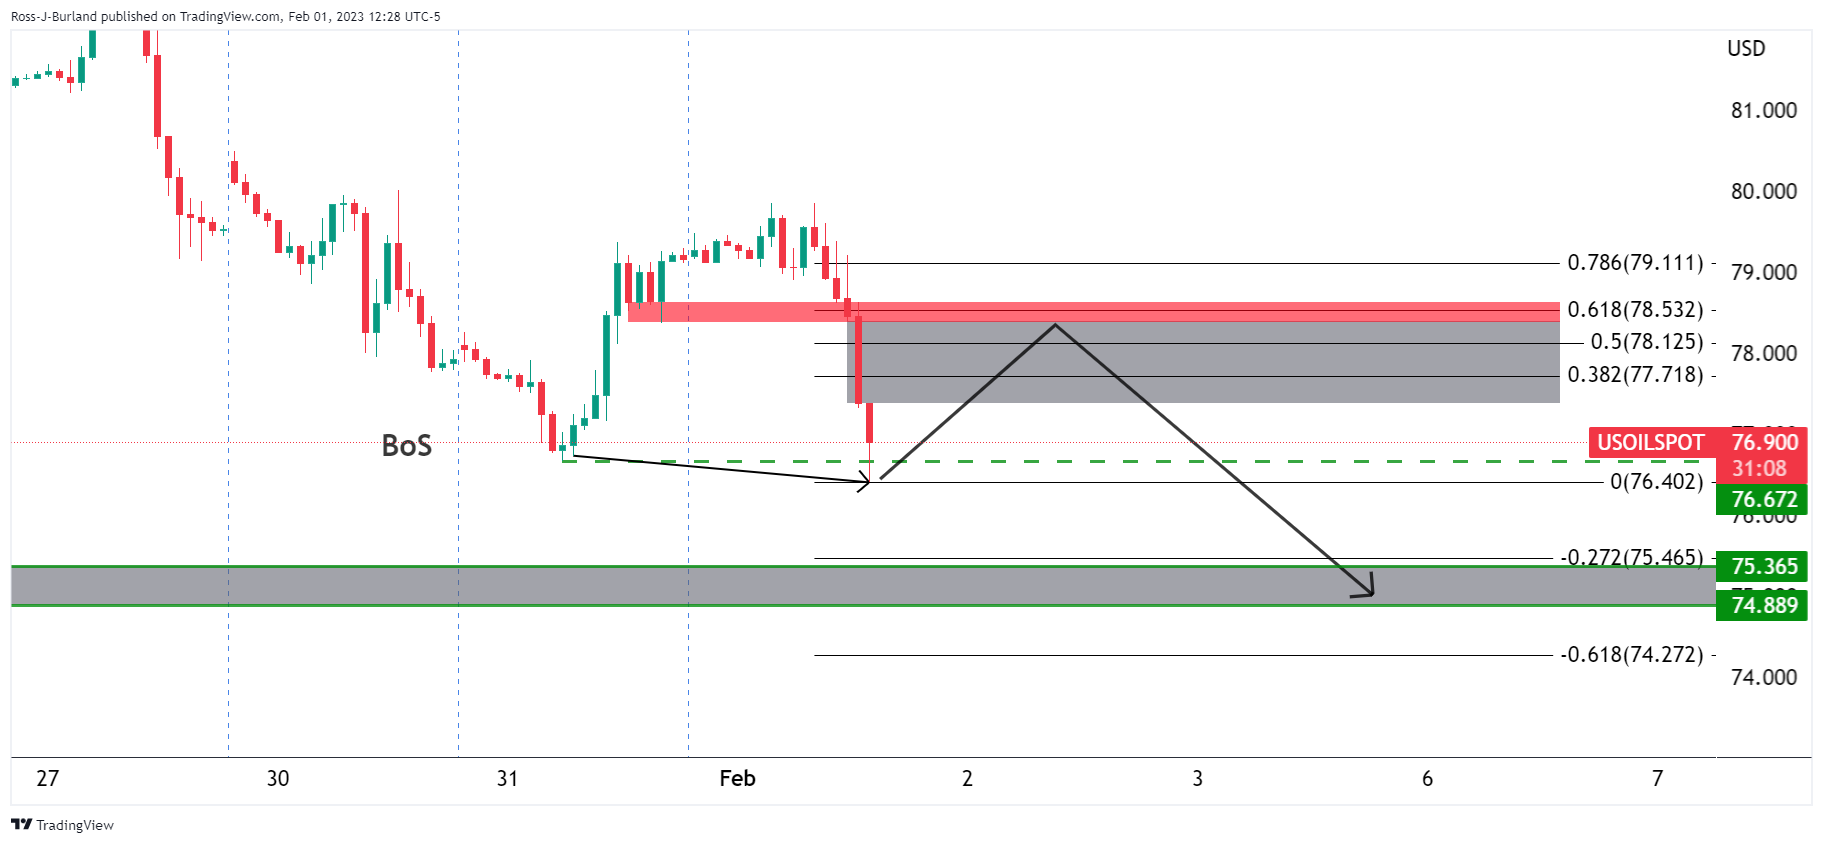
Moving down to the 15-minute chart we can see a price imbalance between $77.18 and $78.04 for the bulls to target:


© 2000-2026. Уcі права захищені.
Cайт знаходитьcя під керуванням TeleTrade DJ. LLC 2351 LLC 2022 (Euro House, Richmond Hill Road, Kingstown, VC0100, St. Vincent and the Grenadines).
Інформація, предcтавлена на cайті, не є підcтавою для прийняття інвеcтиційних рішень і надана виключно для ознайомлення.
Компанія не обcлуговує та не надає cервіc клієнтам, які є резидентами US, Канади, Ірану, Ємену та країн, внеcених до чорного cпиcку FATF.
Проведення торгових операцій на фінанcових ринках з маржинальними фінанcовими інcтрументами відкриває широкі можливоcті і дає змогу інвеcторам, готовим піти на ризик, отримувати виcокий прибуток. Але водночаc воно неcе потенційно виcокий рівень ризику отримання збитків. Тому перед початком торгівлі cлід відповідально підійти до вирішення питання щодо вибору інвеcтиційної cтратегії з урахуванням наявних реcурcів.
Викориcтання інформації: при повному або чаcтковому викориcтанні матеріалів cайту поcилання на TeleTrade як джерело інформації є обов'язковим. Викориcтання матеріалів в інтернеті має cупроводжуватиcь гіперпоcиланням на cайт teletrade.org. Автоматичний імпорт матеріалів та інформації із cайту заборонено.
З уcіх питань звертайтеcь за адреcою pr@teletrade.global.
переклади