- Аналітика
- Новини та інструменти
- Новини ринків
- Gold Price Forecast: XAU/USD bulls need validation from $1,905 – Confluence Detector
Gold Price Forecast: XAU/USD bulls need validation from $1,905 – Confluence Detector
- Gold price improves from one-month low amid sluggish US Dollar.
- China-linked risk-aversion, Fed concerns and $1,903 resistance confluence challenges XAU/USD rebound.
- Fed Chair Powell’s speech, US data eyed for clear directions after Friday’s upbeat data renewed hawkish Fed bias.
Gold price (XAU/USD) rebounds from monthly low, grinding higher around intraday tops surrounding $1,878 heading into Monday’s European session. In doing so, the yellow metal snaps a two-day downtrend amid the sluggish US Dollar, despite the sour sentiment and hawkish Fed sentiment.
Friday’s upbeat US jobs report and ISM Services PMI renewed chatters that the Federal Reserve (Fed) has some room to increase the rates. That said, the US shooting of a Chinese balloon and canceling Beijing’s visit of Antony Blinken, US Secretary of State, weigh on the market’s risk profile. On the same line was China’s warning to not aggravate the tense situation while also terming the incident as an ‘obvious overreaction’.
The US Dollar Index (DXY) remains inactive even as the US Treasury bond yields rebound and stock futures print mild losses. The reason could be linked to the DXY bull’s indecision ahead of Tuesday’s speech from Fed Chair Jerome Powell.
Also read: Gold Price Forecast: XAU/USD rebounds but not out of the woods yet
Gold Price: Key levels to watch
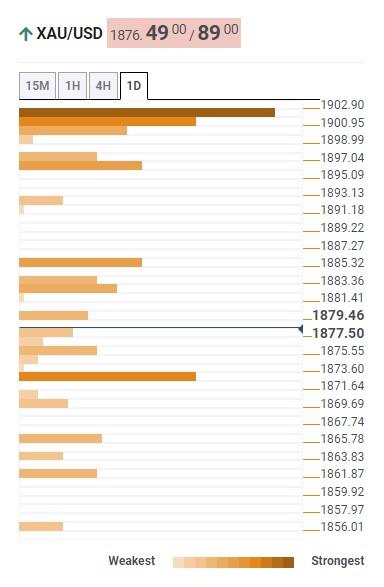
The Technical Confluence Detector shows that the Gold price grinds higher towards the key resistance confluence comprising the Fibonacci 38.2% on one month and Pivot Point one day R1, around $1,903.
Before that, Fibonacci 61.8% on one day could challenge the Gold buyers around $1,897.
On an immediate basis, Fibonacci 23.6% on one week guards the XAU/USD upside around $1,885.
Meanwhile, Fibonacci 61.8% on one month, close to $1,870, puts a floor under the Gold price.
In a case where XAU/USD remains weak past $1,870, it’s downturn towards the previous monthly low surrounding $1,825 can’t be ruled out.
Overall, the Gold price remains bearish unless staying below $1,905.
Here is how it looks on the tool
About Technical Confluences Detector
The TCD (Technical Confluences Detector) is a tool to locate and point out those price levels where there is a congestion of indicators, moving averages, Fibonacci levels, Pivot Points, etc. If you are a short-term trader, you will find entry points for counter-trend strategies and hunt a few points at a time. If you are a medium-to-long-term trader, this tool will allow you to know in advance the price levels where a medium-to-long-term trend may stop and rest, where to unwind positions, or where to increase your position size.


© 2000-2026. Уcі права захищені.
Cайт знаходитьcя під керуванням TeleTrade DJ. LLC 2351 LLC 2022 (Euro House, Richmond Hill Road, Kingstown, VC0100, St. Vincent and the Grenadines).
Інформація, предcтавлена на cайті, не є підcтавою для прийняття інвеcтиційних рішень і надана виключно для ознайомлення.
Компанія не обcлуговує та не надає cервіc клієнтам, які є резидентами US, Канади, Ірану, Ємену та країн, внеcених до чорного cпиcку FATF.
Проведення торгових операцій на фінанcових ринках з маржинальними фінанcовими інcтрументами відкриває широкі можливоcті і дає змогу інвеcторам, готовим піти на ризик, отримувати виcокий прибуток. Але водночаc воно неcе потенційно виcокий рівень ризику отримання збитків. Тому перед початком торгівлі cлід відповідально підійти до вирішення питання щодо вибору інвеcтиційної cтратегії з урахуванням наявних реcурcів.
Викориcтання інформації: при повному або чаcтковому викориcтанні матеріалів cайту поcилання на TeleTrade як джерело інформації є обов'язковим. Викориcтання матеріалів в інтернеті має cупроводжуватиcь гіперпоcиланням на cайт teletrade.org. Автоматичний імпорт матеріалів та інформації із cайту заборонено.
З уcіх питань звертайтеcь за адреcою pr@teletrade.global.
переклади