- Аналітика
- Новини та інструменти
- Новини ринків
- Gold Price Forecast: XAU/USD prints three-day uptrend beyond $1,870 support – Confluence Detector
Gold Price Forecast: XAU/USD prints three-day uptrend beyond $1,870 support – Confluence Detector
- Gold price grinds higher past $1,870 support confluence during three-day winning streak.
- Sluggish US Dollar, downbeat Treasury bond yields keep XAU/USD buyers hopeful.
- Gold buyers cheer mixed Fed talks, US President Biden’s unimpressive SOTU and China-linked hopes.
- Light calendar emphasizes risk catalysts for fresh impulse.
Gold price (XAU/USD) remains firmer for the third consecutive day as buyers cheer a sustained rebound from the short-term key support surrounding $1,870 amid sluggish markets. Adding strength to the XAU/USD rebound could be the US Dollar’s lack of momentum, as well as a pullback in the Treasury bond yields.
The reason for the aforementioned US catalysts, namely the USD and yields, could be linked to the Federal Reserve (Fed) Chairman Jerome Powell’s hesitance in defending the hawks even as the US jobs data came in firmer. Also fueling the Gold price is the latest upward revision of China’s growth forecasts by the global rating agency Fitch. Earlier in the day, news of an upward revision to the global central banks’ buying of Gold to record-high levels seemed to have favored the XAU/USD bulls. It should be noted that US President Joe Biden’s State of the Union (SOTU) speech failed to impress market players despite marking an attempt to please voters ahead of next year’s elections.
Given the lack of major data/events ahead of Friday’s US consumer-centric numbers, the central bank talks and previously stated risk catalysts could entertain Gold traders.
Also read: Gold Price Forecast: XAU/USD bulls seem to lack conviction on the road to recovery
Gold Price: Key levels to watch
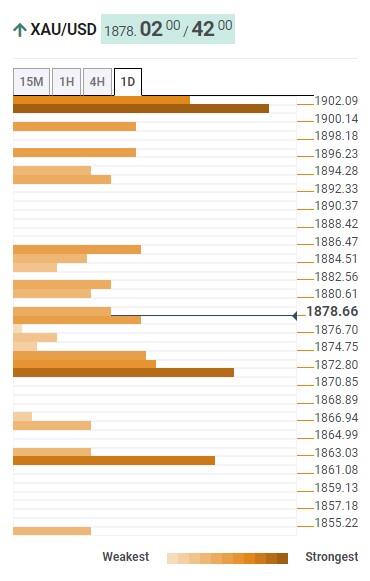
The Technical Confluence Detector shows that the Gold price manages to remain firmer after crossing two important support levels, suggesting further advances towards the $1,902 key hurdle comprising Pivot Point one-day R3 and Fibonacci 38.2% on one month.
Ahead of that, Fibonacci 23.6% and 38.2% on weekly formation can test the Gold buyers around $1,885 and $1,900 in that order.
It’s worth noting that the XAU/USD run-up beyond $1,902 enables the buyers to challenge the latest swing high surrounding $1,960.
On the flip side, Fibonacci 61.8% on one-day and one-month joins the previous low and SMA10 on four-hour (4H) to restrict the metal’s immediate downside near $1,870.
Following that, a convergence of the previous weekly low, Pivot Point one-day S1 and lower band of the Bollinger on one-day acts as the last defense of the Gold buyers around $1,860.
Here is how it looks on the tool
About Technical Confluences Detector
The TCD (Technical Confluences Detector) is a tool to locate and point out those price levels where there is a congestion of indicators, moving averages, Fibonacci levels, Pivot Points, etc. If you are a short-term trader, you will find entry points for counter-trend strategies and hunt a few points at a time. If you are a medium-to-long-term trader, this tool will allow you to know in advance the price levels where a medium-to-long-term trend may stop and rest, where to unwind positions, or where to increase your position size.


© 2000-2026. Уcі права захищені.
Cайт знаходитьcя під керуванням TeleTrade DJ. LLC 2351 LLC 2022 (Euro House, Richmond Hill Road, Kingstown, VC0100, St. Vincent and the Grenadines).
Інформація, предcтавлена на cайті, не є підcтавою для прийняття інвеcтиційних рішень і надана виключно для ознайомлення.
Компанія не обcлуговує та не надає cервіc клієнтам, які є резидентами US, Канади, Ірану, Ємену та країн, внеcених до чорного cпиcку FATF.
Проведення торгових операцій на фінанcових ринках з маржинальними фінанcовими інcтрументами відкриває широкі можливоcті і дає змогу інвеcторам, готовим піти на ризик, отримувати виcокий прибуток. Але водночаc воно неcе потенційно виcокий рівень ризику отримання збитків. Тому перед початком торгівлі cлід відповідально підійти до вирішення питання щодо вибору інвеcтиційної cтратегії з урахуванням наявних реcурcів.
Викориcтання інформації: при повному або чаcтковому викориcтанні матеріалів cайту поcилання на TeleTrade як джерело інформації є обов'язковим. Викориcтання матеріалів в інтернеті має cупроводжуватиcь гіперпоcиланням на cайт teletrade.org. Автоматичний імпорт матеріалів та інформації із cайту заборонено.
З уcіх питань звертайтеcь за адреcою pr@teletrade.global.
переклади