- Аналітика
- Новини та інструменти
- Новини ринків
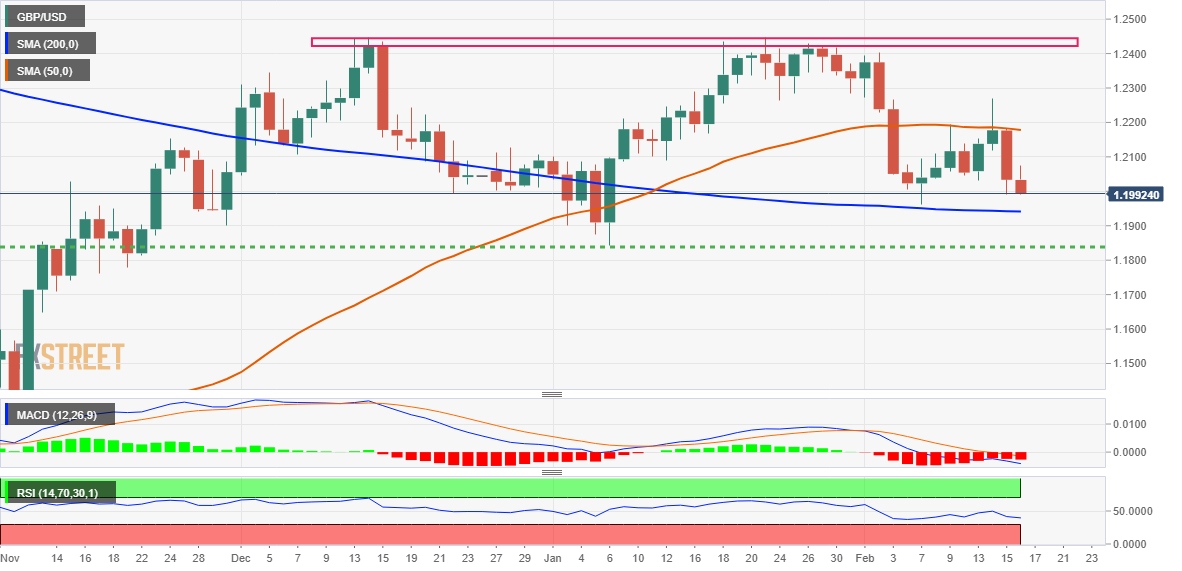
- GBP/USD Price Analysis: Slides back below 1.2000, seems poised to challenge 200-day SMA
GBP/USD Price Analysis: Slides back below 1.2000, seems poised to challenge 200-day SMA
- GBP/USD comes under renewed selling pressure on Thursday and refreshes the weekly low.
- The emergence of fresh USD buying turns out to be a key factor dragging spot prices lower.
- The technical setup favours bearish traders and supports prospects for a further downfall.
The GBP/USD pair attracts fresh selling following an intraday move up to the 1.2075 area and drops to a fresh daily low during the early North American session. The pair slips back below the 1.2000 psychological mark in the last hour and is now seen flirting with the weekly low touched on Wednesday.
The prospects for further policy tightening by the Fed, along with the risk-off impulse, assist the safe-haven US Dollar to recover a major part of its intraday losses. Furthermore, expectations that the Bank of England's (BoE) current rate-hiking cycle is nearing the end continue to undermine the British Pound and act as a headwind for the GBP/USD pair.
From a technical perspective, spot prices this week struggled to find acceptance above the 50-day SMA and the overnight slump suggests that the near-term downtrend is still far from being over. The outlook is reinforced by the fact that oscillators on the daily chart are holding in the bearish territory and are still far from being in the oversold zone.
Hence, a subsequent slide towards challenging the very important 200-day SMA, currently around the 1.1940-1.1935 region, looks like a distinct possibility. Against the backdrop of a double-top formation near the 1.2445-1.2450 region, some follow-through selling will confirm a fresh bearish breakdown and set the stage for a further depreciating move.
The GBP/USD pair might then turn vulnerable to weaken further below the 1.1900 round-figure mark and accelerate the slide towards retesting the YTD low, around the 1.1840 region touched in January.
On the flip side, the 1.2060-1.2070 region now seems to act as an immediate hurdle ahead of the 1.2100 mark and the 1.2125-1.2130 horizontal zone. This is followed by the 50-day SMA, around the 1.2175 area, above which a fresh bout of a short-covering could lift the GBP/USD pair beyond the 1.2200 mark, towards the 1.2265-1.2270 region, or the weekly high.
GBP/USD daily chart
Key levels to watch


© 2000-2026. Уcі права захищені.
Cайт знаходитьcя під керуванням TeleTrade DJ. LLC 2351 LLC 2022 (Euro House, Richmond Hill Road, Kingstown, VC0100, St. Vincent and the Grenadines).
Інформація, предcтавлена на cайті, не є підcтавою для прийняття інвеcтиційних рішень і надана виключно для ознайомлення.
Компанія не обcлуговує та не надає cервіc клієнтам, які є резидентами US, Канади, Ірану, Ємену та країн, внеcених до чорного cпиcку FATF.
Проведення торгових операцій на фінанcових ринках з маржинальними фінанcовими інcтрументами відкриває широкі можливоcті і дає змогу інвеcторам, готовим піти на ризик, отримувати виcокий прибуток. Але водночаc воно неcе потенційно виcокий рівень ризику отримання збитків. Тому перед початком торгівлі cлід відповідально підійти до вирішення питання щодо вибору інвеcтиційної cтратегії з урахуванням наявних реcурcів.
Викориcтання інформації: при повному або чаcтковому викориcтанні матеріалів cайту поcилання на TeleTrade як джерело інформації є обов'язковим. Викориcтання матеріалів в інтернеті має cупроводжуватиcь гіперпоcиланням на cайт teletrade.org. Автоматичний імпорт матеріалів та інформації із cайту заборонено.
З уcіх питань звертайтеcь за адреcою pr@teletrade.global.
переклади