- Аналітика
- Новини та інструменти
- Новини ринків
- Gold Price Forecast: XAU/USD exposes to $1,800 as Fed to reach terminal rate quickly
Gold Price Forecast: XAU/USD exposes to $1,800 as Fed to reach terminal rate quickly
- Gold price is exposed for further downside to near $1,800.00 amid hawkish Fed bets.
- The USD Index is showing signs of reversal as the Fed is expected to continue its policy tightening.
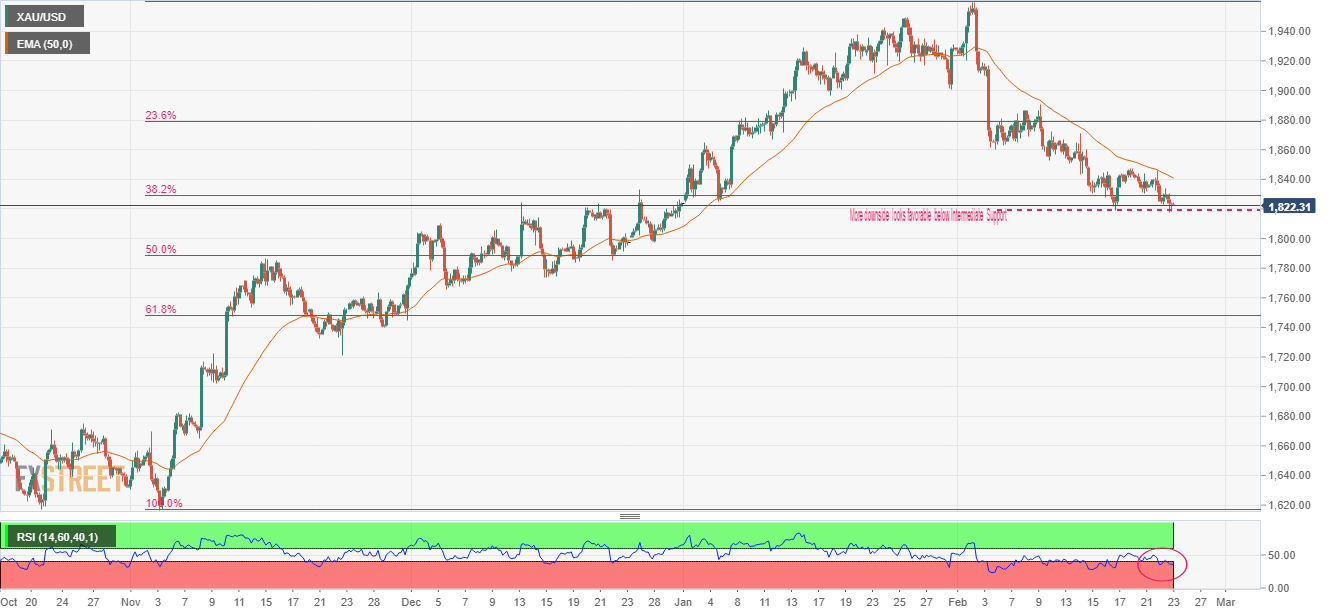
- Gold price has comfortably shifted below the 38.2% Fibonacci retracement at $1,829.45.
Gold price (XAU/USD) has printed a fresh seven-week low of $1,819.00 as the Federal Reserve (Fed) policymakers are favoring reaching the terminal rate as early as possible. The reason behind quickly accessing the terminal rate is the upbeat labor market in the United States, which could underpin the Consumer Price Index (CPI) sooner.
The US Dollar Index (DXY) is showing signs of reversal after a corrective move to near 104.15 as the Fed is expected to continue its policy tightening spell to achieve price stability. This has exposed the Gold price to continue its downside momentum to near the round-level support of $1.800.00.
S&P500 futures recovered on Thursday as investors believe that the US economy is not exposed to recession fears as the economic outlook is steady amid stellar retail demand and robust labor need. Contrary to that, the 10-year US Treasury yields dropped below 3.90%.
On Thursday, the number of people filing for jobless claims for the first time dropped to 192K vs. the consensus of 200K. This has signaled again that the labor market is extremely tight and consumer spending will remain robust ahead.
Economists at TD Securities expect 25 bps rate hikes in March and May, with the Fed settling on a terminal Fed funds target rate range of 5.00%-5.25% by May. And, Fed chair Jerome Powell will keep higher rates for a longer period.
Gold technical analysis
Gold price has comfortably shifted below the 38.2% Fibonacci retracement (placed from November 3 low at $1,616.69 to February 2 high at $1.959.71) at $1,829.45 on a four-hour scale. The precious metal is expected to display more weakness below the immediate support at $1,819.00.
The 50-period Exponential Moving Average (EMA) at $1,840.00 is acting as resistance for the Gold price.
Meanwhile, the Relative Strength Index (RSI) (14) has shifted into the bearish range of 20.00-40.00, which indicates more weakness ahead.
Gold four-hour chart


© 2000-2026. Уcі права захищені.
Cайт знаходитьcя під керуванням TeleTrade DJ. LLC 2351 LLC 2022 (Euro House, Richmond Hill Road, Kingstown, VC0100, St. Vincent and the Grenadines).
Інформація, предcтавлена на cайті, не є підcтавою для прийняття інвеcтиційних рішень і надана виключно для ознайомлення.
Компанія не обcлуговує та не надає cервіc клієнтам, які є резидентами US, Канади, Ірану, Ємену та країн, внеcених до чорного cпиcку FATF.
Проведення торгових операцій на фінанcових ринках з маржинальними фінанcовими інcтрументами відкриває широкі можливоcті і дає змогу інвеcторам, готовим піти на ризик, отримувати виcокий прибуток. Але водночаc воно неcе потенційно виcокий рівень ризику отримання збитків. Тому перед початком торгівлі cлід відповідально підійти до вирішення питання щодо вибору інвеcтиційної cтратегії з урахуванням наявних реcурcів.
Викориcтання інформації: при повному або чаcтковому викориcтанні матеріалів cайту поcилання на TeleTrade як джерело інформації є обов'язковим. Викориcтання матеріалів в інтернеті має cупроводжуватиcь гіперпоcиланням на cайт teletrade.org. Автоматичний імпорт матеріалів та інформації із cайту заборонено.
З уcіх питань звертайтеcь за адреcою pr@teletrade.global.
переклади