- Аналітика
- Новини та інструменти
- Новини ринків
- Gold Price Forecast: XAU/USD sees a downside below $1,800 as Fed looks set to raise rates above 5%
Gold Price Forecast: XAU/USD sees a downside below $1,800 as Fed looks set to raise rates above 5%
- Gold price is expected to continue its four-day losing streak amid hawkish Fed bets.
- Investors should be prepared for a surprise rise in US Durable Goods Orders as the households' demand has accelerated lately.
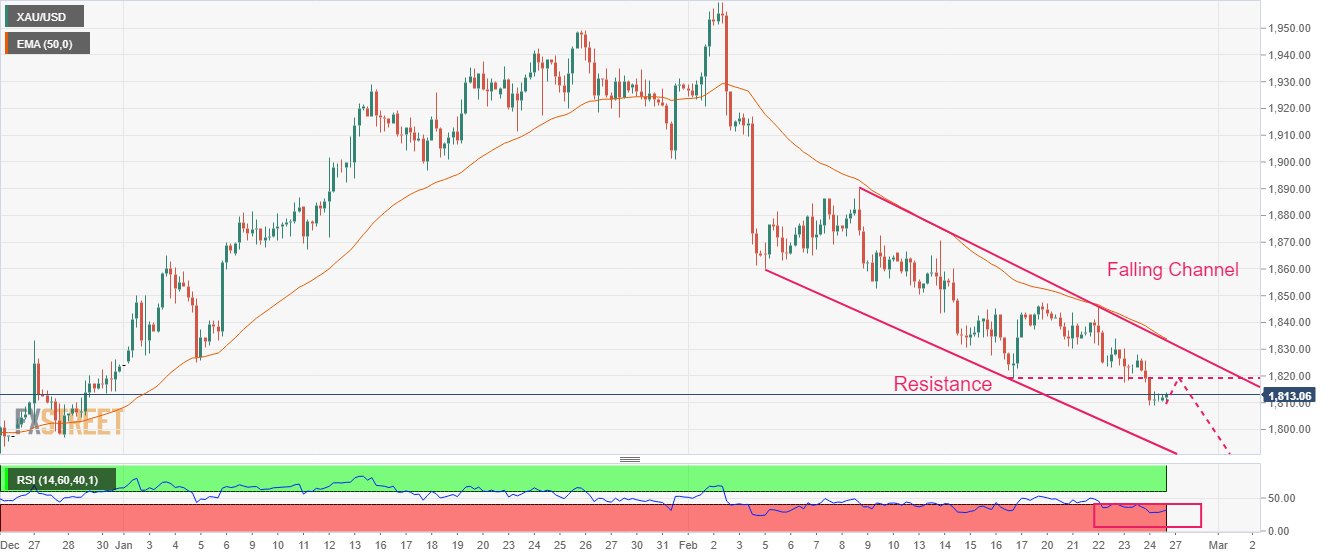
- Gold price is trading in a Falling Channel chart pattern in which every pullback is considered a selling opportunity.
Gold price (XAU/USD) is demonstrating a topsy-turvy auction around $1,810.00 in the Asian session. The precious metal is expected to continue its four-day losing streak after surrendering the immediate support of $1,809.00 as Federal Reserve (Fed) policymakers see interest rates above 5% after January’s hot inflation data..
Cleveland Fed Bank President Loretta Mester cited “Will need to go above 5% funds rate, stay there for a while.” He further added, “Data shows inflation not yet on trend to get back sustainably to 2% target.”
An escalation in the United States Personal Consumption Expenditure (PCE) price index by 0.6% in January has cleared that it would be early announcing victory for the battle against inflation. A strong labor cost index has propelled consumer spending, which could result in a recovery in the Producer Price Index (PPI) ahead.
The US Dollar Index (DXY) is struggling to continue the upside move toward the 105.00 resistance. S&P500 futures are showing nominal gains after a bearish Friday, portraying a sheer drop in the risk appetite of the market participants. The return delivered on 10-year US Treasury bonds has dropped marginally below 3.94%.
Going forward, the Gold price will display action post the release of the US Durable Goods Orders (Jan) data. The street is expecting a contraction of 4% lower than the expansion of 5.6% released earlier. Investors should be prepared for a surprise rise as the households' demand has accelerated lately.
Gold technical analysis
Gold price is trading in a Falling Channel chart pattern in which every pullback is considered as a selling opportunity before a reversal move. The yellow metal is expected to find resistance around $1,820.00 after a minor pullback move.
The 50-period Exponential Moving Average (EMA) at $1,833.80 is acting as a major barricade for the Gold bulls.
The Relative Strength Index (RSI) (14) is oscillating in the bearish range of 20.00-40.00, which advocates further downside.
Gold hourly chart


© 2000-2026. Уcі права захищені.
Cайт знаходитьcя під керуванням TeleTrade DJ. LLC 2351 LLC 2022 (Euro House, Richmond Hill Road, Kingstown, VC0100, St. Vincent and the Grenadines).
Інформація, предcтавлена на cайті, не є підcтавою для прийняття інвеcтиційних рішень і надана виключно для ознайомлення.
Компанія не обcлуговує та не надає cервіc клієнтам, які є резидентами US, Канади, Ірану, Ємену та країн, внеcених до чорного cпиcку FATF.
Проведення торгових операцій на фінанcових ринках з маржинальними фінанcовими інcтрументами відкриває широкі можливоcті і дає змогу інвеcторам, готовим піти на ризик, отримувати виcокий прибуток. Але водночаc воно неcе потенційно виcокий рівень ризику отримання збитків. Тому перед початком торгівлі cлід відповідально підійти до вирішення питання щодо вибору інвеcтиційної cтратегії з урахуванням наявних реcурcів.
Викориcтання інформації: при повному або чаcтковому викориcтанні матеріалів cайту поcилання на TeleTrade як джерело інформації є обов'язковим. Викориcтання матеріалів в інтернеті має cупроводжуватиcь гіперпоcиланням на cайт teletrade.org. Автоматичний імпорт матеріалів та інформації із cайту заборонено.
З уcіх питань звертайтеcь за адреcою pr@teletrade.global.
переклади