- Аналітика
- Новини та інструменти
- Новини ринків
- Gold Price Forecast: XAU/USD sets for action after sideways motion around $1,820 ahead of US PMI
Gold Price Forecast: XAU/USD sets for action after sideways motion around $1,820 ahead of US PMI
- Gold price is oscillating in a narrow range below $1,820.00 as investors await US Manufacturing PMI.
- S&P500 futures have added more gains to Monday’s recovery, indicating an improvement in investors’ risk appetite.
- The resilience observed in US consumer spending has forced the street to ramp up its terminal rate projections.
Gold price (XAU/USD) is demonstrating a sideways auction below $1,820.00 in the Asian session. The precious metal is expected to come out of the woods as investors are shifting their focus towards the United States ISM Manufacturing PMI (Feb), which is scheduled for Wednesday.
Investors should note that US Manufacturing PMI is contracting consecutively for the past three months. As per the consensus, the economic data is expected to contract again, however, the scale of contraction will be lower. The US Manufacturing PMI is seen at 48.0, lower than the former release of 47.4.
S&P500 futures have added more gains to Monday’s recovery in the Asian session, portraying an improvement in the risk appetite of the market participants. The US Dollar Index (DXY) is expected to demonstrate a volatility contraction till the release of the US ISM Manufacturing PMI data. The 10-year US Treasury yields are juggling around 3.92%.
Meanwhile, resilience observed in consumer spending (Feb) in the United States has forced the street to ramp up their terminal rate projections. A note from Bank of America (BofA) suggests Fed chair Jerome Powell announcing three more rate hikes this year considering the resilience in the demand-driven inflation. The BofA sees the terminal rate above 6% and recession appears more likely than a soft landing.
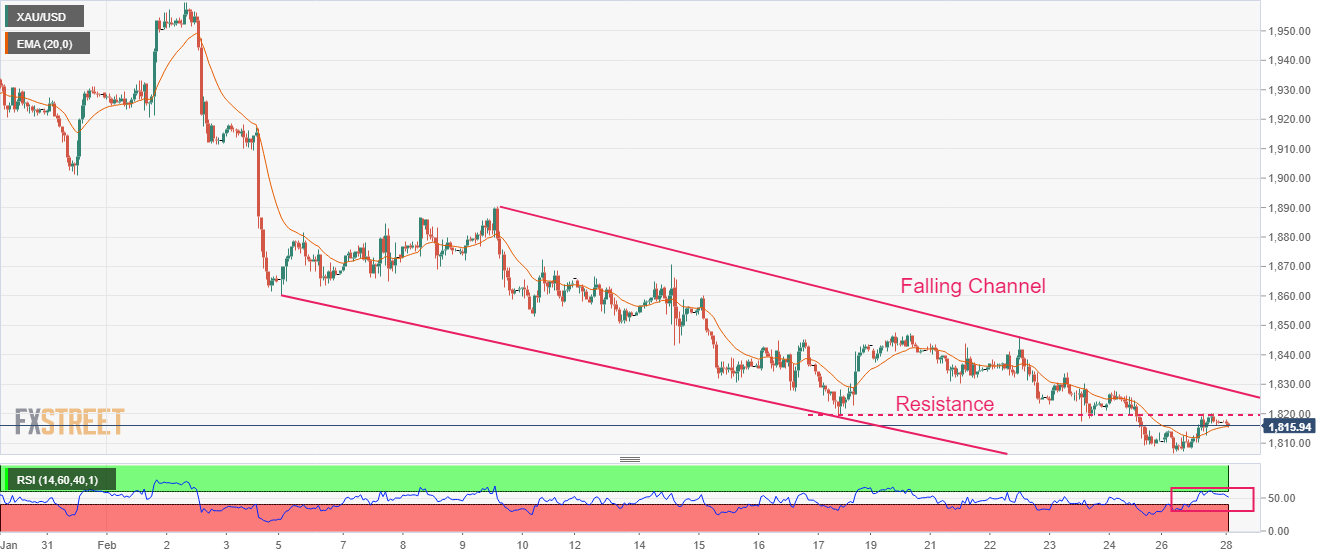
Gold technical analysis
Gold price is auctioning in a Falling Channel chart pattern in which every pullback is considered as a selling opportunity before a reversal move. The precious metal has sensed resistance around $1,820.00 after a minor pullback move.
The 20-period Exponential Moving Average (EMA) at $1,815.83 is providing a cushion to the Gold bulls.
The Relative Strength Index (RSI) (14) is attempting to shift into the bullish range of 60.00-80.00.
Gold hourly chart


© 2000-2026. Уcі права захищені.
Cайт знаходитьcя під керуванням TeleTrade DJ. LLC 2351 LLC 2022 (Euro House, Richmond Hill Road, Kingstown, VC0100, St. Vincent and the Grenadines).
Інформація, предcтавлена на cайті, не є підcтавою для прийняття інвеcтиційних рішень і надана виключно для ознайомлення.
Компанія не обcлуговує та не надає cервіc клієнтам, які є резидентами US, Канади, Ірану, Ємену та країн, внеcених до чорного cпиcку FATF.
Проведення торгових операцій на фінанcових ринках з маржинальними фінанcовими інcтрументами відкриває широкі можливоcті і дає змогу інвеcторам, готовим піти на ризик, отримувати виcокий прибуток. Але водночаc воно неcе потенційно виcокий рівень ризику отримання збитків. Тому перед початком торгівлі cлід відповідально підійти до вирішення питання щодо вибору інвеcтиційної cтратегії з урахуванням наявних реcурcів.
Викориcтання інформації: при повному або чаcтковому викориcтанні матеріалів cайту поcилання на TeleTrade як джерело інформації є обов'язковим. Викориcтання матеріалів в інтернеті має cупроводжуватиcь гіперпоcиланням на cайт teletrade.org. Автоматичний імпорт матеріалів та інформації із cайту заборонено.
З уcіх питань звертайтеcь за адреcою pr@teletrade.global.
переклади