- Аналітика
- Новини та інструменти
- Новини ринків
- GBP/USD Price Analysis: Bears look to seize control, break below 200 DMA awaited
GBP/USD Price Analysis: Bears look to seize control, break below 200 DMA awaited
- GBP/USD meets with aggressive supply on Thursday and dives back closer to the weekly low.
- The setup favours bears and supports prospects for an eventual break below the 200 DMA.
- A sustained move beyond the 50-day SMA is needed to negate the near-term bearish outlook.
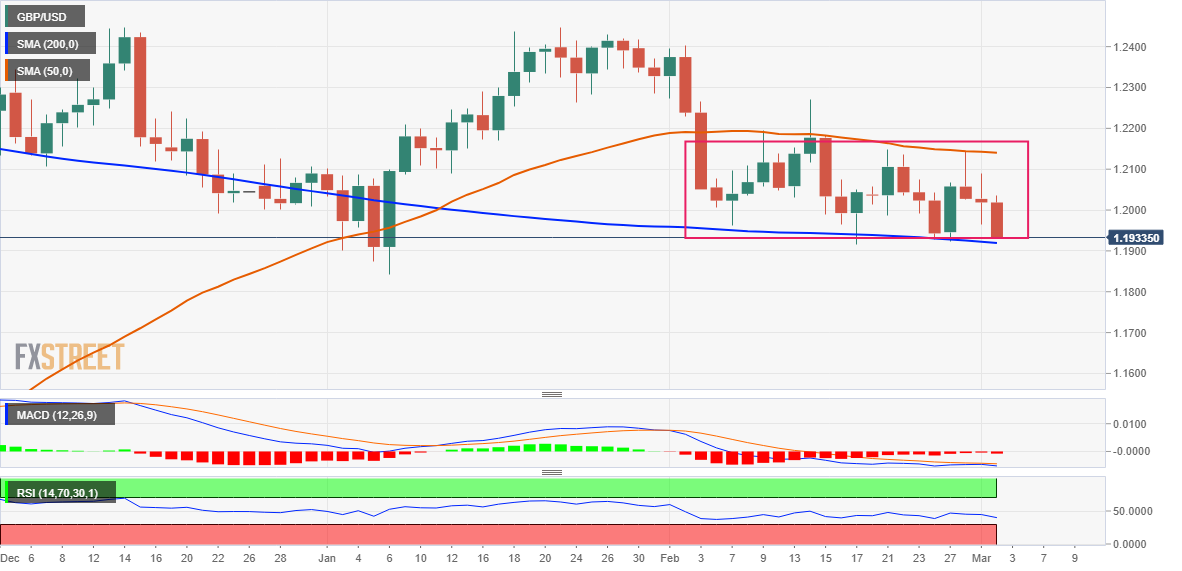
The GBP/USD pair comes under intense selling pressure on Thursday and extends its intraday downward trajectory heading into the North American session. The pair is currently placed below the mid-1.1900s, down over 0.60% for the day, and remains well within the striking distance of the weekly low touched on Monday.
Looking at the broader picture, the GBP/USD pair is trading just above a technically significant 200-day Simple Moving Average (SMA) support, currently pegged around the 1.1920-1.1915 region. The said area coincides with the lower end of a short-term trading range witnessed over the past two weeks or so, which constitutes the formation of a rectangle on the daily chart.
Given that oscillators on the daily have just started gaining negative traction, a convincing break below a technically significant SMA will be seen as a fresh trigger for bearish traders. The GBP/USD could then slide towards retesting the YTD low, around the 1.1840 area set in January, which if broken will complete a bearish double-top pattern formed near the 1.2445-1.2450 region.
On the flip side, attempted recovery moves might now confront stiff resistance near the 1.2000 psychological mark ahead of the daily swing high, around the 1.2035 region and the 1.2065-1.2070 supply zone. Any subsequent move-up could attract fresh sellers near the 1.2100 mark and remain capped near the 50-day SMA strong barrier, currently around the 1.2135-1.2140 area.
Some follow-through buying has the potential to lift the GBP/USD pair towards the 1.2200 round-figure mark en route to the February 14 swing high, around the 1.2265-1.2270 region. A sustained strength beyond the latter will suggest that the slide from the 1.2445-1.2450 supply zone has run its course and shift the near-term bias back in favour of bullish traders.
GBP/USD daily chart
Key levels to watch


© 2000-2026. Уcі права захищені.
Cайт знаходитьcя під керуванням TeleTrade DJ. LLC 2351 LLC 2022 (Euro House, Richmond Hill Road, Kingstown, VC0100, St. Vincent and the Grenadines).
Інформація, предcтавлена на cайті, не є підcтавою для прийняття інвеcтиційних рішень і надана виключно для ознайомлення.
Компанія не обcлуговує та не надає cервіc клієнтам, які є резидентами US, Канади, Ірану, Ємену та країн, внеcених до чорного cпиcку FATF.
Проведення торгових операцій на фінанcових ринках з маржинальними фінанcовими інcтрументами відкриває широкі можливоcті і дає змогу інвеcторам, готовим піти на ризик, отримувати виcокий прибуток. Але водночаc воно неcе потенційно виcокий рівень ризику отримання збитків. Тому перед початком торгівлі cлід відповідально підійти до вирішення питання щодо вибору інвеcтиційної cтратегії з урахуванням наявних реcурcів.
Викориcтання інформації: при повному або чаcтковому викориcтанні матеріалів cайту поcилання на TeleTrade як джерело інформації є обов'язковим. Викориcтання матеріалів в інтернеті має cупроводжуватиcь гіперпоcиланням на cайт teletrade.org. Автоматичний імпорт матеріалів та інформації із cайту заборонено.
З уcіх питань звертайтеcь за адреcою pr@teletrade.global.
переклади