- Аналітика
- Новини та інструменти
- Новини ринків
- Gold Price Forecast: XAU/USD juggles around $1,840 amid mixed market mood, US Services PMI in focus
Gold Price Forecast: XAU/USD juggles around $1,840 amid mixed market mood, US Services PMI in focus
- Gold price is oscillating near $1,840.00 as the risk profile looks obscure ahead of US Services PMI.
- More rate hikes from the Fed would dent the confidence of US firms.
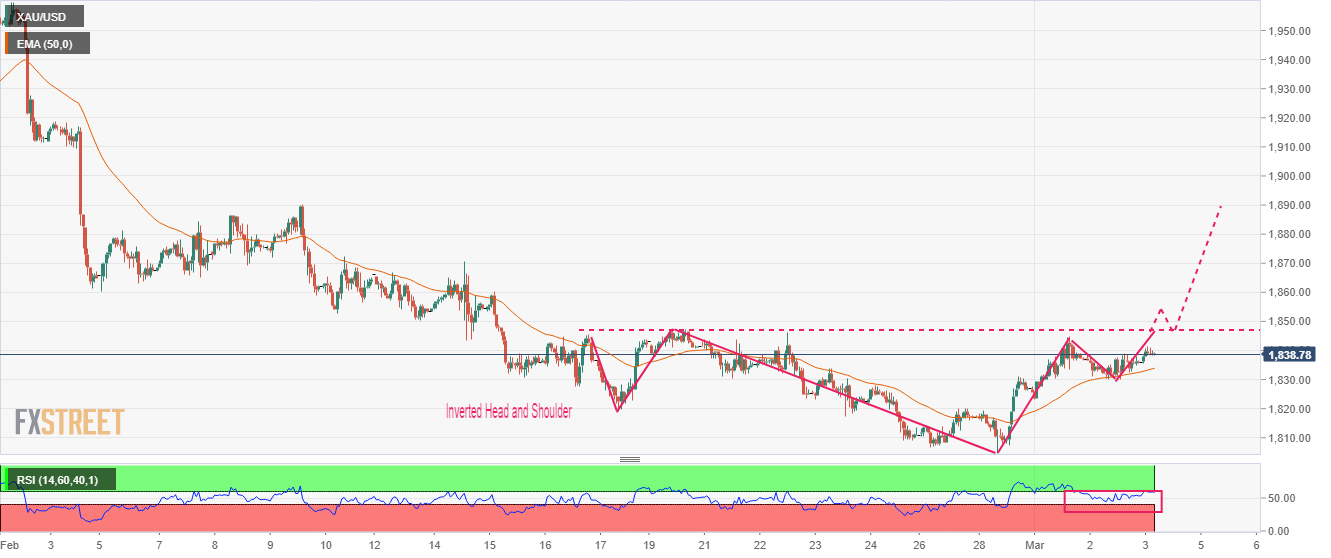
- Gold price is forming an Inverted H&S pattern that indicates a bullish reversal.
Gold price (XAU/USD) is displaying back-and-forth moves around $1,840.00 in the Asian session after a gradual move from $1,830.00. The precious metal has turned sideways amid mix market mood. The US Dollar Index (DXY) looks vulnerable above 104.80 and is likely to display a downside move further.
Long liquidations in the S&P500 futures have deepened in the Asian session as investors are getting anxious ahead of the release of the United States Services PMI by the Institute of Supply Management (ISM). The 500-US stocks basket futures displayed a sheer recovery on Thursday as geopolitical tensions between the US and China eased.
China’s Vice Commerce Minister said in a statement on Thursday, “China is willing to conduct candid consultations with the US to reduce restrictions on bilateral trade and investment.” He further added, “Need to create a stable and predictable economic and trade environment between China and US to enhance the confidence of business cooperation.”
Meanwhile, fears of more rates from Federal Reserve (Fed) chair Jerome Powell expected in the March monetary policy are not fading as further rate hikes could dent the confidence of producers. Also, the strong labor market could soften if lay-off programs in the technology firms stretch to other sectors.
Gold technical analysis
Gold price is forming an Inverted head and Shoulder chart pattern that indicates a prolonged consolidation and a breakout of the same confirms a bullish reversal. The neckline of the Inverted H&S chart pattern is plotted from February 20 high around $1,848.00. The 50-period Exponential Moving Average (EMA) is acting as a major support for the Gold bulls.
A break into the bullish range of 60.00-80.00 by the Relative Strength Index (RSI) (14) will trigger the upside momentum.
Gold hourly chart


© 2000-2026. Уcі права захищені.
Cайт знаходитьcя під керуванням TeleTrade DJ. LLC 2351 LLC 2022 (Euro House, Richmond Hill Road, Kingstown, VC0100, St. Vincent and the Grenadines).
Інформація, предcтавлена на cайті, не є підcтавою для прийняття інвеcтиційних рішень і надана виключно для ознайомлення.
Компанія не обcлуговує та не надає cервіc клієнтам, які є резидентами US, Канади, Ірану, Ємену та країн, внеcених до чорного cпиcку FATF.
Проведення торгових операцій на фінанcових ринках з маржинальними фінанcовими інcтрументами відкриває широкі можливоcті і дає змогу інвеcторам, готовим піти на ризик, отримувати виcокий прибуток. Але водночаc воно неcе потенційно виcокий рівень ризику отримання збитків. Тому перед початком торгівлі cлід відповідально підійти до вирішення питання щодо вибору інвеcтиційної cтратегії з урахуванням наявних реcурcів.
Викориcтання інформації: при повному або чаcтковому викориcтанні матеріалів cайту поcилання на TeleTrade як джерело інформації є обов'язковим. Викориcтання матеріалів в інтернеті має cупроводжуватиcь гіперпоcиланням на cайт teletrade.org. Автоматичний імпорт матеріалів та інформації із cайту заборонено.
З уcіх питань звертайтеcь за адреcою pr@teletrade.global.
переклади