- Аналітика
- Новини та інструменти
- Новини ринків
- Gold Price Forecast: XAU/USD continues to juggle above $1,900 despite US Inflation softens
Gold Price Forecast: XAU/USD continues to juggle above $1,900 despite US Inflation softens
- Gold price is struggling to come out of the woods despite the continuation of declining US Inflation.
- The USD Index is defending the critical support of 103.50 but looks prone to the further downside amid the risk-on mood.
- Monthly US Retail Sales data is expected to contract by 0.3% vs. the former release of 3% expansion.
Gold price (XAU/USD) is inside the woods despite the United States inflation figures meeting expectations. The precious metal is continuously oscillating in a narrow range of $1,895-1,913 from Monday. The release of the US Consumer Price Index (CPI) failed to deliver a power-pack action in the Gold price, however, the upside bias looks solidified as bets for smaller rate hikes from the Federal Reserve (Fed) have soared.
The US Dollar Index (DXY) is defending the critical support of 103.50 but looks prone to the further downside as investors’ risk appetite has improved dramatically. S&P500 futures witnessed responsive buying from the market participants as higher odds of a smaller rate hike from Fed chair Jerome Powell might postpone a likely recession in the US economy, portraying a sheer recovery in overall optimism.
Contrary to the risk-on mood, the demand for US Treasury bonds remained vulnerable, which led the 10-year US Treasury yields higher above 3.68%.
The headline US CPI was expanded by 0.4% on a monthly basis, as expected and the annual figure softened to 6.0% from the former release of 6.4%. And, the core CPI that excludes oil and food prices dropped marginally to 5.5% from the former release of 5.6%. The continuation of a declining trend in the US inflation seems delightful for the Fed.
Going forward, investors will keep an eye on the US Retail Sales (Feb) data. Monthly Retail Sales data is expected to contract by 0.3% vs. the former release of 3% expansion. This indicates that resilience in consumer spending is over and the Fed is on track of achieving the 2% inflation target.
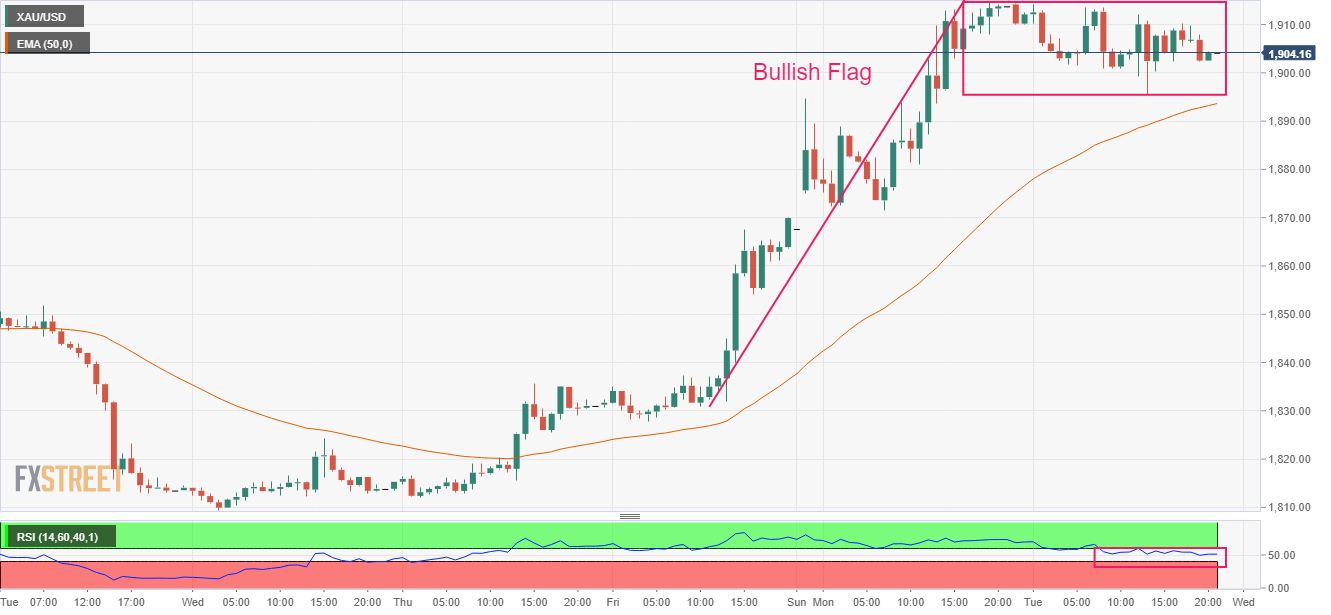
Gold technical analysis
Gold price is forming a Bullish Flag chart pattern on an hourly scale, which indicates a continuation of the bullish momentum after the breakout of a consolidation. Usually, the consolidation phase of the chart pattern serves as an inventory adjustment in which those participants initiate longs, which prefer to enter an auction after the establishment of a bullish bias.
Advancing 50-period Exponential Moving Average (EMA) at $1,894.00 add to the upside filters.
The Relative Strength Index (RSI) (14) is oscillating in a bullish range of 40.00-60.00. A break into the bullish range of 60.00-80.00 will trigger the upside momentum.
Gold hourly chart


© 2000-2026. Уcі права захищені.
Cайт знаходитьcя під керуванням TeleTrade DJ. LLC 2351 LLC 2022 (Euro House, Richmond Hill Road, Kingstown, VC0100, St. Vincent and the Grenadines).
Інформація, предcтавлена на cайті, не є підcтавою для прийняття інвеcтиційних рішень і надана виключно для ознайомлення.
Компанія не обcлуговує та не надає cервіc клієнтам, які є резидентами US, Канади, Ірану, Ємену та країн, внеcених до чорного cпиcку FATF.
Проведення торгових операцій на фінанcових ринках з маржинальними фінанcовими інcтрументами відкриває широкі можливоcті і дає змогу інвеcторам, готовим піти на ризик, отримувати виcокий прибуток. Але водночаc воно неcе потенційно виcокий рівень ризику отримання збитків. Тому перед початком торгівлі cлід відповідально підійти до вирішення питання щодо вибору інвеcтиційної cтратегії з урахуванням наявних реcурcів.
Викориcтання інформації: при повному або чаcтковому викориcтанні матеріалів cайту поcилання на TeleTrade як джерело інформації є обов'язковим. Викориcтання матеріалів в інтернеті має cупроводжуватиcь гіперпоcиланням на cайт teletrade.org. Автоматичний імпорт матеріалів та інформації із cайту заборонено.
З уcіх питань звертайтеcь за адреcою pr@teletrade.global.
переклади