- Аналітика
- Новини та інструменти
- Новини ринків
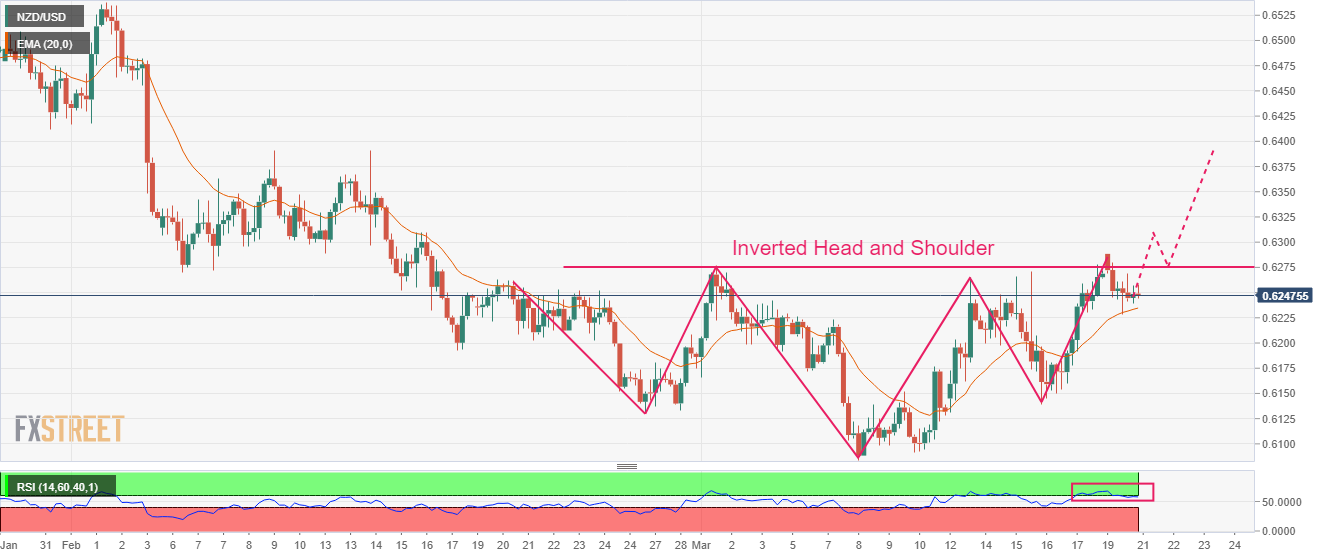
- NZD/USD Price Analysis: Formation of an Inverted H&S favors a solid upside
NZD/USD Price Analysis: Formation of an Inverted H&S favors a solid upside
- NZD/USD has remained sideways after failing to recapture the immediate resistance of 0.6280.
- The formation of an Inverted H&S formation solidifies a bullish reversal ahead.
- The 20-period EMA at 0.6234 is providing a cushion to the New Zealand Dollar.
The NZD/USD pair is making efforts in defending the critical support of 0.6240 in the early Asian session. The Kiwi asset has remained sideways from Monday after failing to recapture the immediate resistance of 0.6280. Mixed responses to the interest rate policy of the Federal Reserve (Fed) have shifted the major to the sideline.
S&P500 futures have continued their upside momentum after a decent recovery on Monday, portraying appreciation in the risk-taking ability of the market participants. The US Dollar Index (DXY) continued its losing spell on Monday led by United States banking shakedown.
The New Zealand Dollar didn’t display any significant action on steady monetary policy by the People’s Bank of China (PBoC). The street was anticipating further rate cuts to spurt the overall demand in the Chinese economy. It is worth noting that New Zealand is one of the crucial trading partners of China and further expansion in PBoC’s monetary policy would have supported the New Zealand Dollar.
NZD/USD is forming an Inverted Head and Shoulder chart pattern on a four-hour scale. The chart pattern displays a prolonged consolidation and results in a bullish reversal after a breakout of the neckline, which is plotted from the March 01 high at 0.6276.
The 20-period Exponential Moving Average (EMA) at 0.6234 is providing a cushion to the New Zealand Dollar.
Meanwhile, the Relative Strength Index (RSI) (14) is making efforts in reclaiming the bullish range of 60.00-80.00. An occurrence of the same would solidify the Kiwi asset further.
A buying opportunity in the Kiwi asset will emerge it will surpass March 1 high at 0.6276, which will drive the pair toward the round-level resistance at 0.6300 followed by February 14 high at 0.6389.
In an alternate scenario, a breakdown of the January 6 low at 0.6193 will drag the asset toward November 28 low at 0.6155. A slippage below the latter will expose the asset for more downside toward the round-level support at 0.6100.
NZD/USD four-hour chart


© 2000-2026. Уcі права захищені.
Cайт знаходитьcя під керуванням TeleTrade DJ. LLC 2351 LLC 2022 (Euro House, Richmond Hill Road, Kingstown, VC0100, St. Vincent and the Grenadines).
Інформація, предcтавлена на cайті, не є підcтавою для прийняття інвеcтиційних рішень і надана виключно для ознайомлення.
Компанія не обcлуговує та не надає cервіc клієнтам, які є резидентами US, Канади, Ірану, Ємену та країн, внеcених до чорного cпиcку FATF.
Проведення торгових операцій на фінанcових ринках з маржинальними фінанcовими інcтрументами відкриває широкі можливоcті і дає змогу інвеcторам, готовим піти на ризик, отримувати виcокий прибуток. Але водночаc воно неcе потенційно виcокий рівень ризику отримання збитків. Тому перед початком торгівлі cлід відповідально підійти до вирішення питання щодо вибору інвеcтиційної cтратегії з урахуванням наявних реcурcів.
Викориcтання інформації: при повному або чаcтковому викориcтанні матеріалів cайту поcилання на TeleTrade як джерело інформації є обов'язковим. Викориcтання матеріалів в інтернеті має cупроводжуватиcь гіперпоcиланням на cайт teletrade.org. Автоматичний імпорт матеріалів та інформації із cайту заборонено.
З уcіх питань звертайтеcь за адреcою pr@teletrade.global.
переклади